

For Wisconsin businesses considering solar energy, understanding your utility rate structure is one of the most important steps in evaluating potential savings. While solar panels directly offset electricity consumption, the financial benefits of a solar investment can vary significantly depending on how your utility charges both electricity and demand rates.
Commercial electric bills in Wisconsin are typically made up of two primary components: energy charges and demand charges. Knowing which rate structure applies to your facility can help determine the ideal solar system design and maximize long-term returns.
Energy-Only Rates
Many small commercial customers are billed primarily based on the amount of electricity they consume each month. This type of billing structure charges businesses for every kilowatt-hour (kWh) of electricity used, making it one of the simplest utility rate structures.
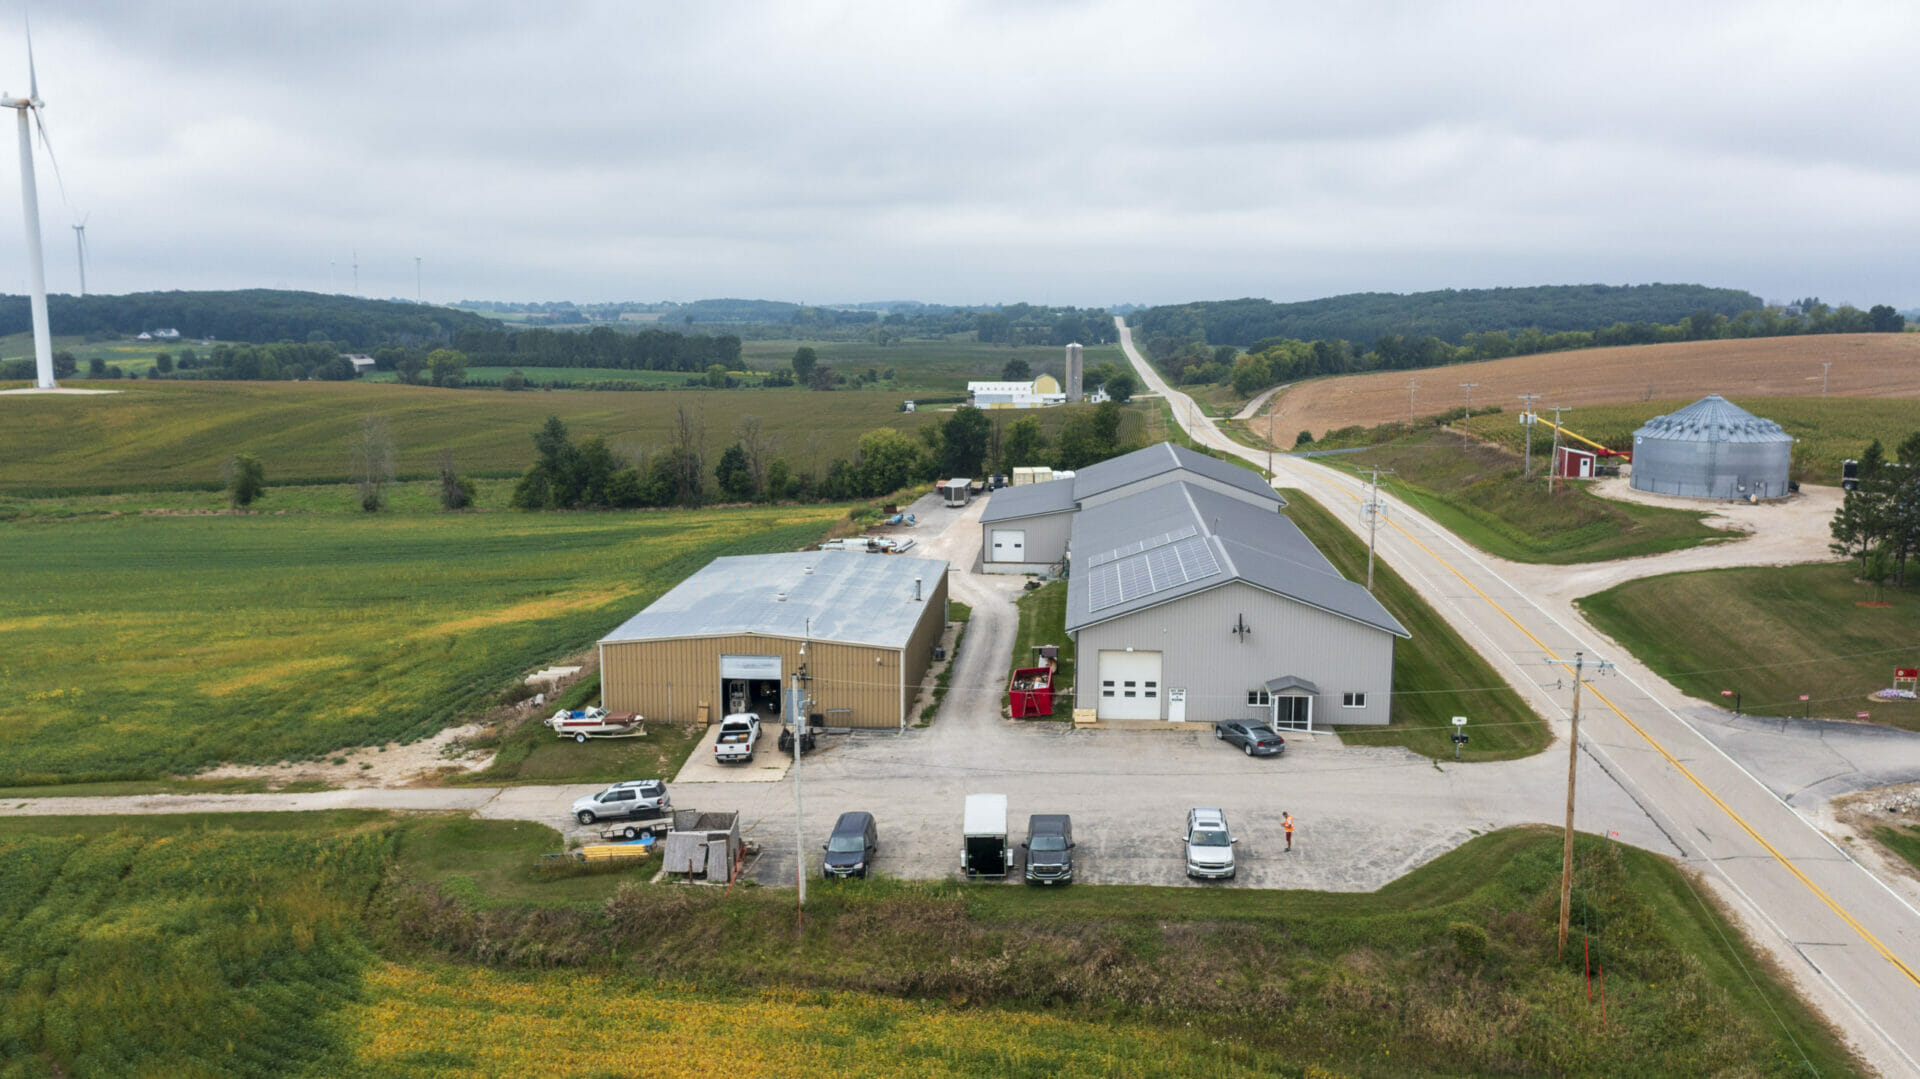
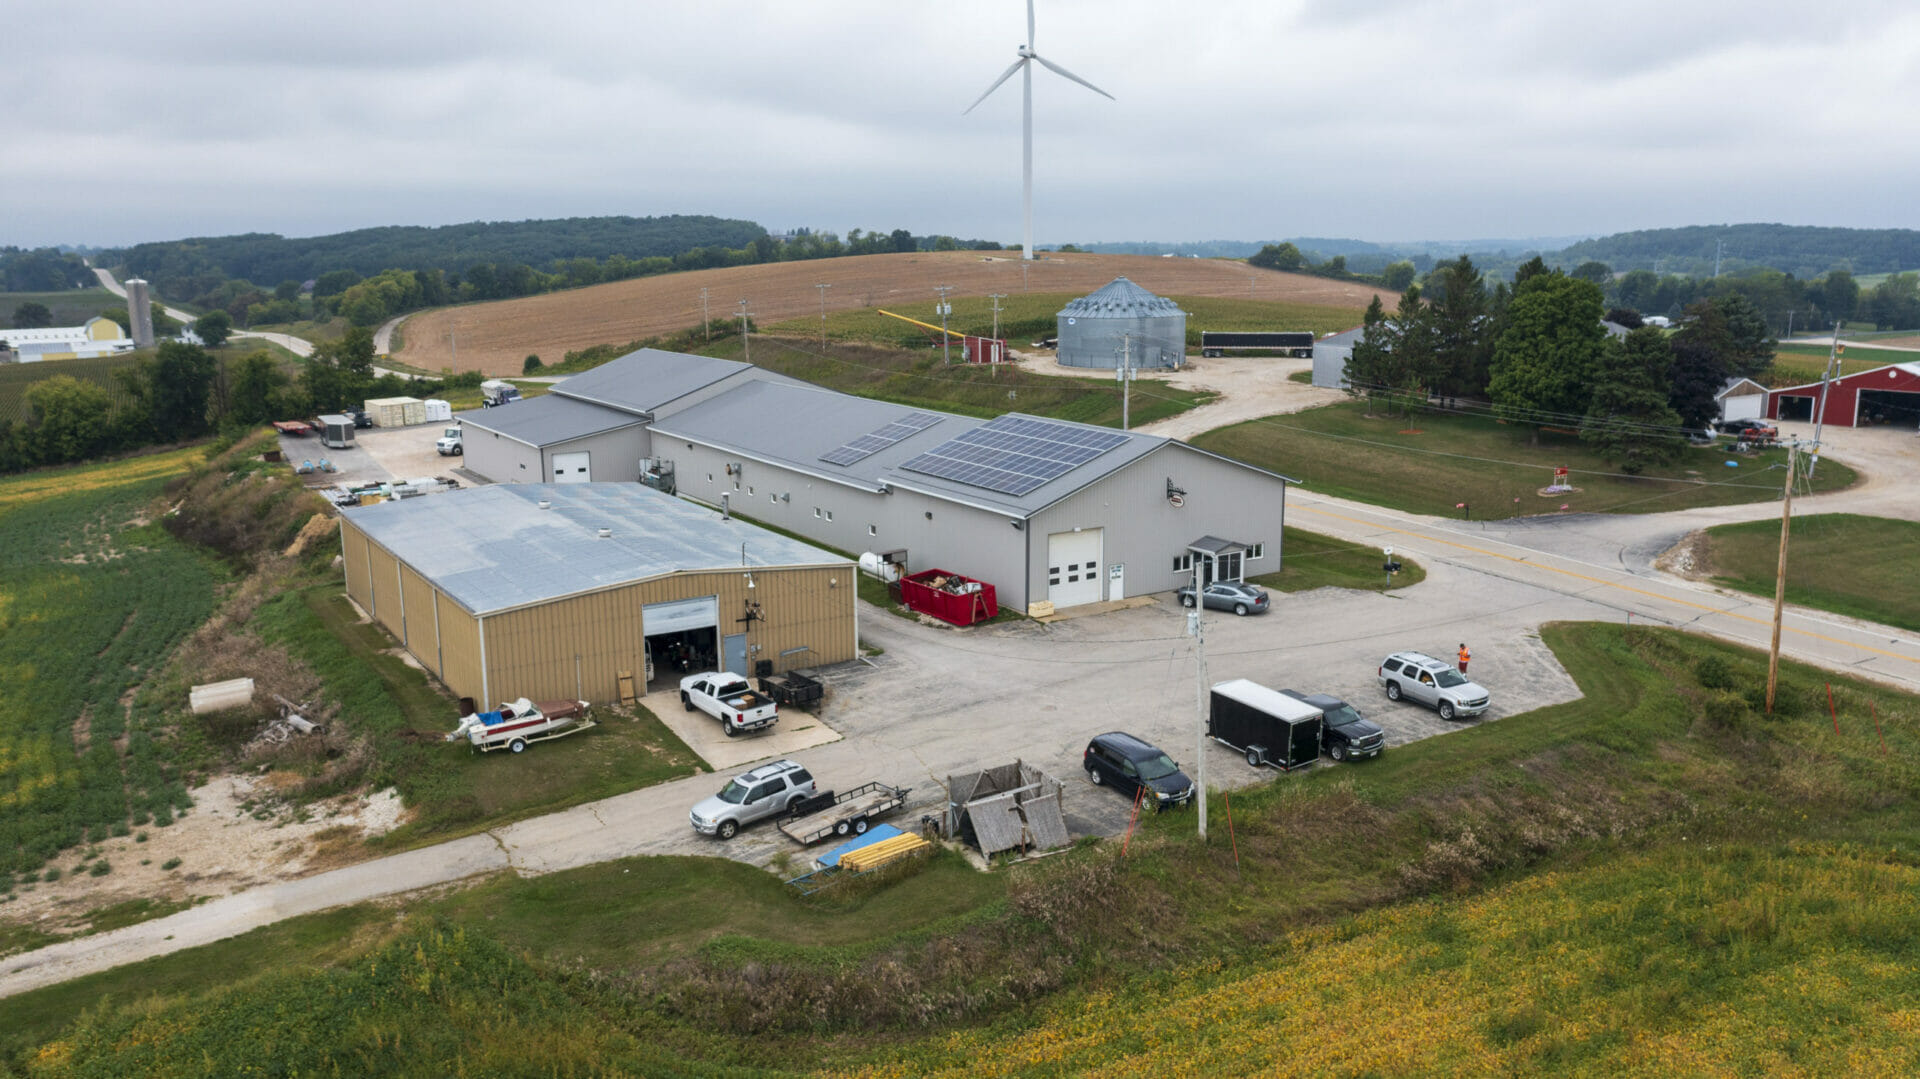
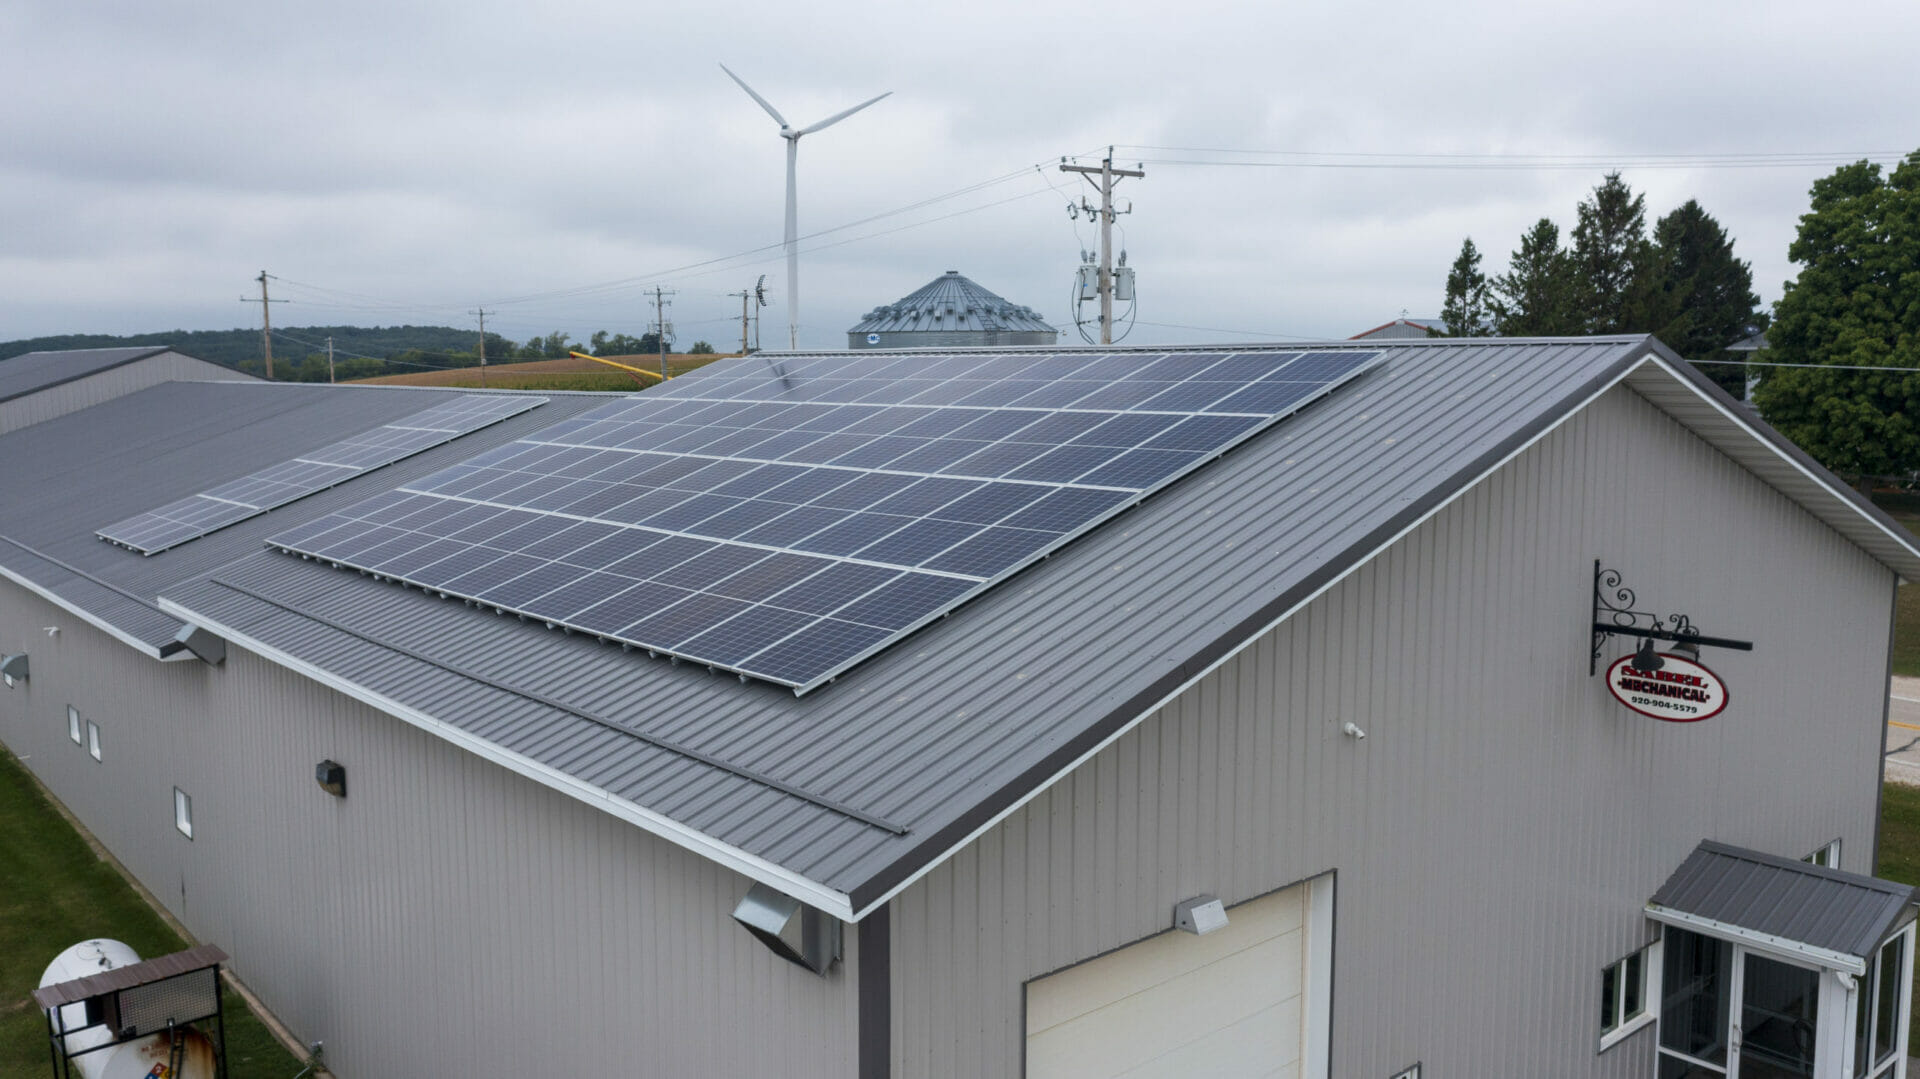
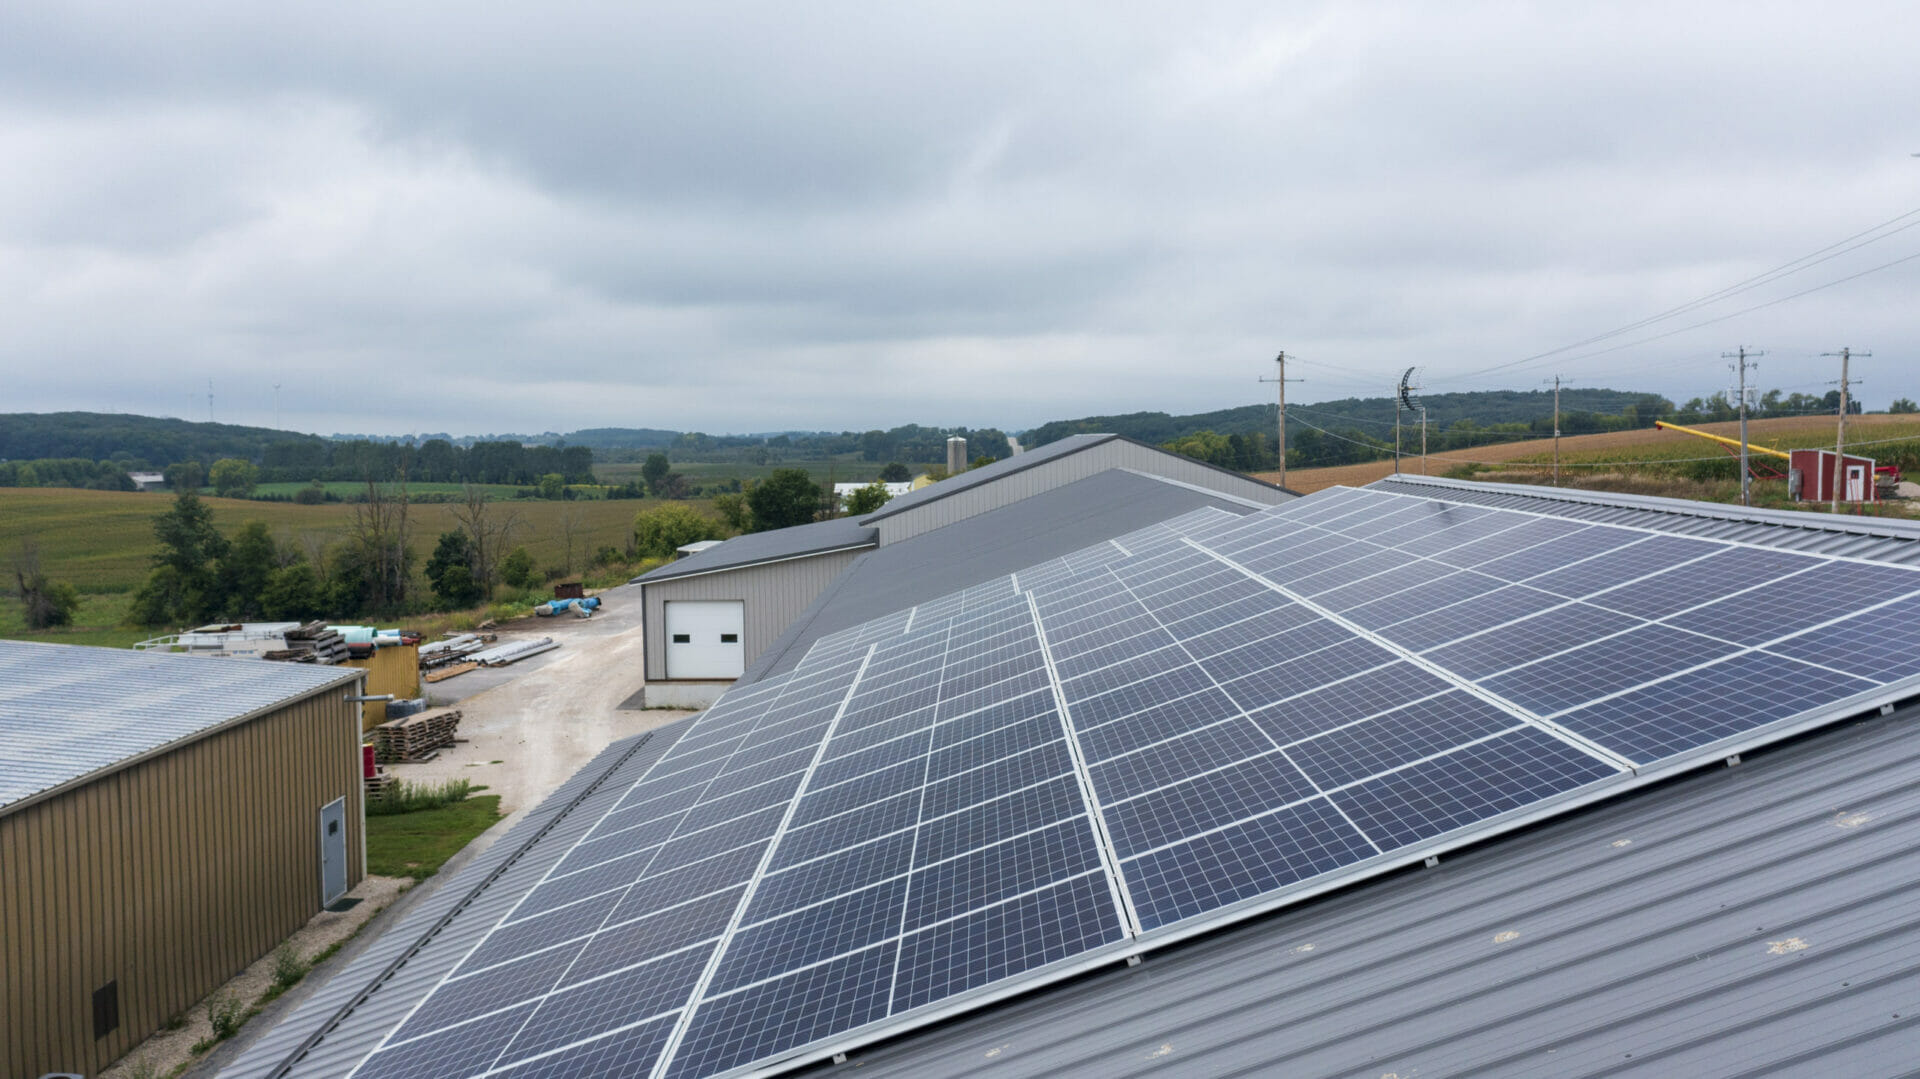
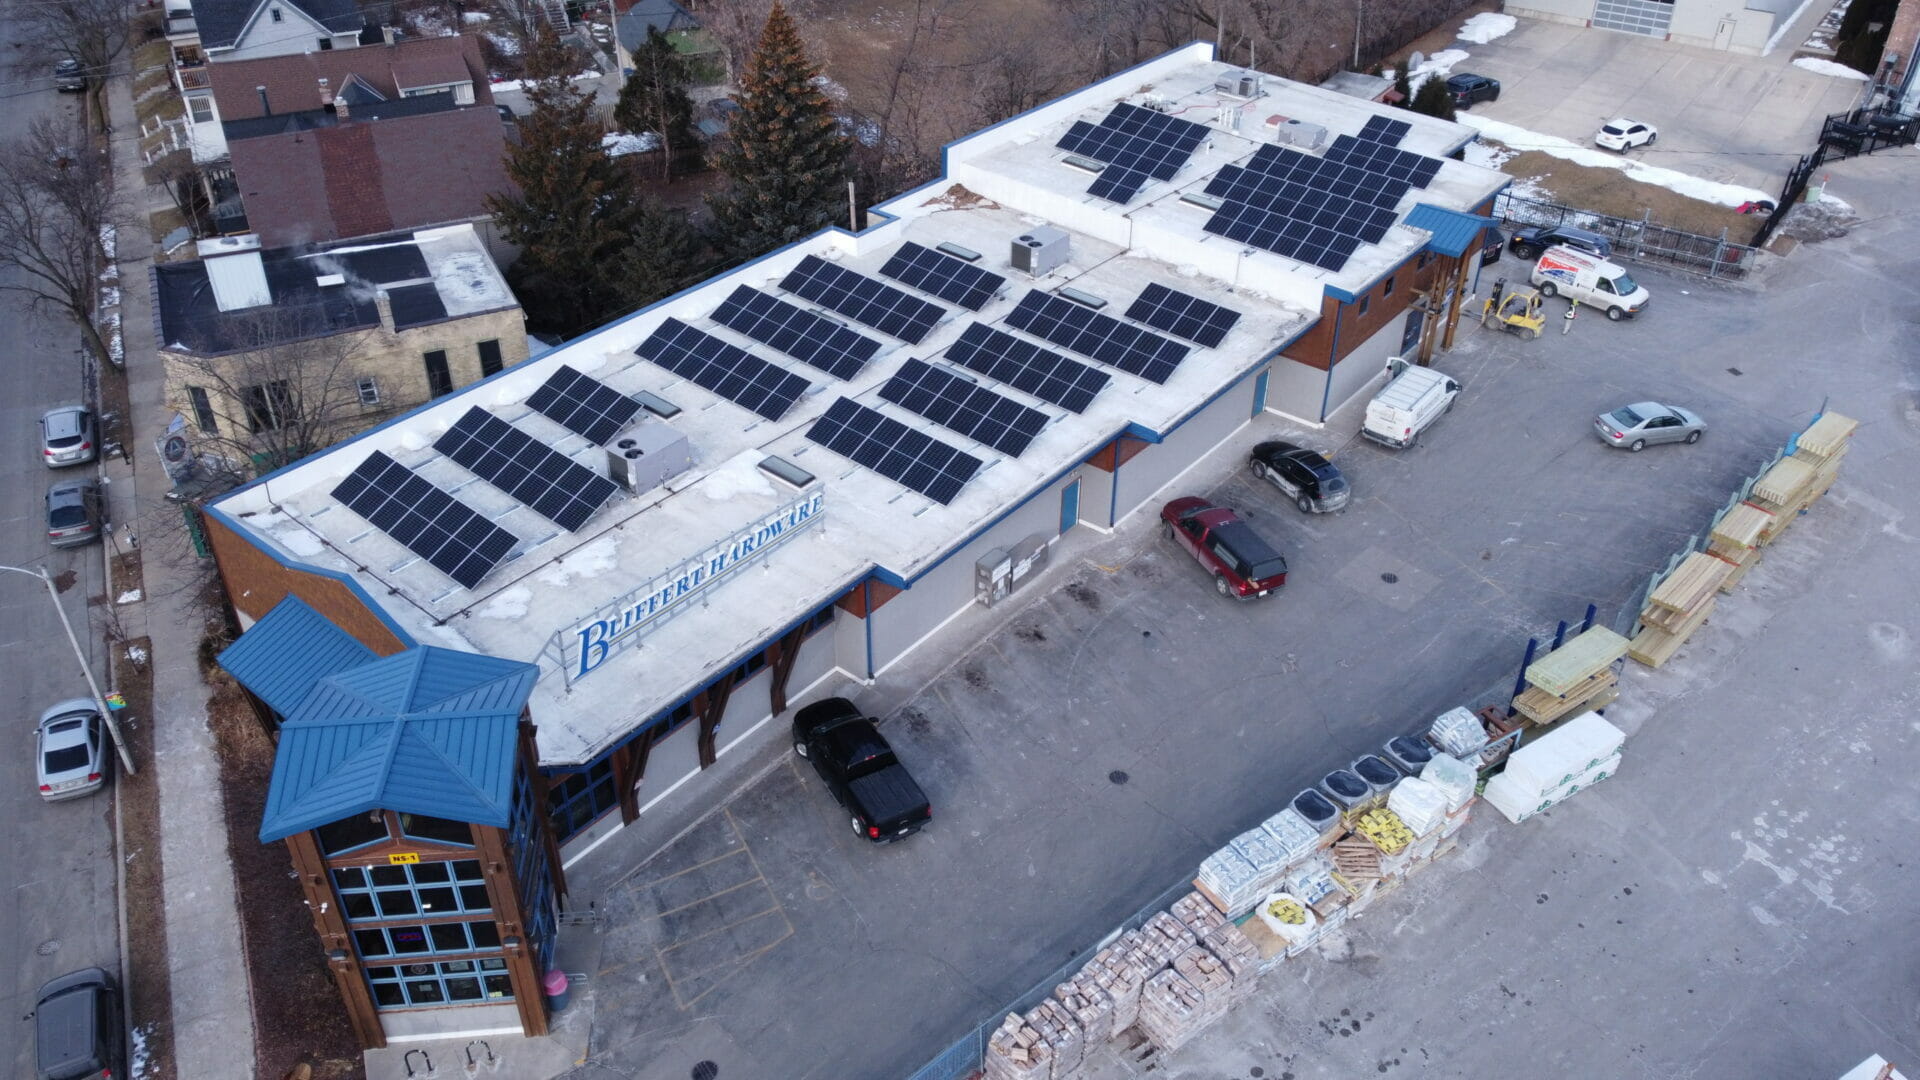
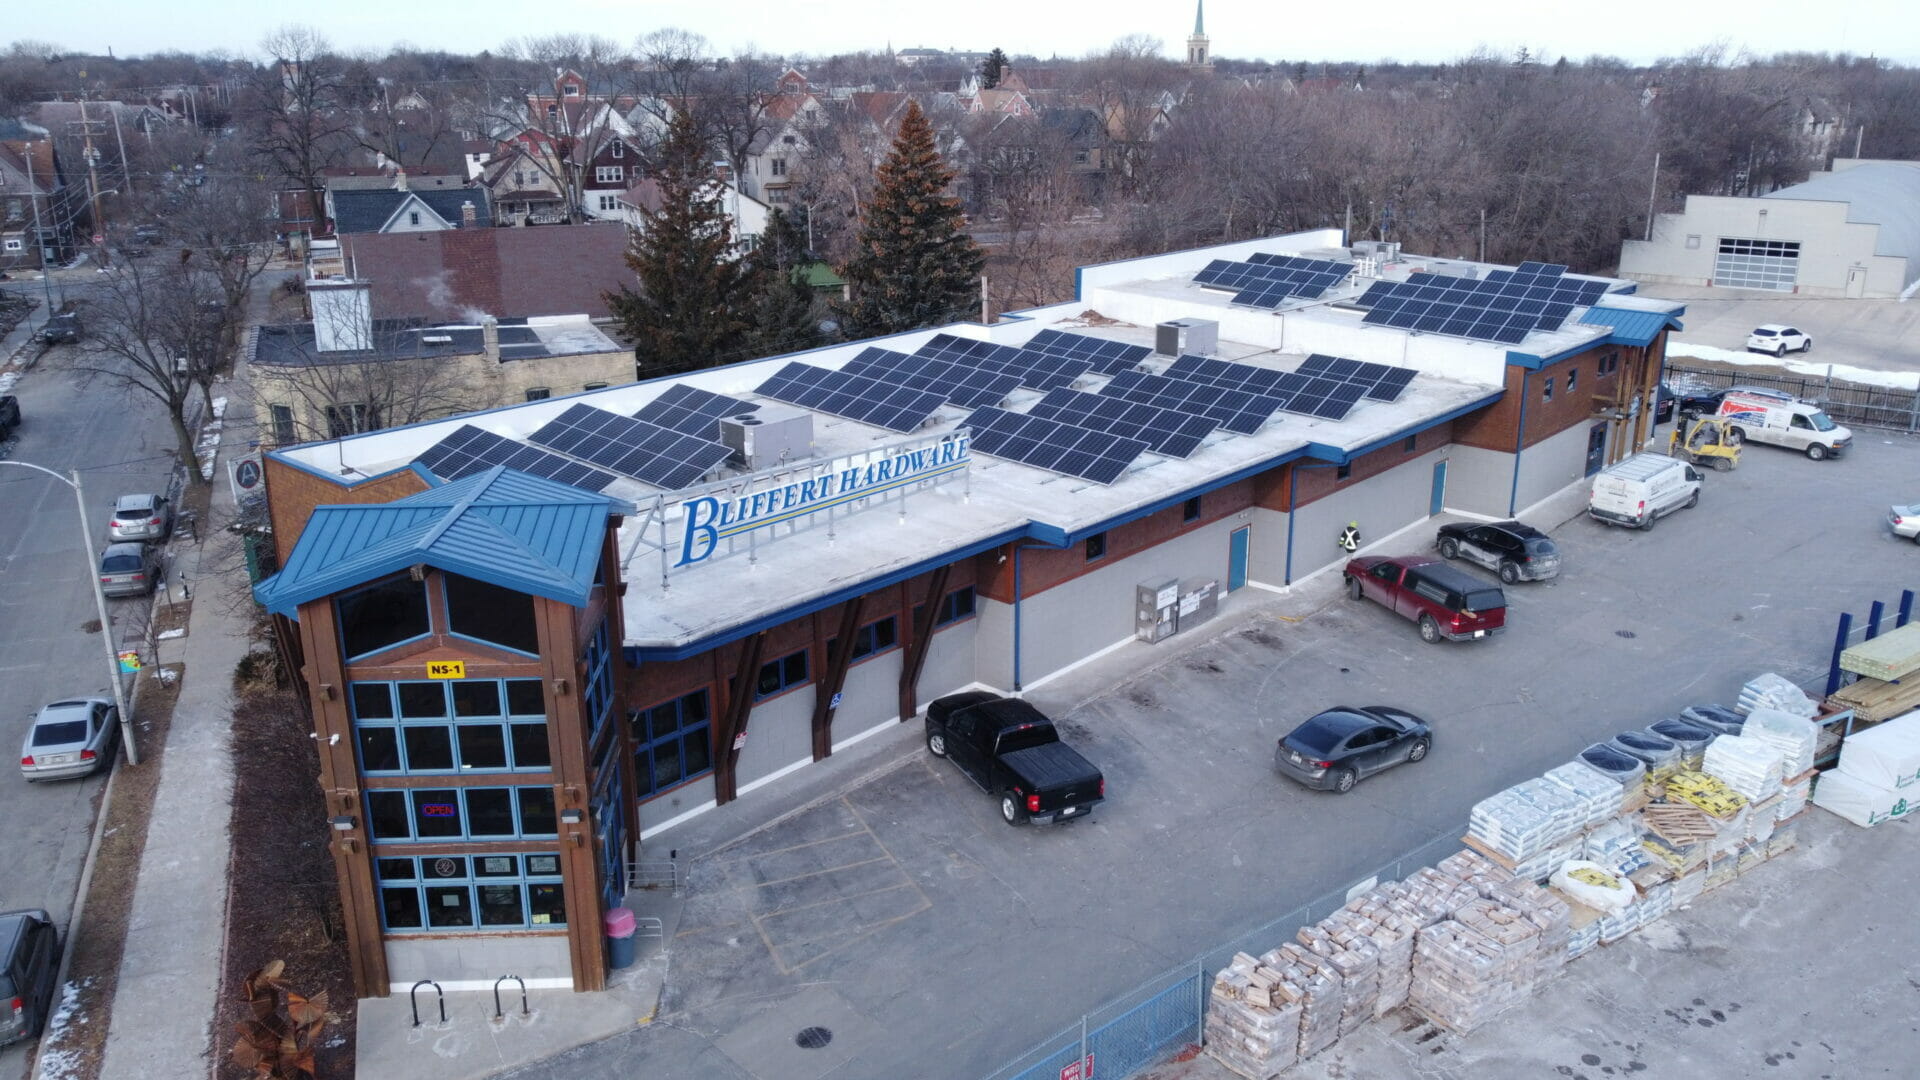
For businesses on energy-only rates, solar provides direct savings by reducing the amount of electricity purchased from the utility. Every kilowatt-hour generated by the solar array offsets a kilowatt-hour that would otherwise be bought from the grid. Retail stores, offices, churches, schools, and smaller manufacturing facilities often fall into this category.
Since savings are directly tied to energy production, matching monthly solar generation to energy consumption is typically the primary design goal. Arch analyzes a site’s energy bills and works within the space provided to create a system that produces enough energy to offset monthly utility bills for decades.
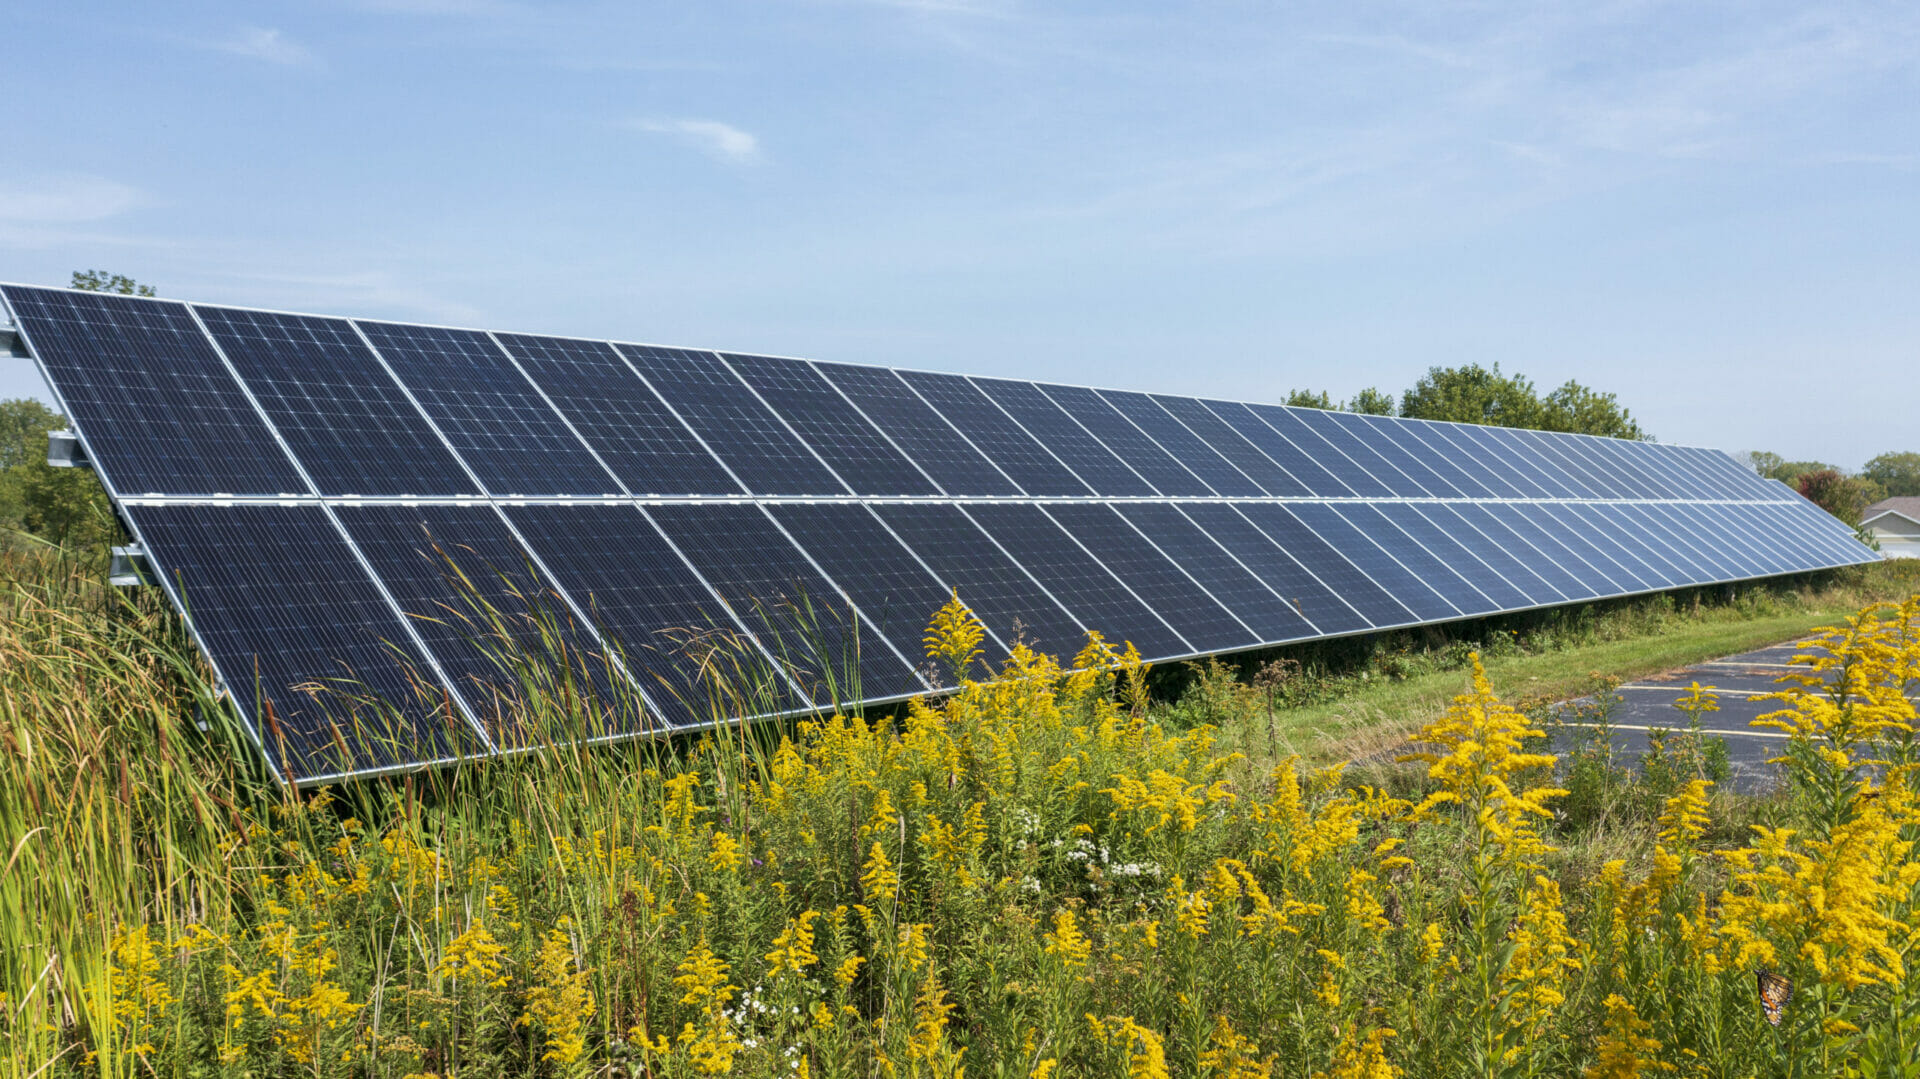
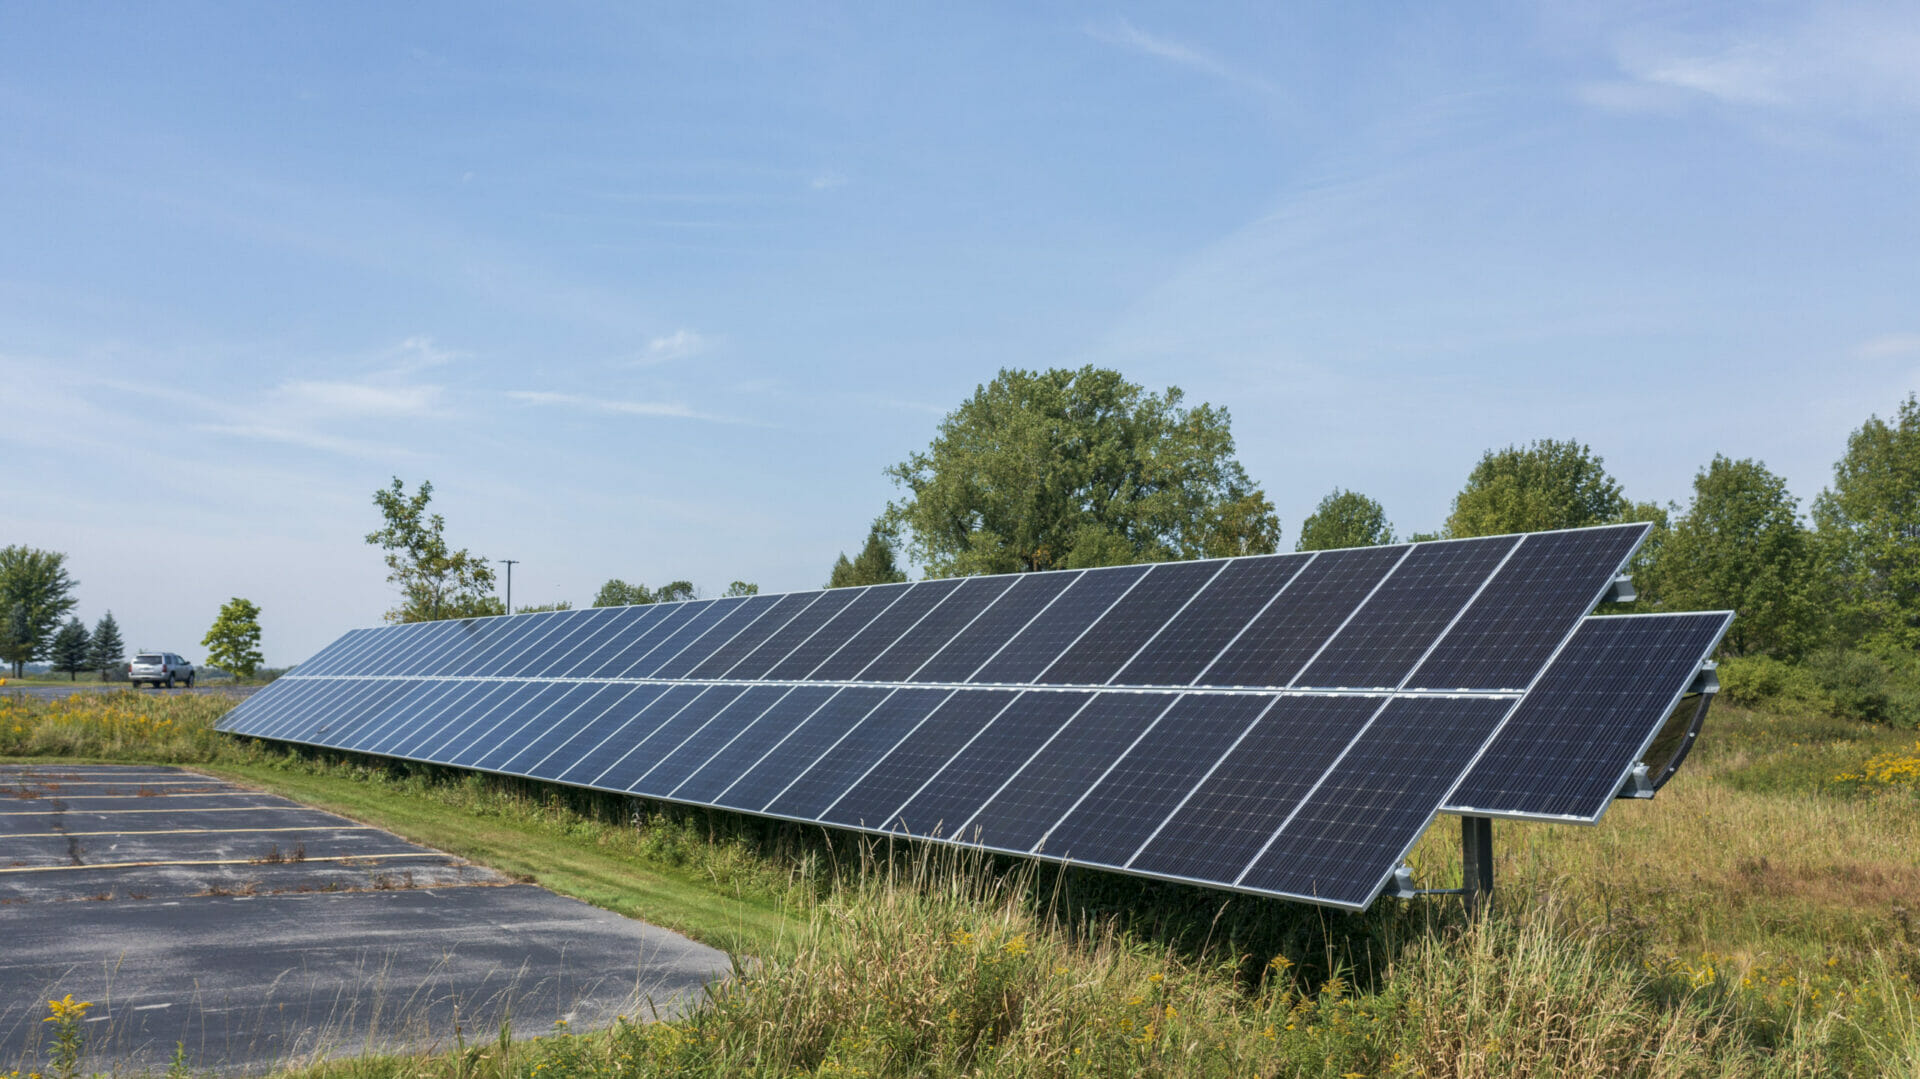
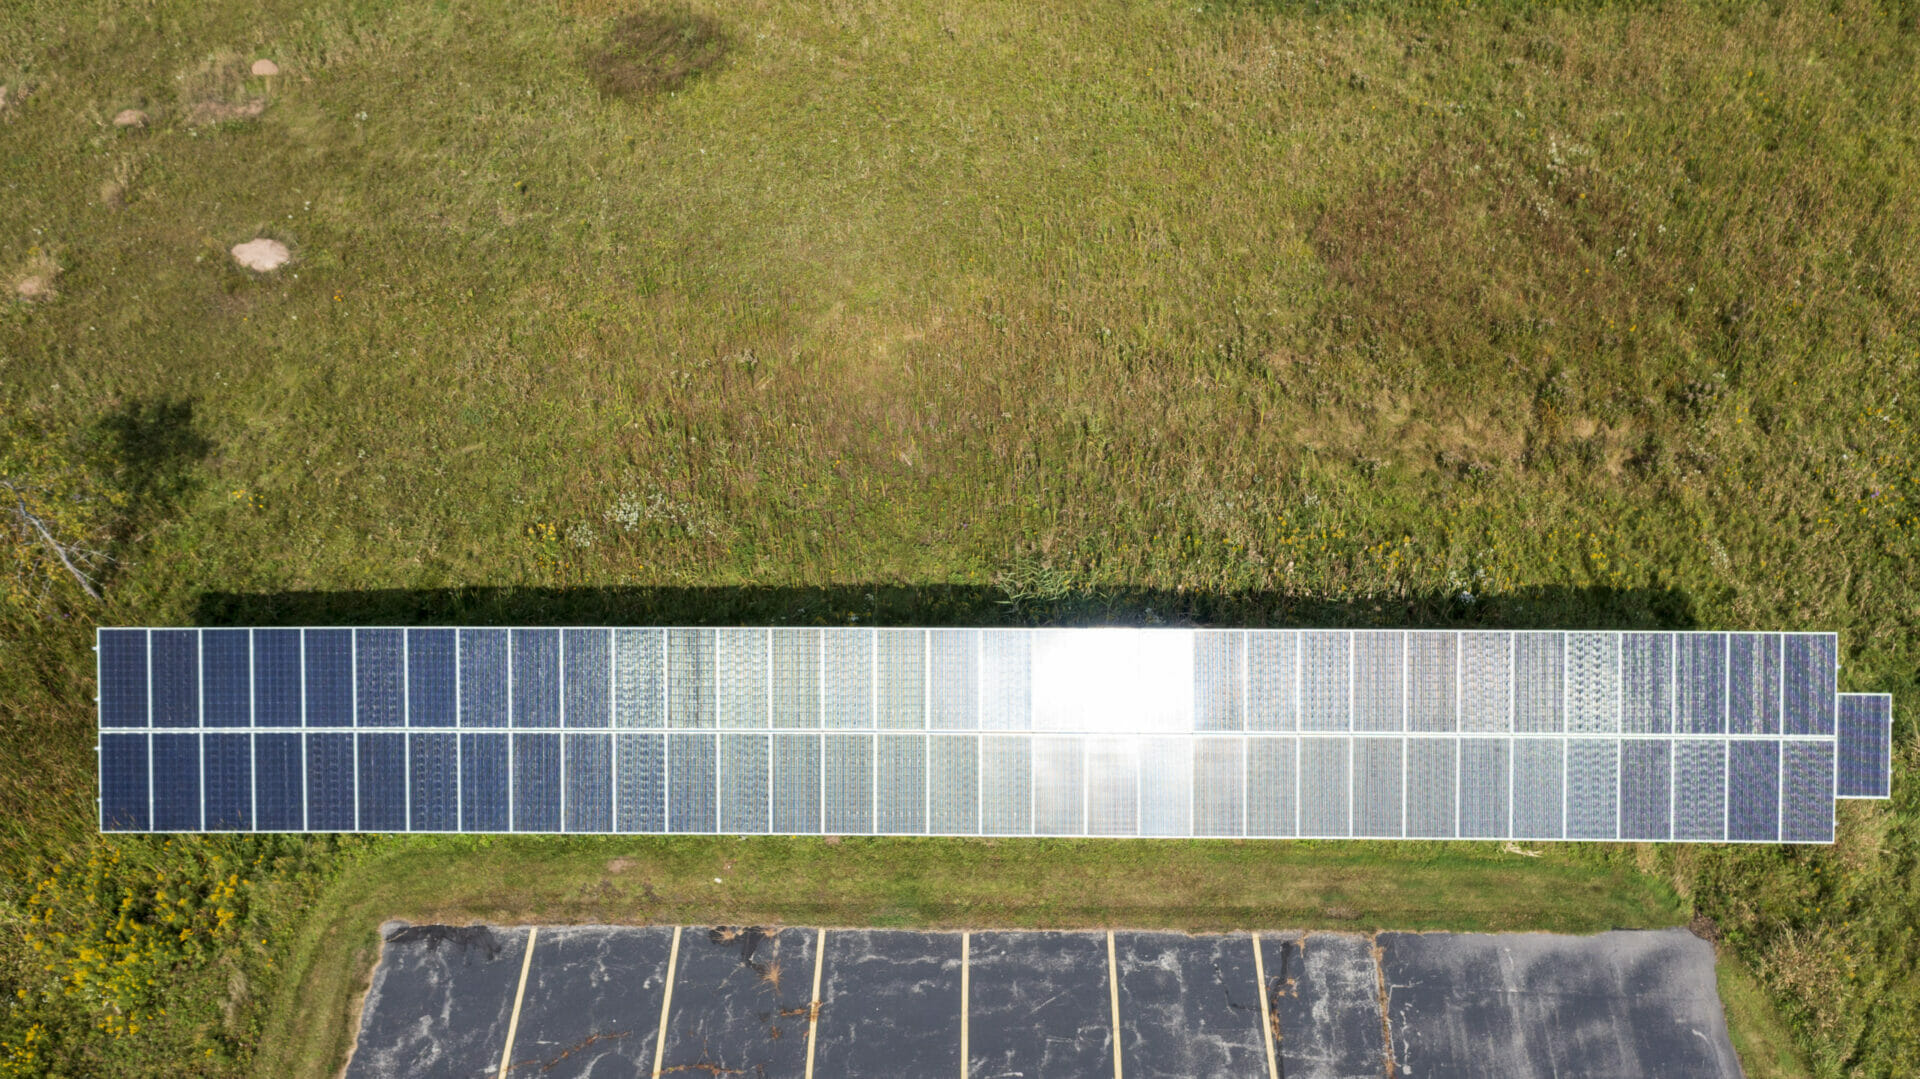
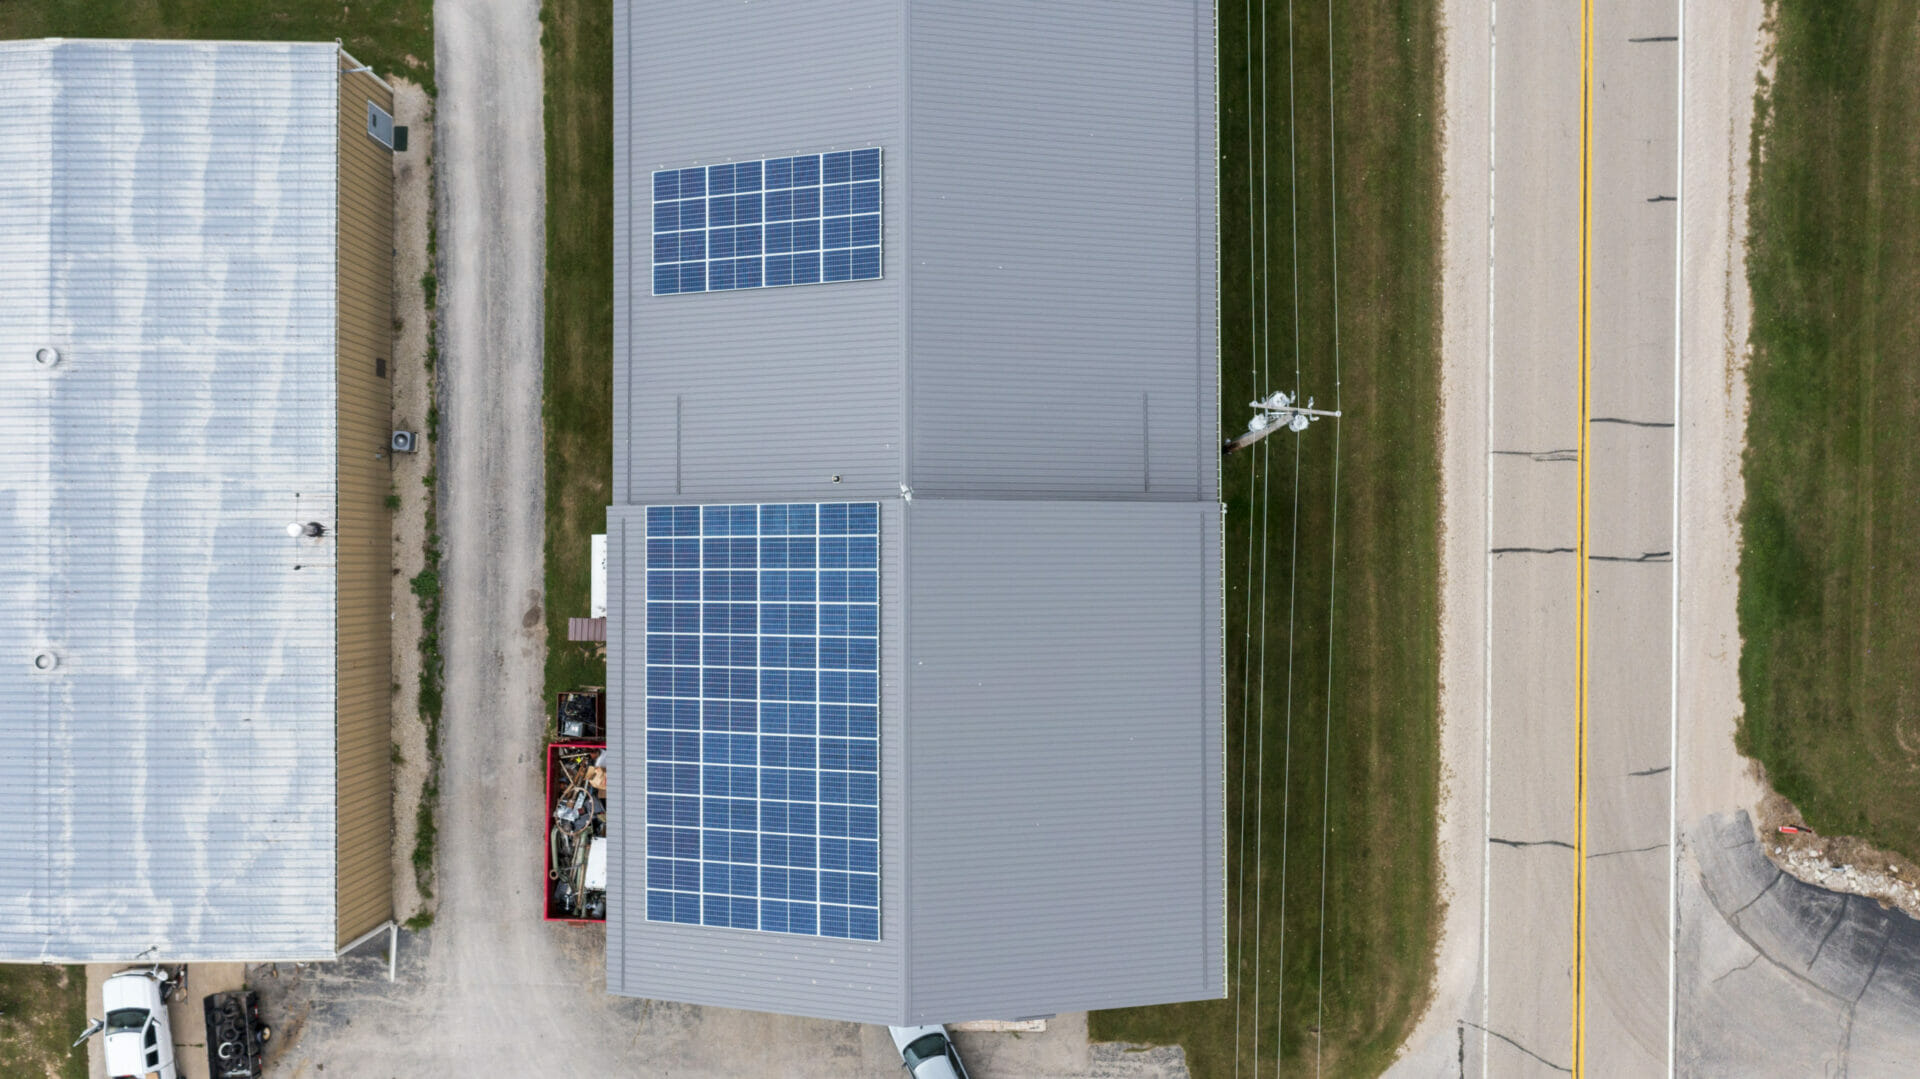
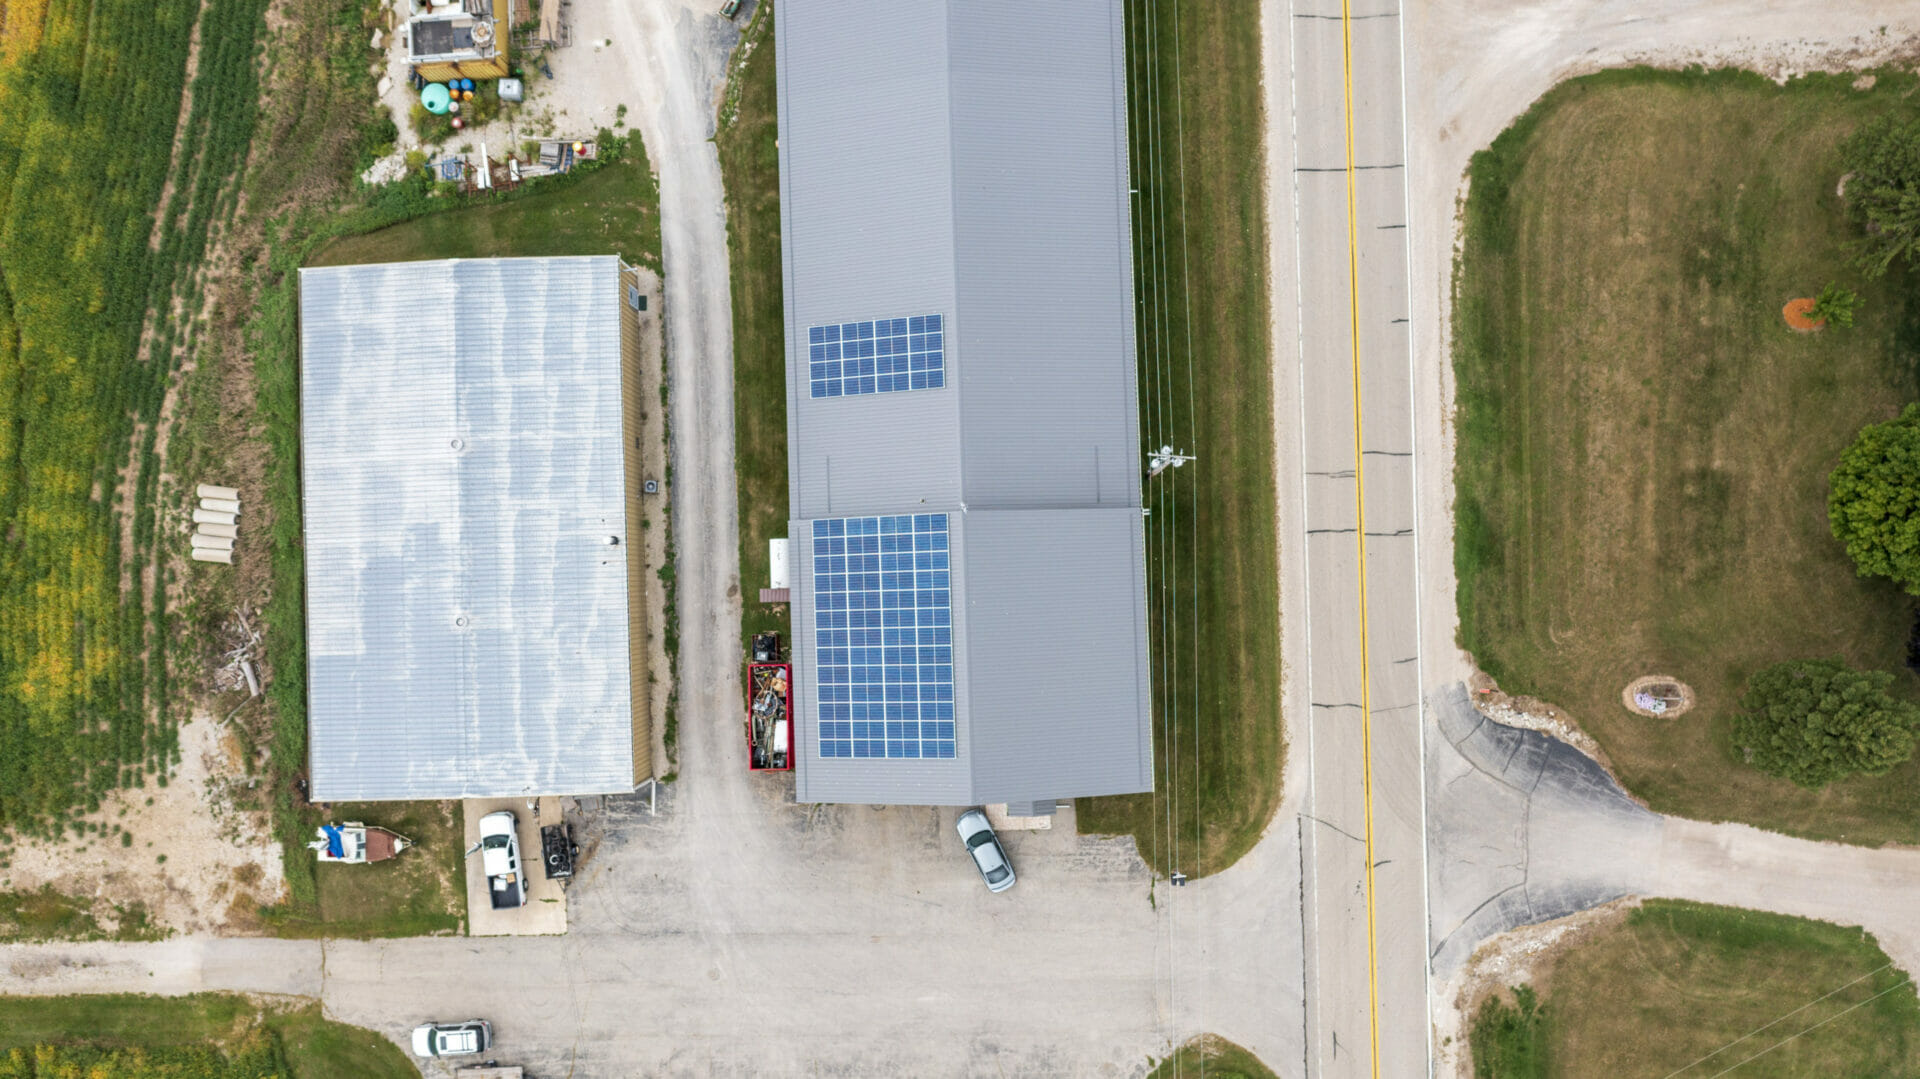
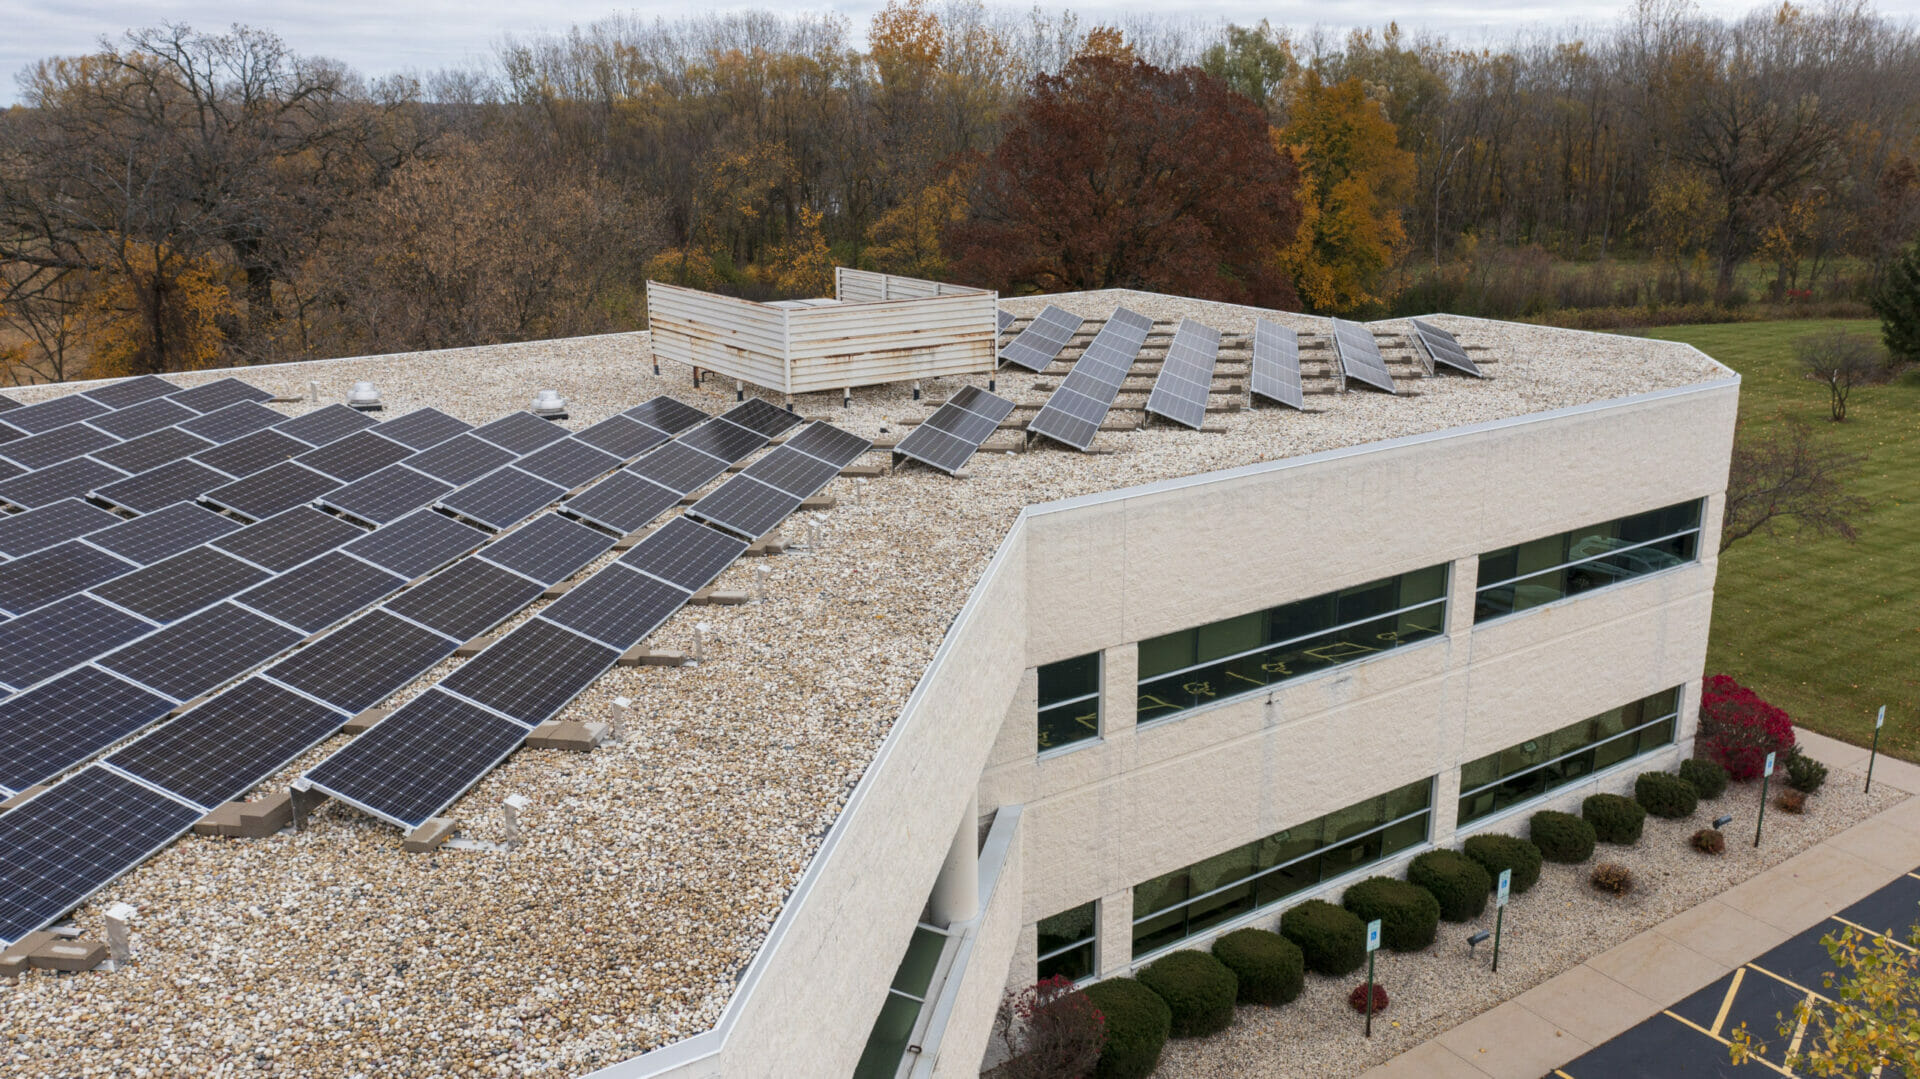
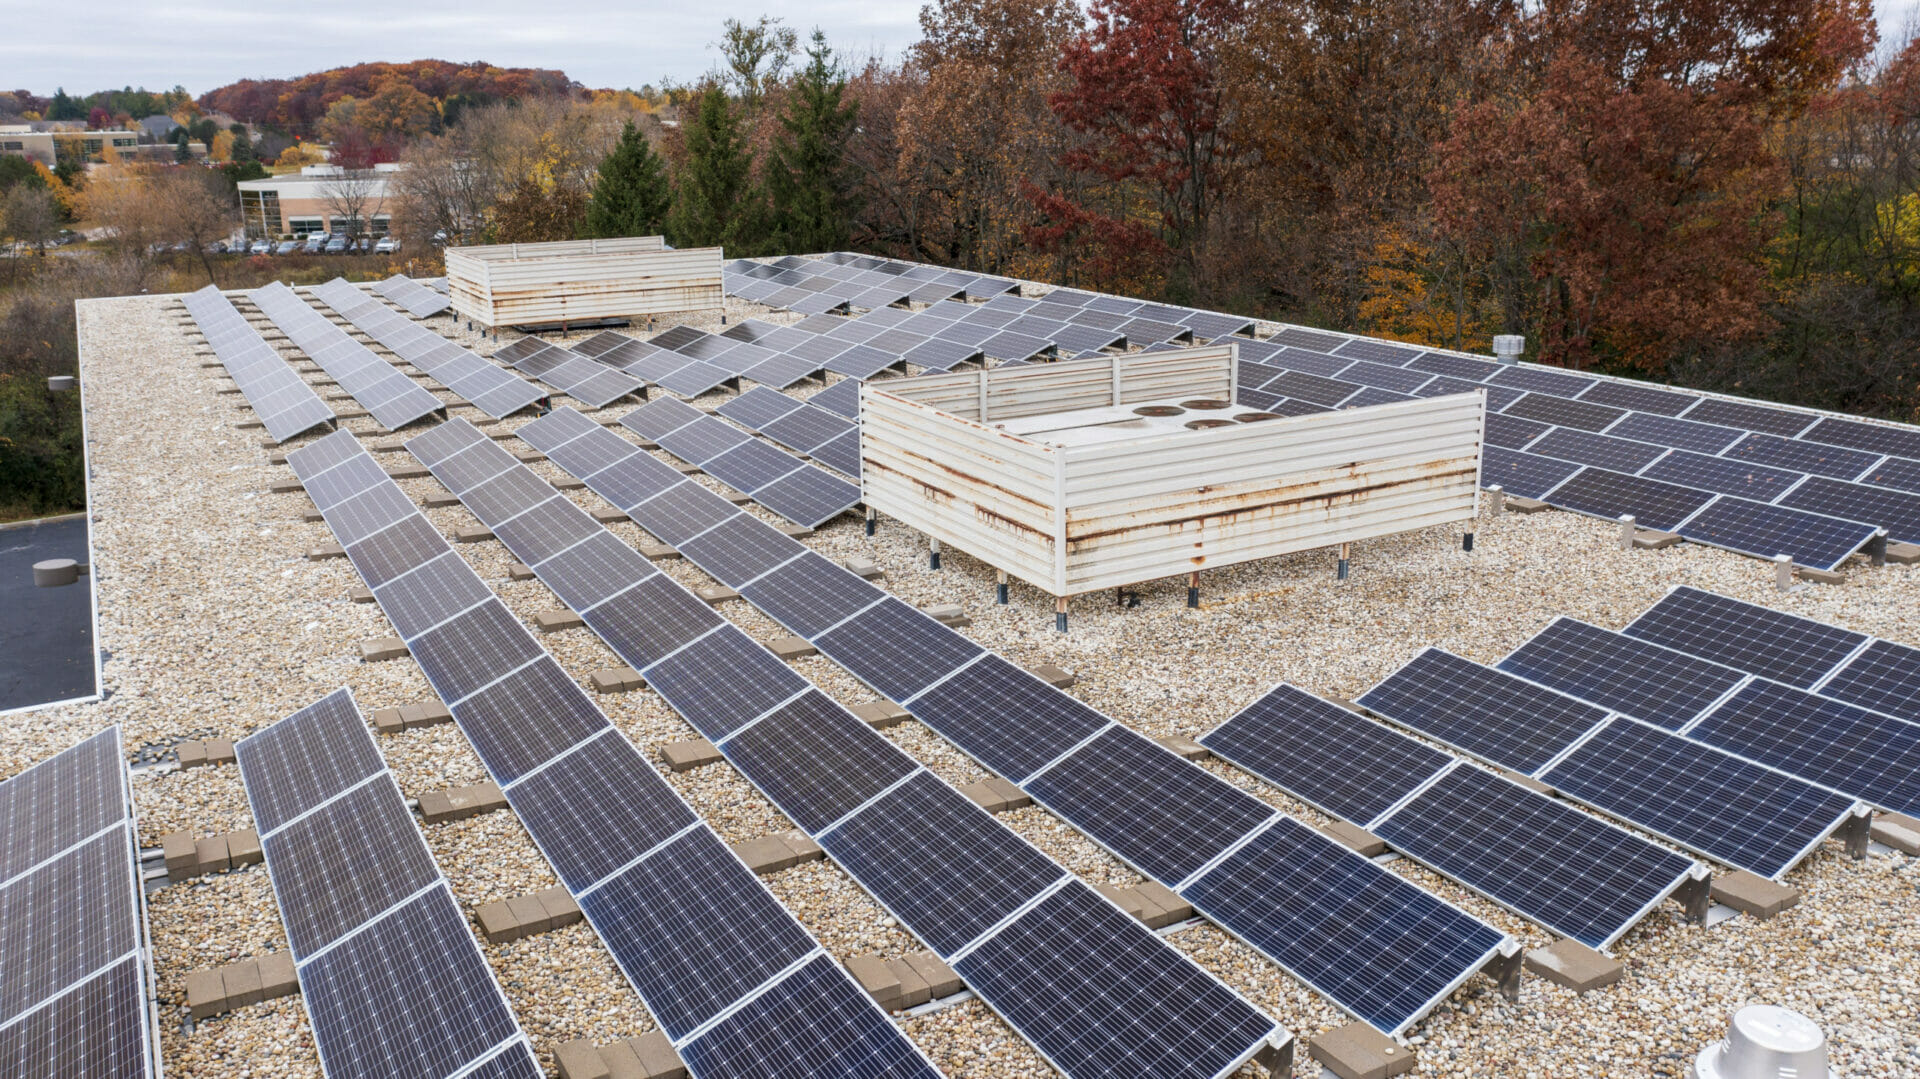
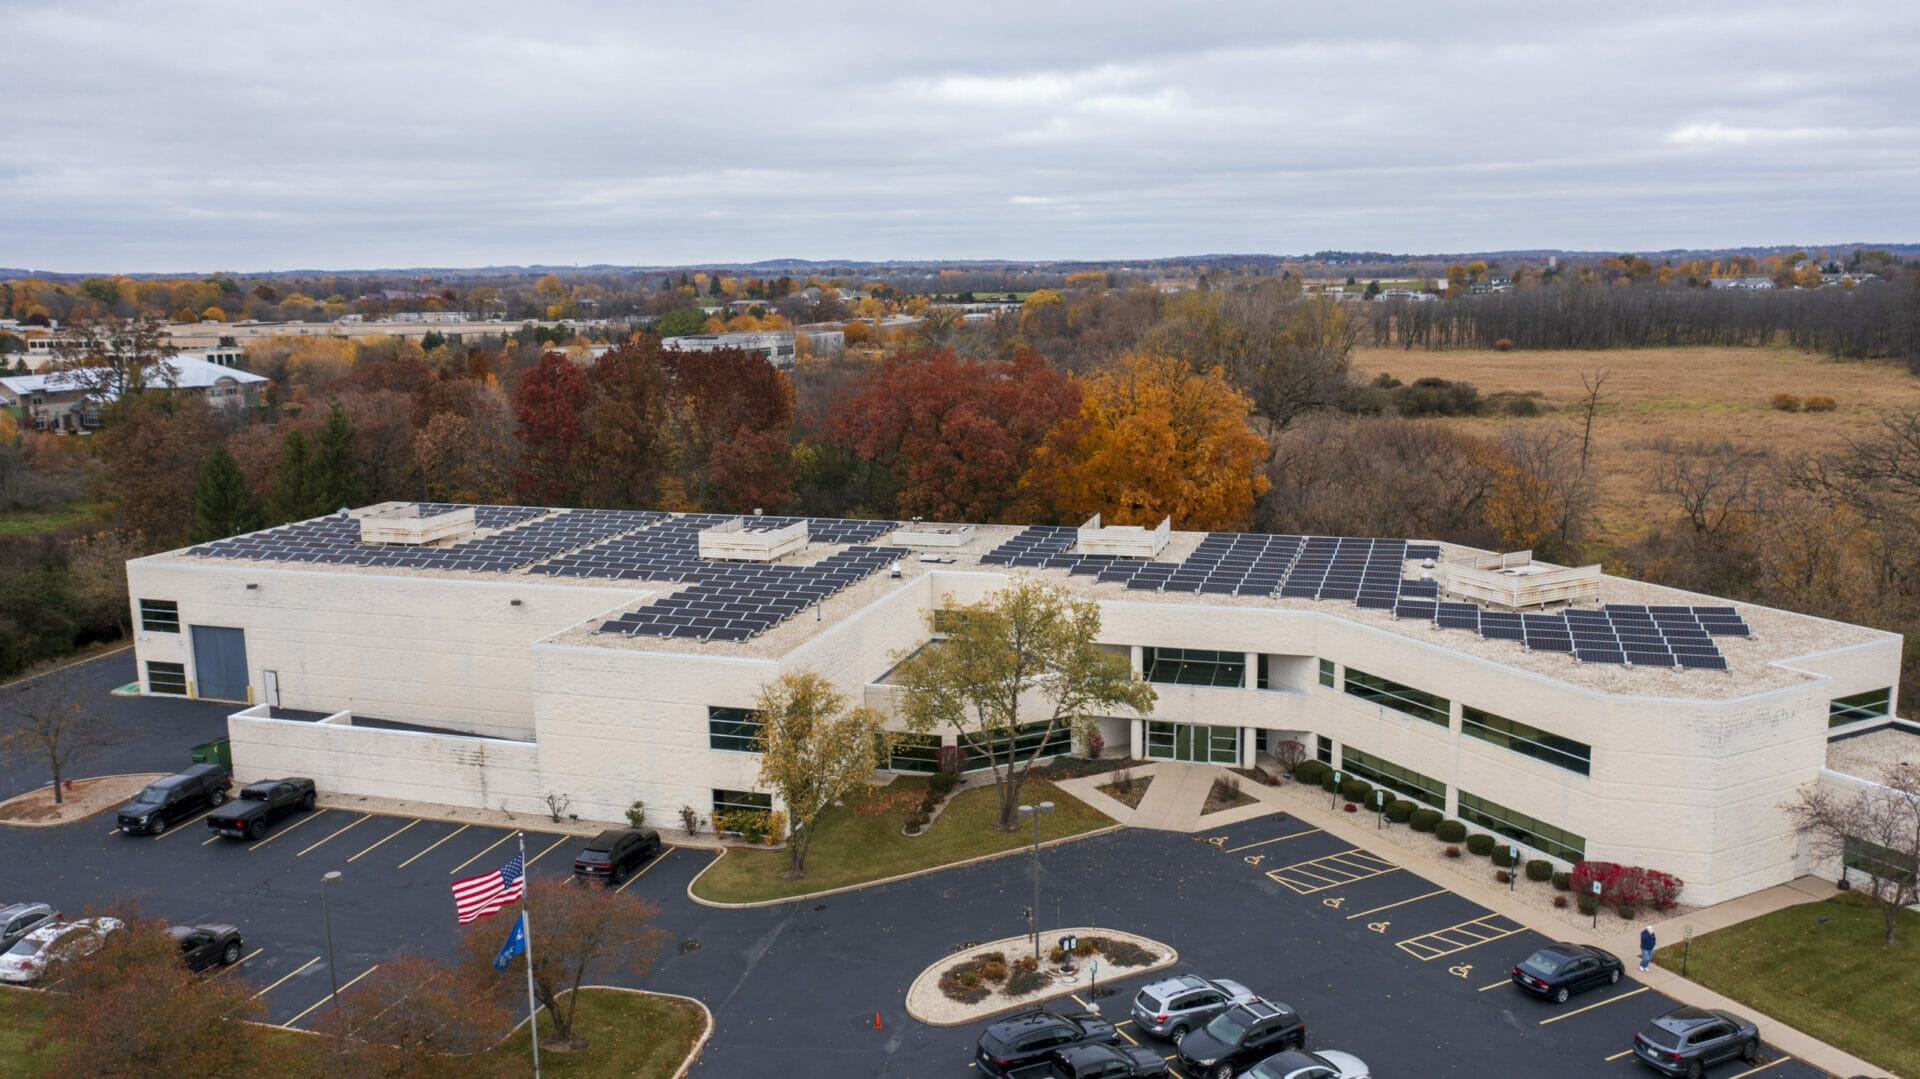
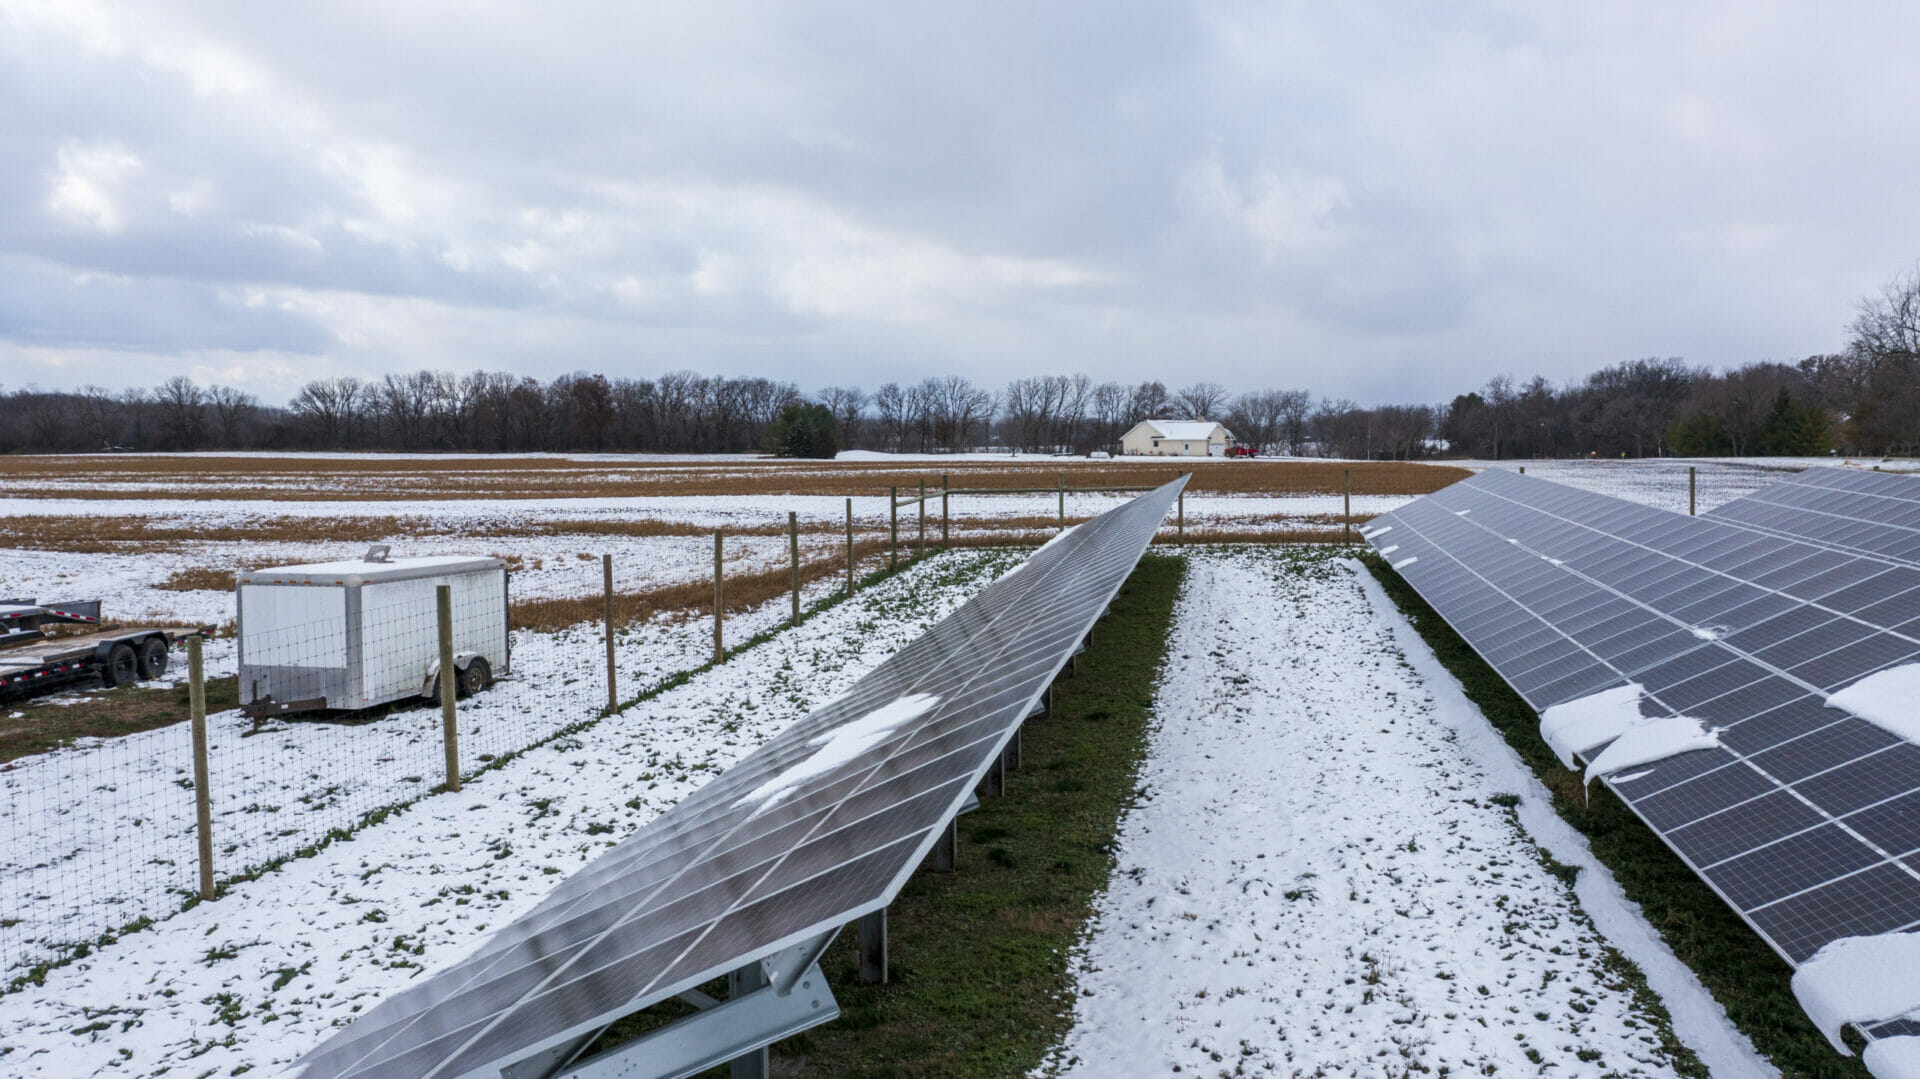
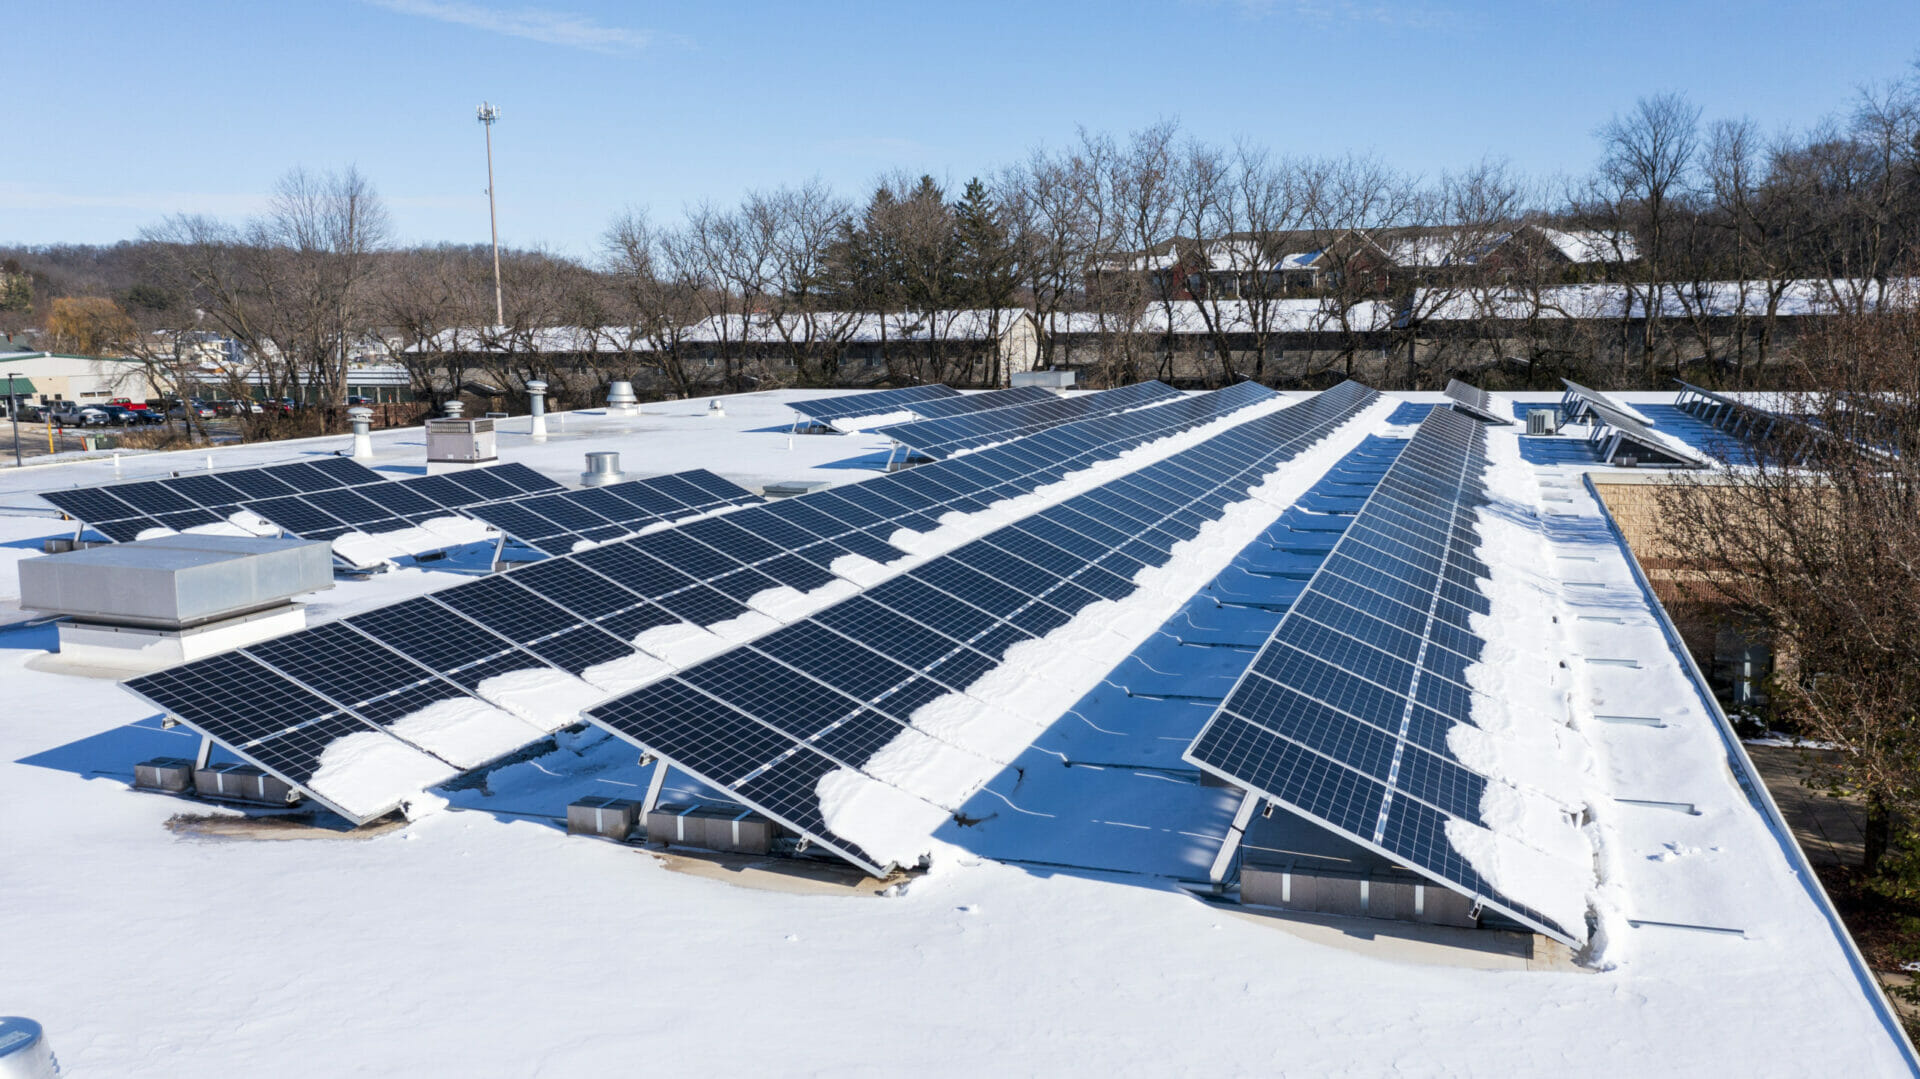
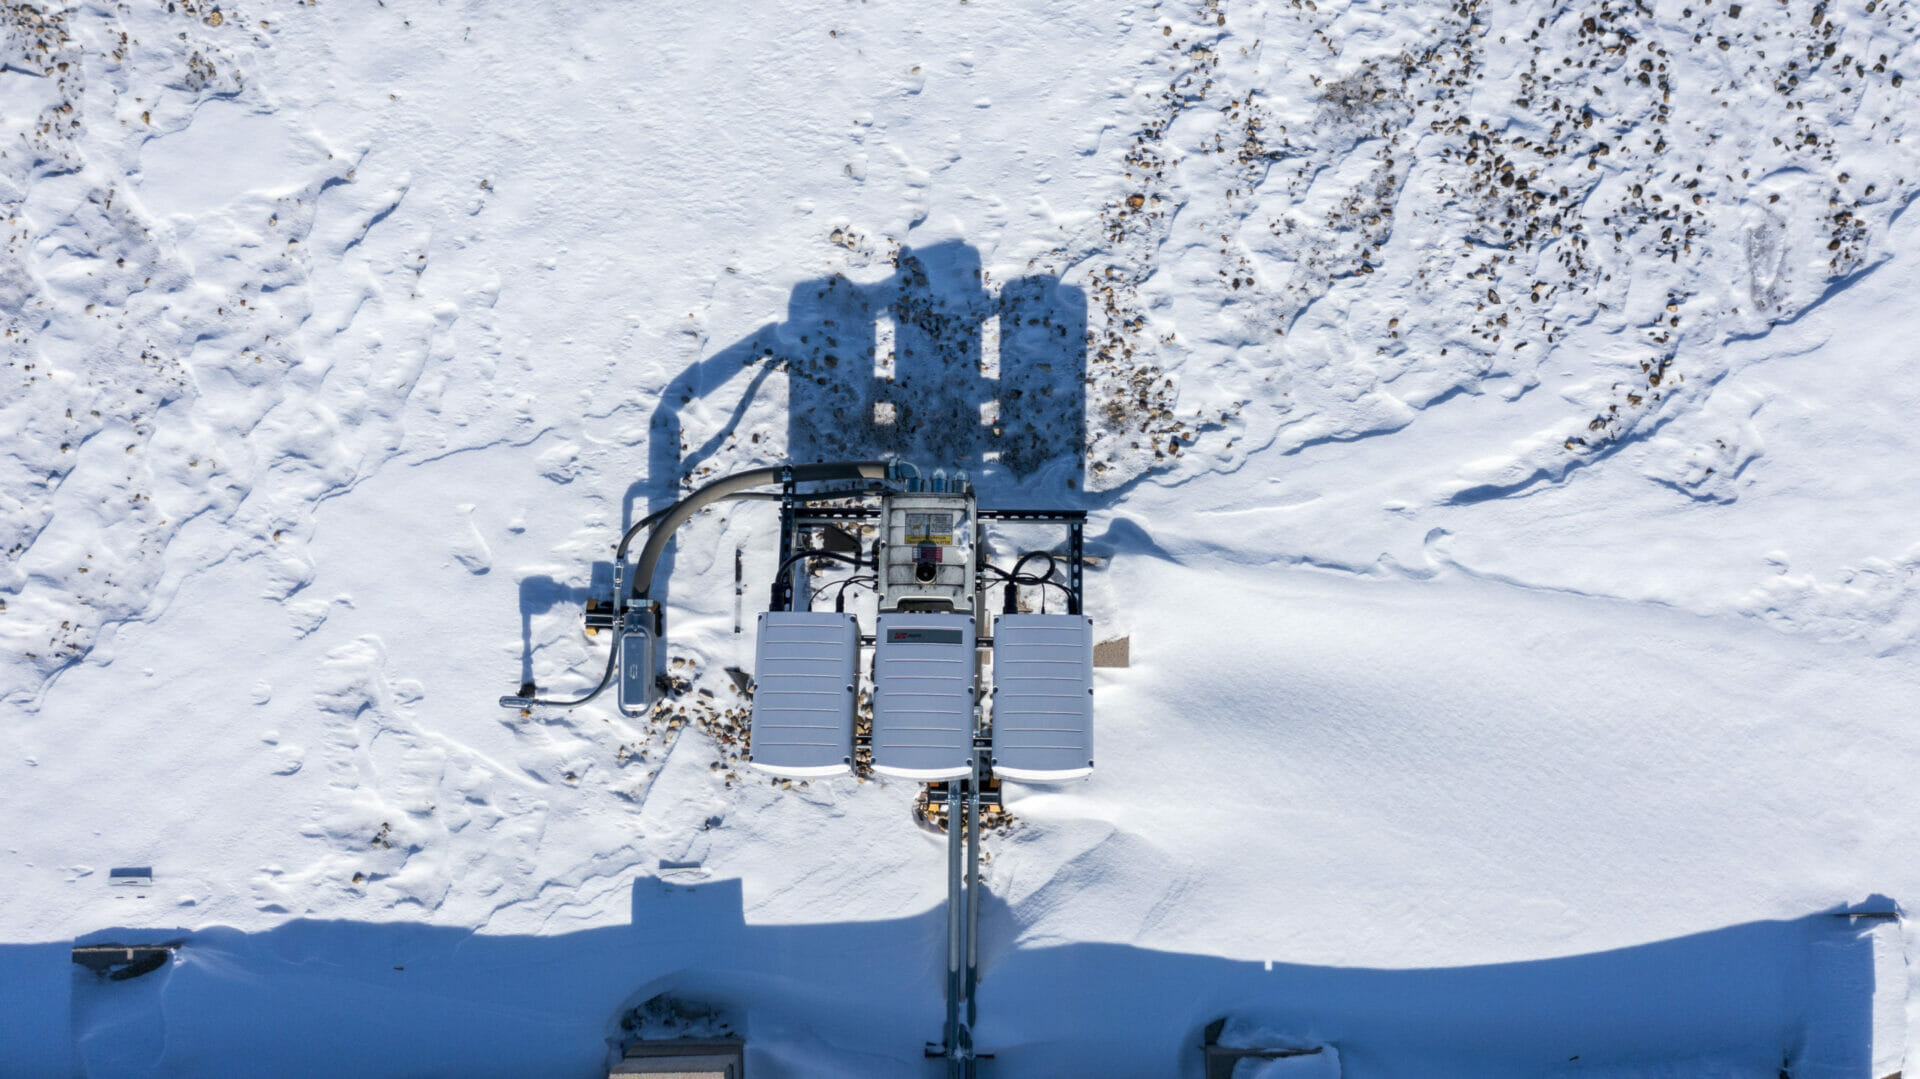
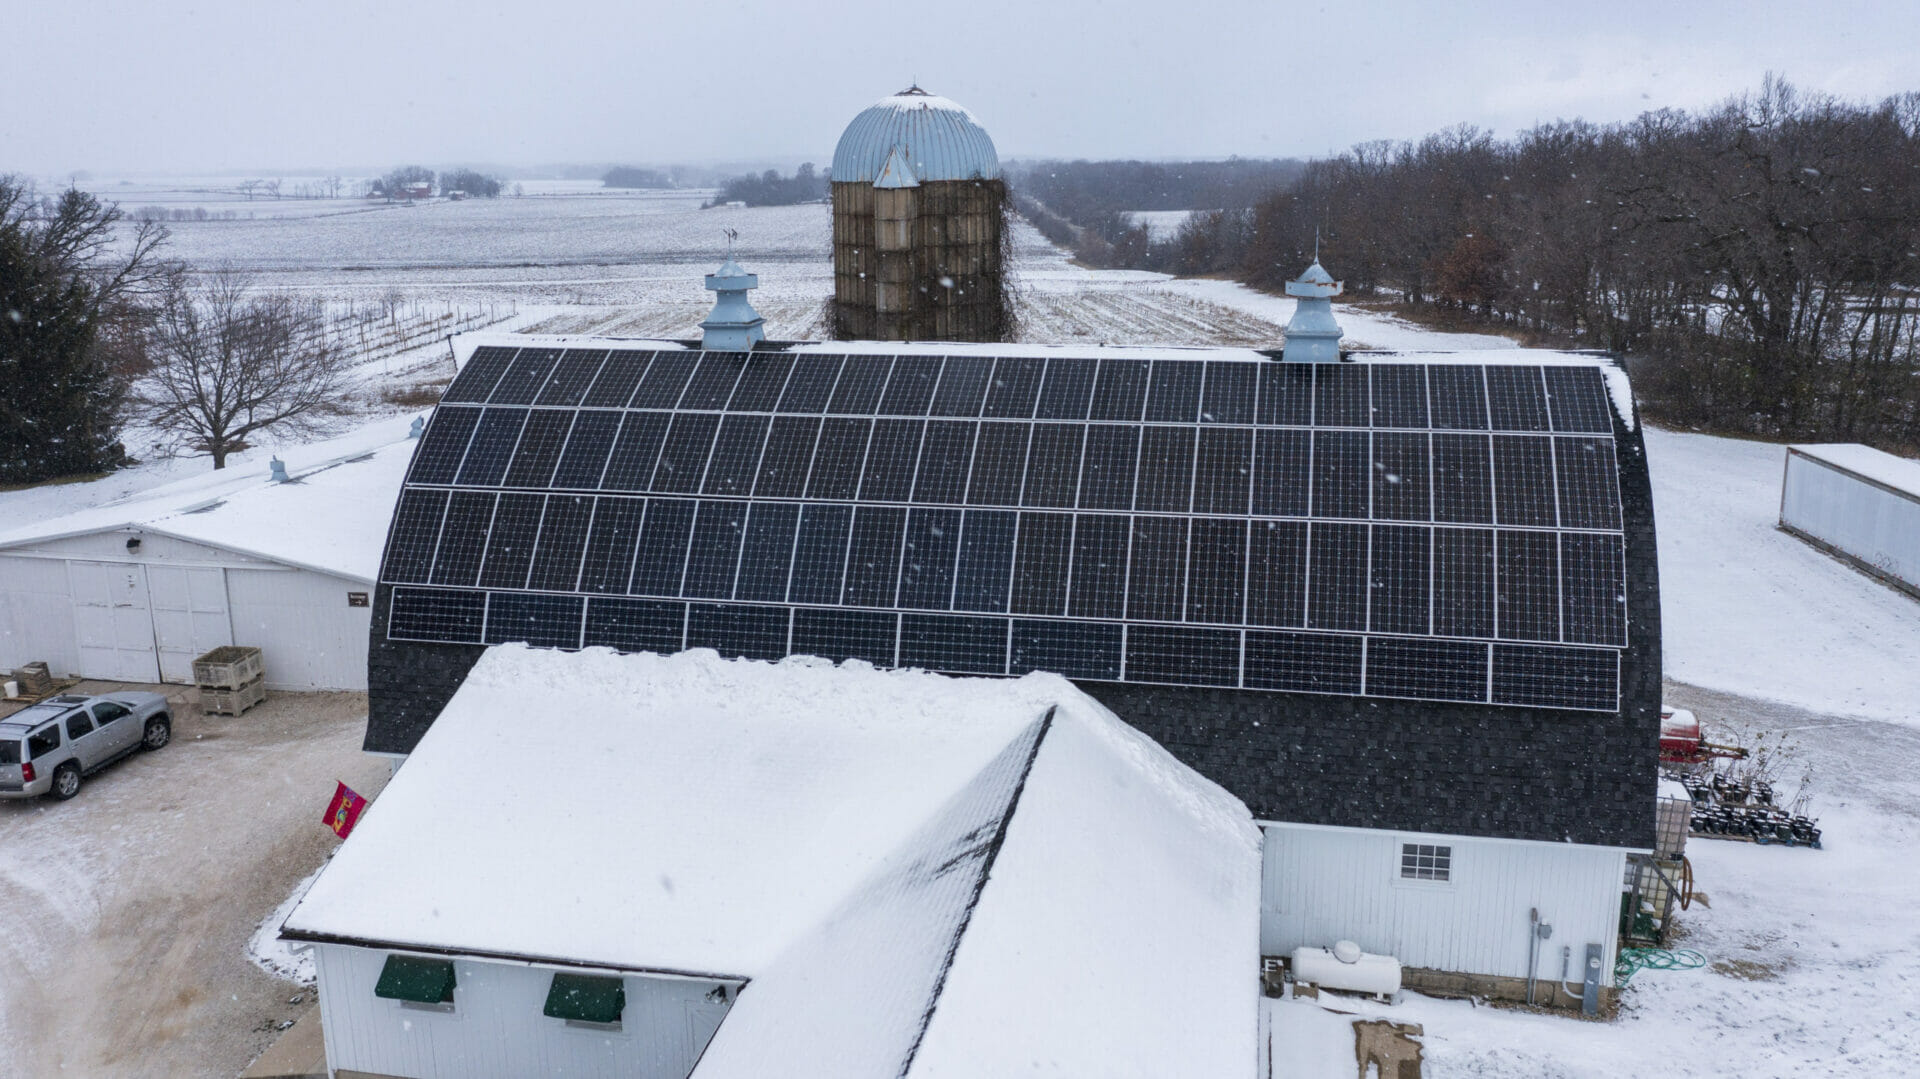
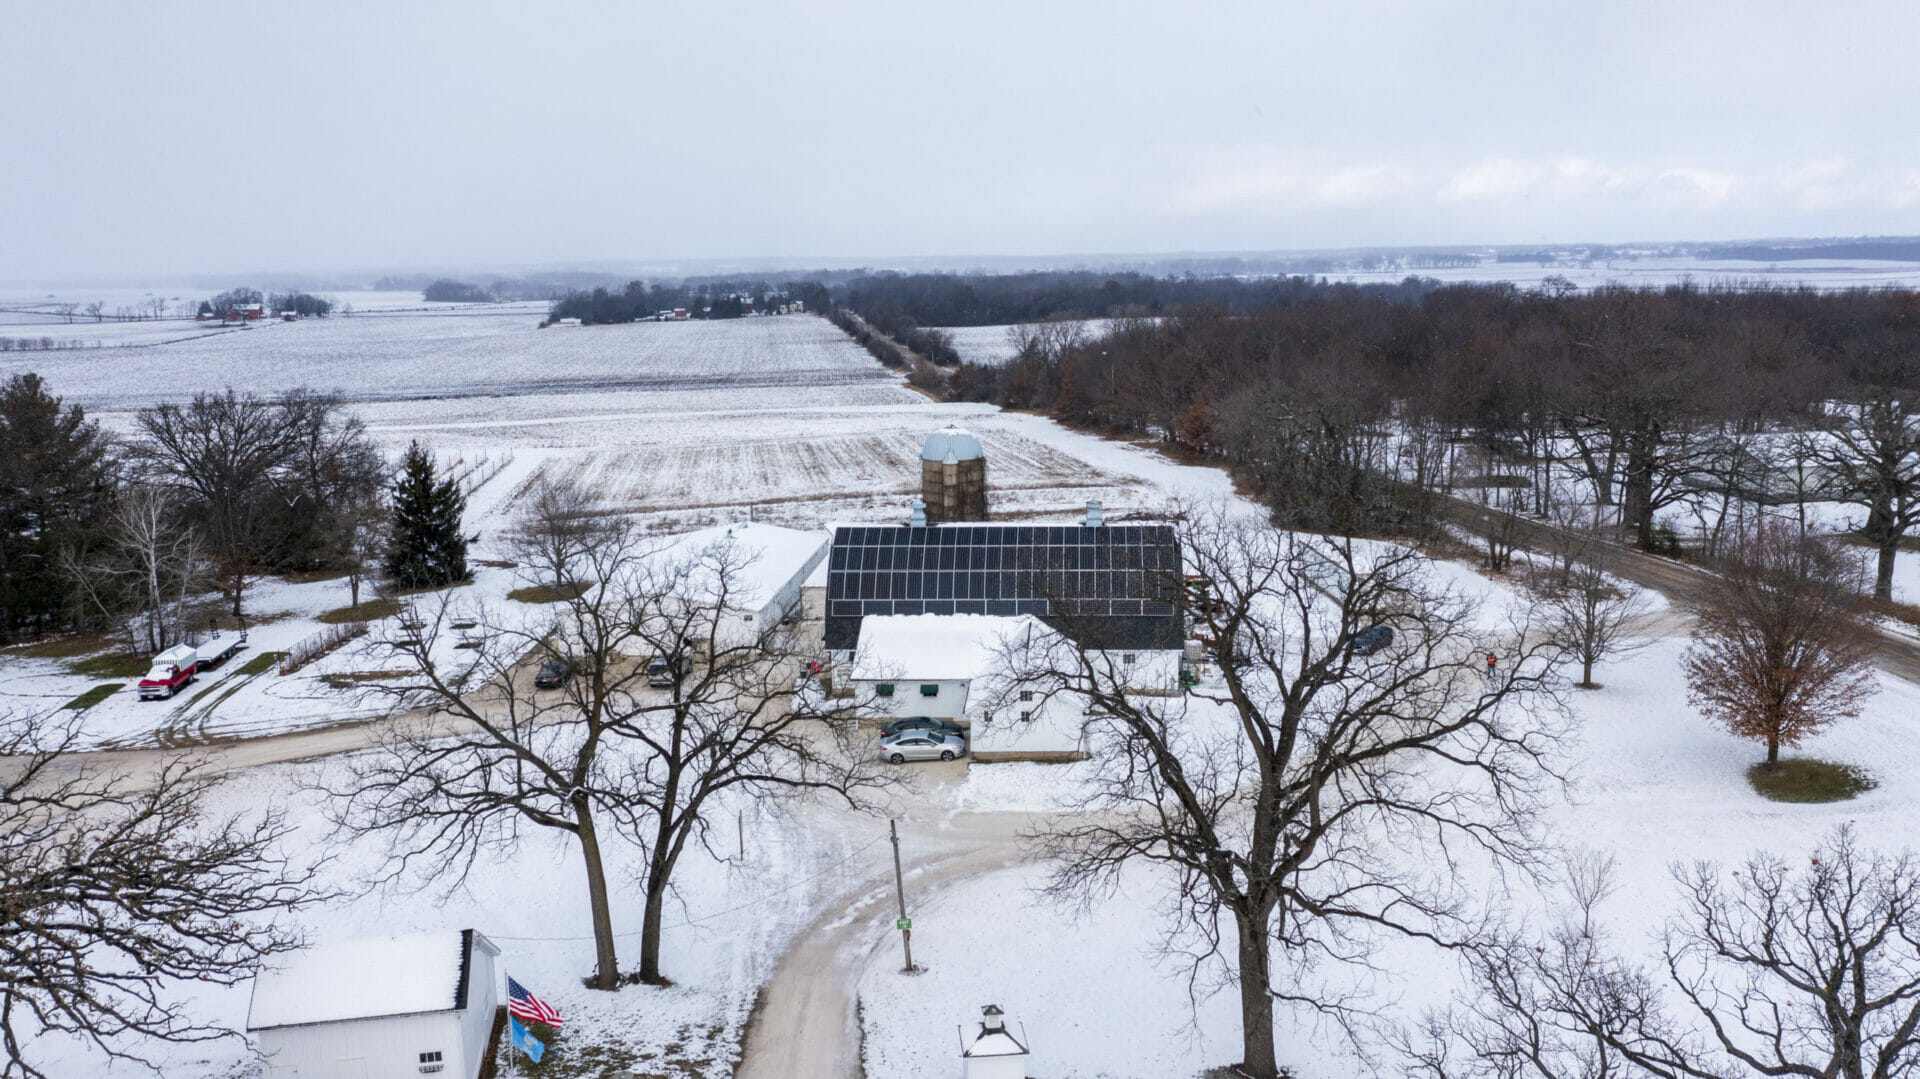
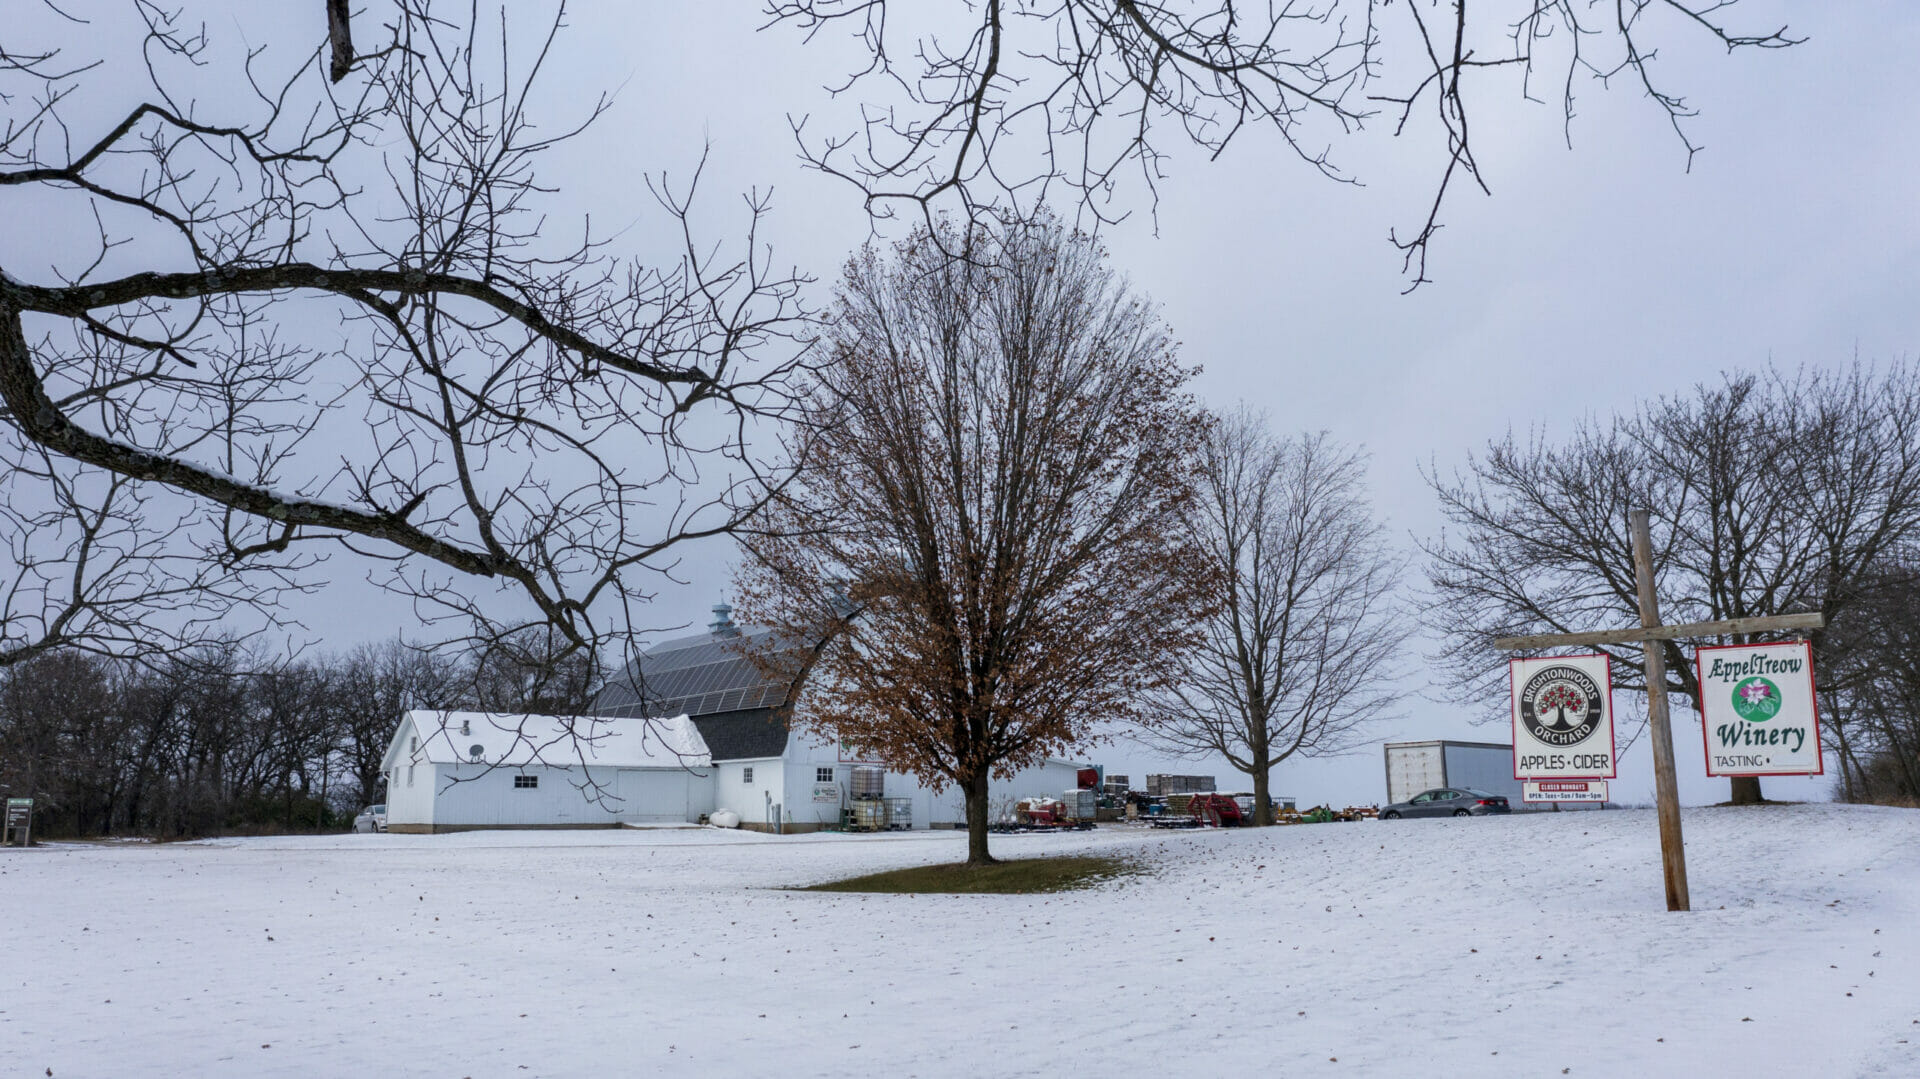
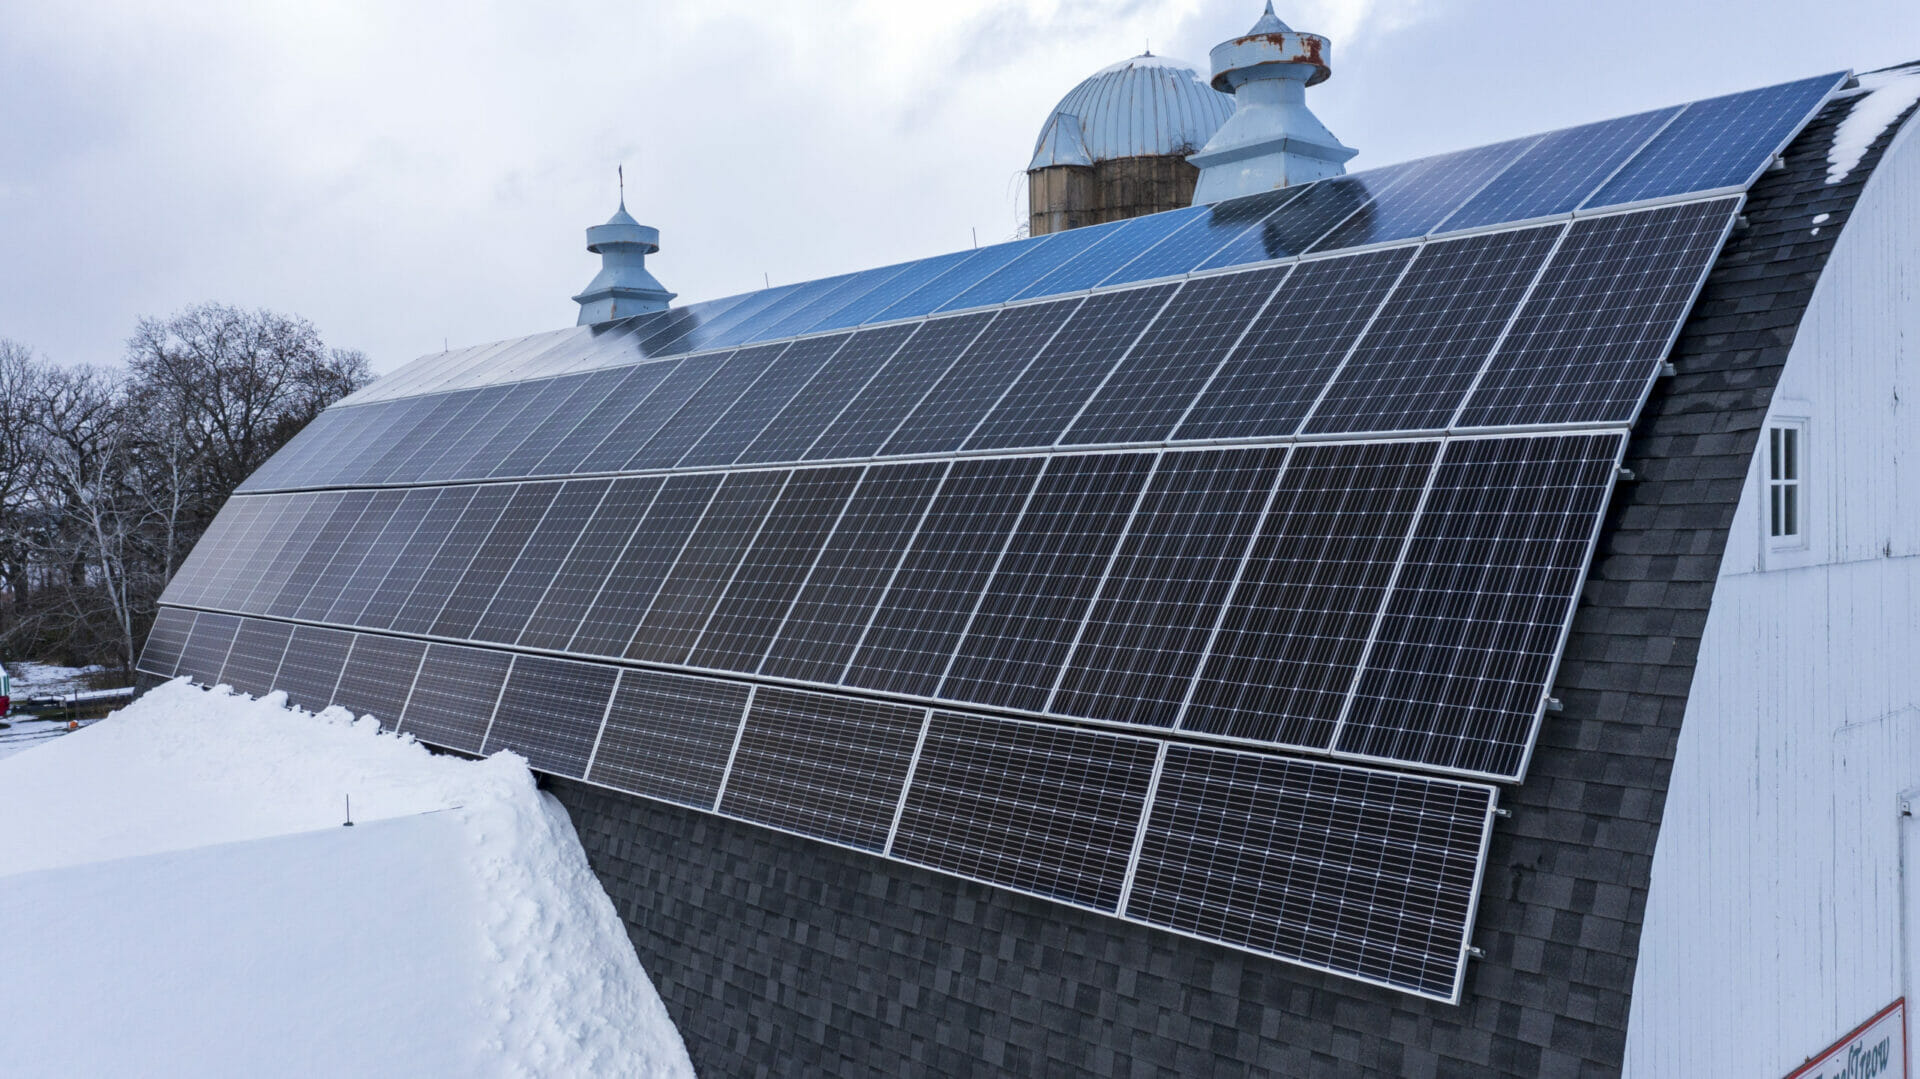
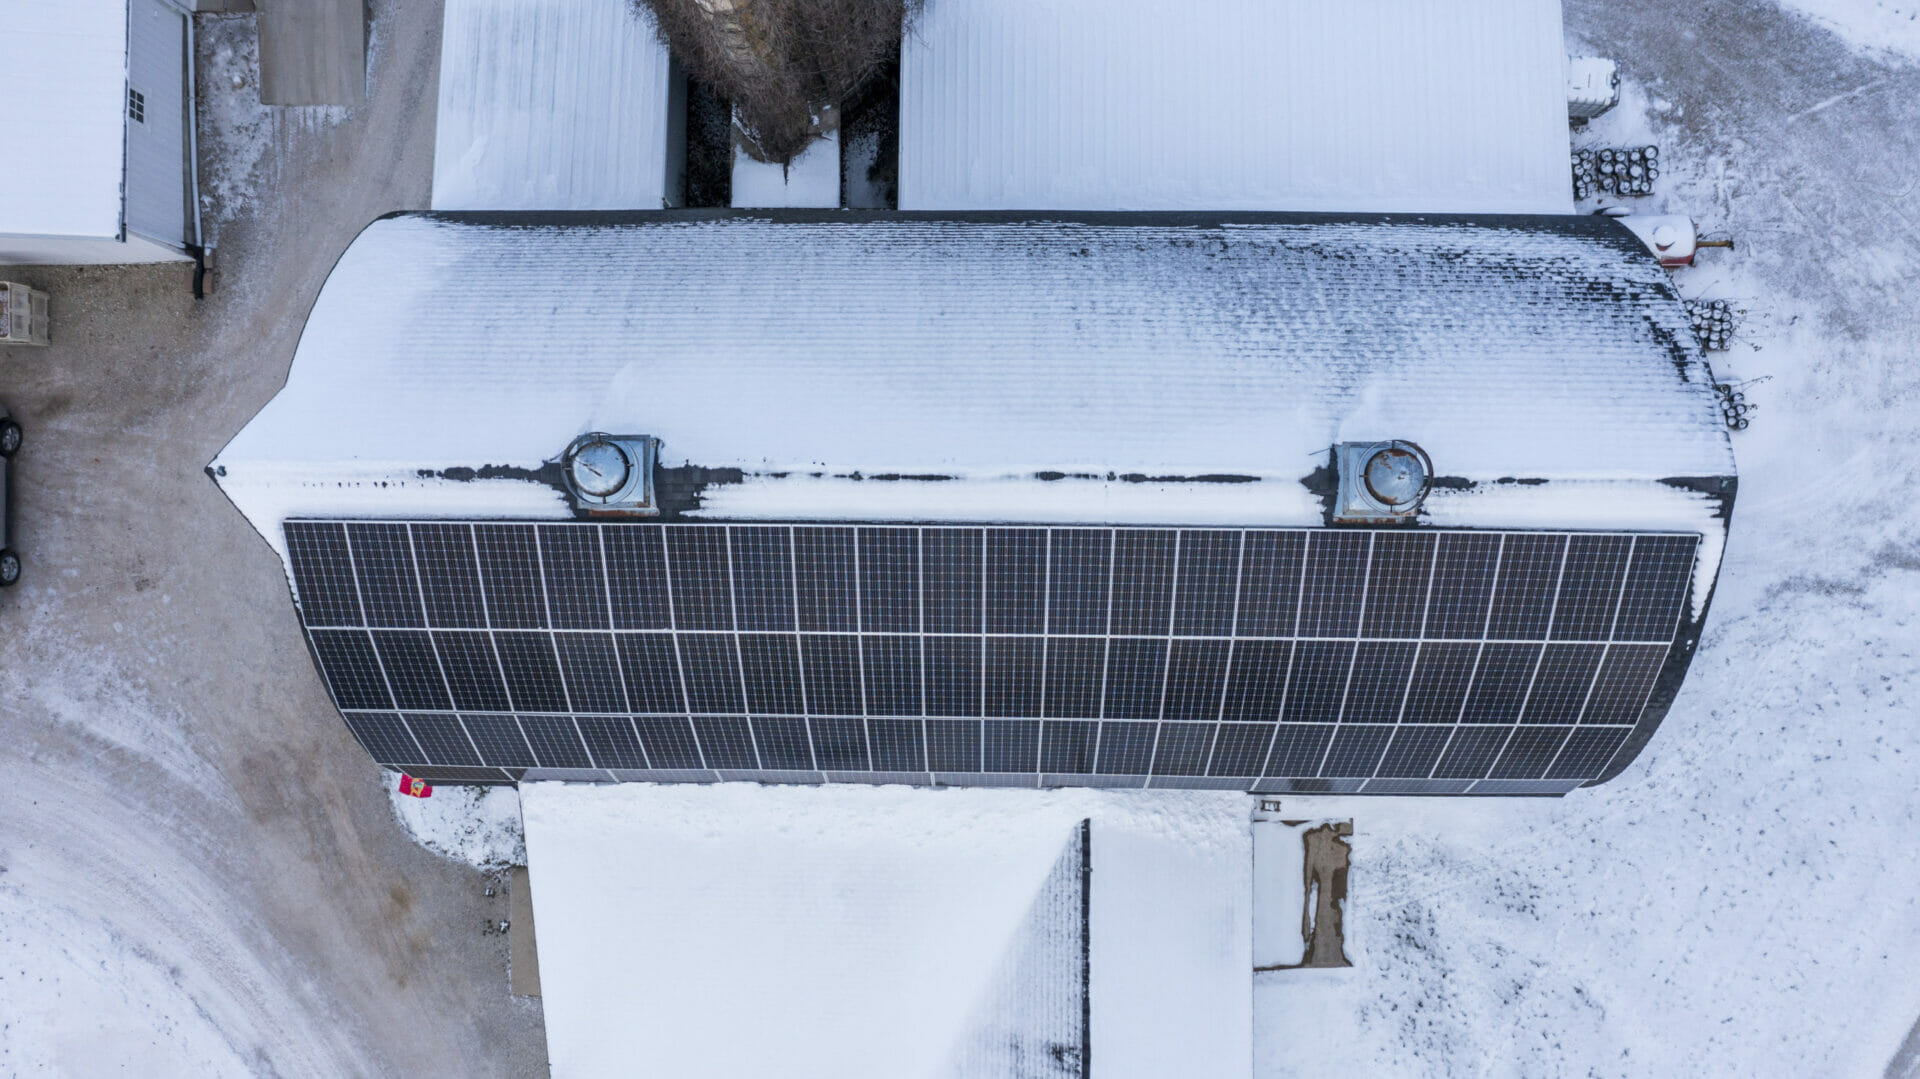
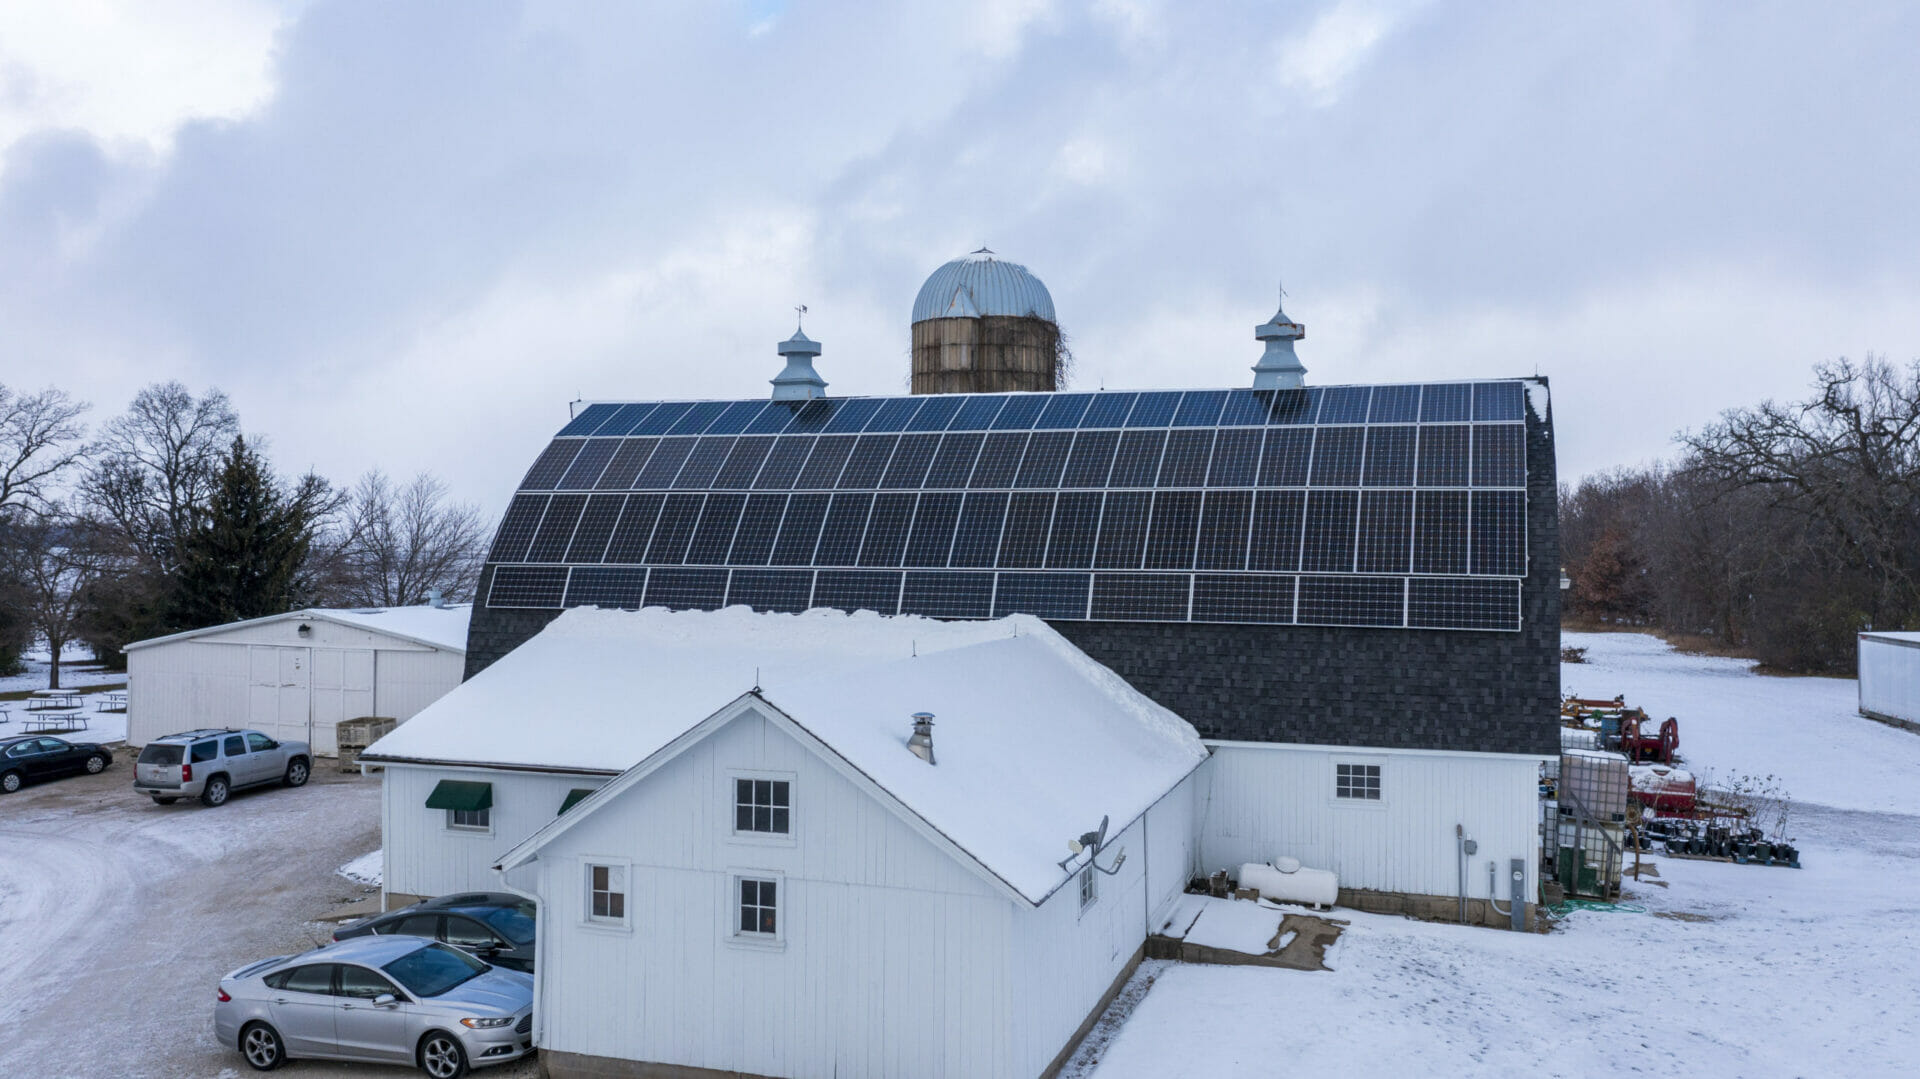
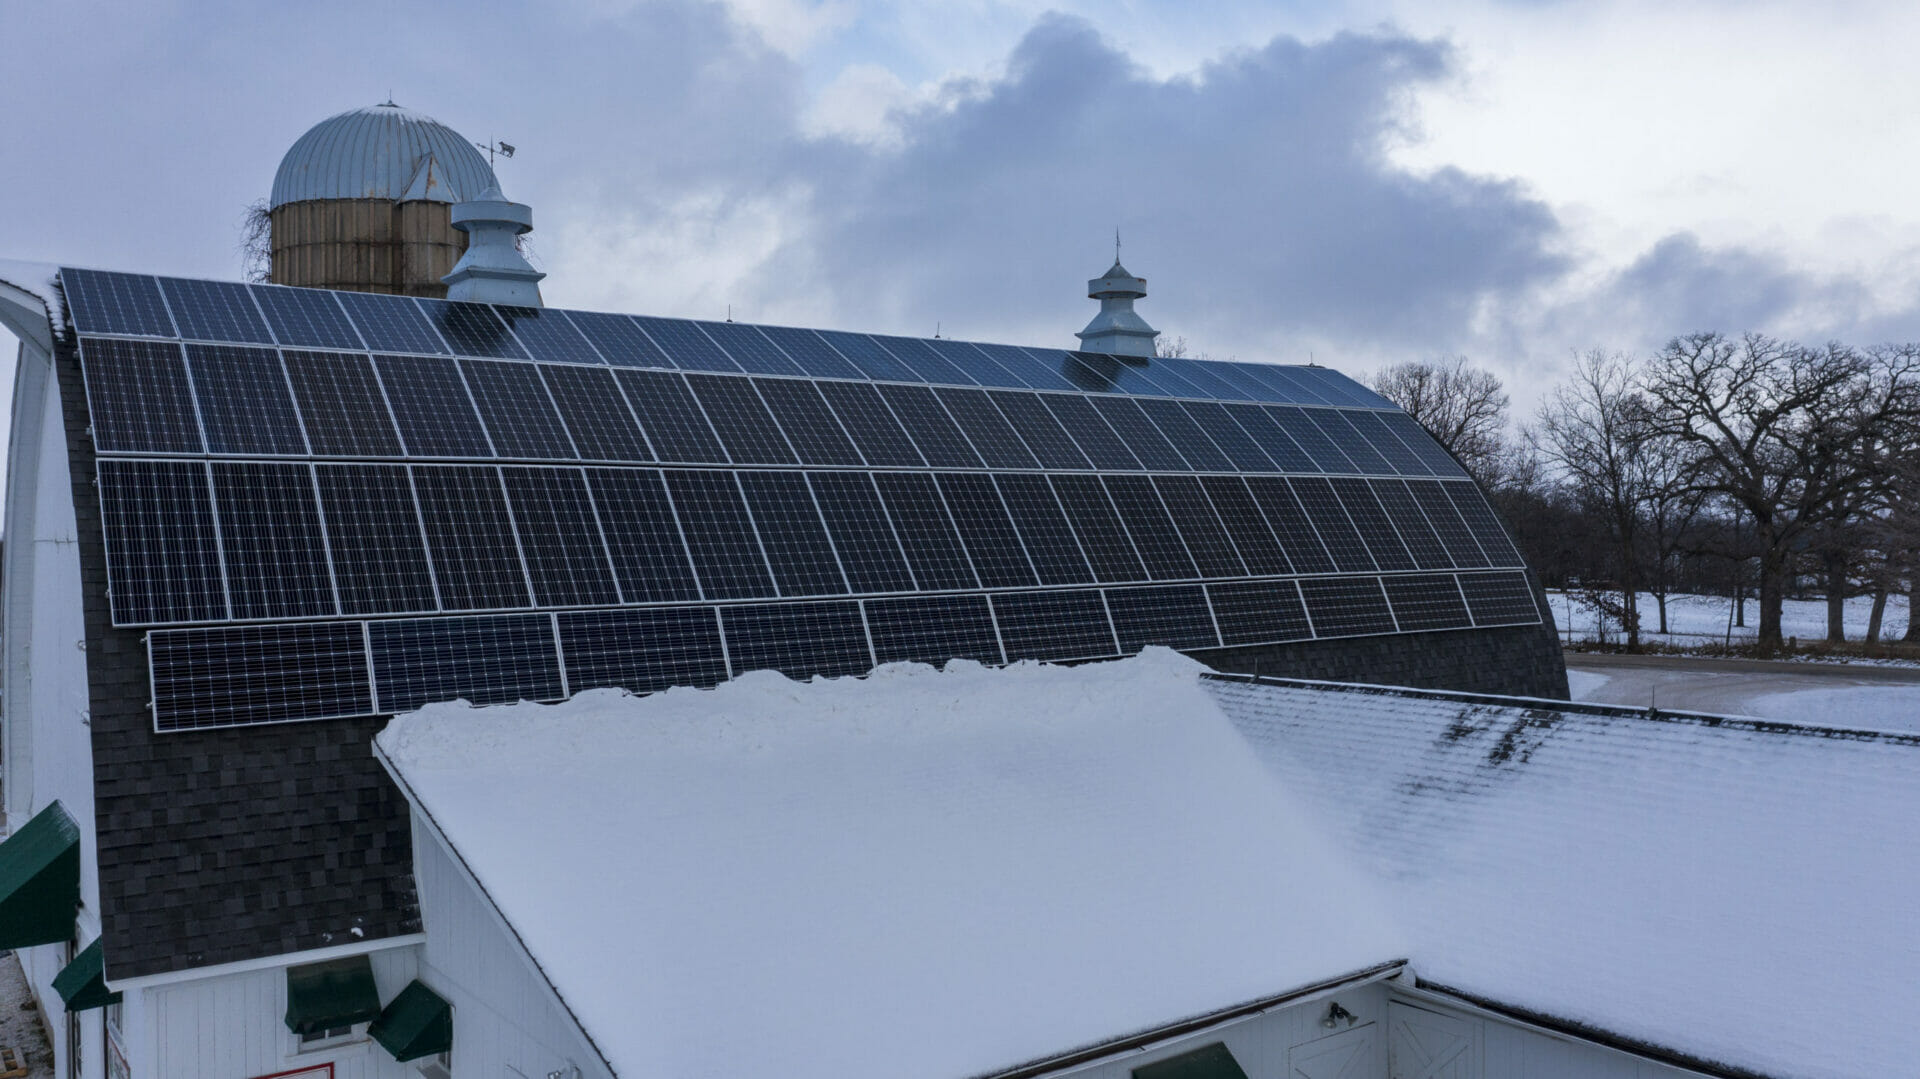
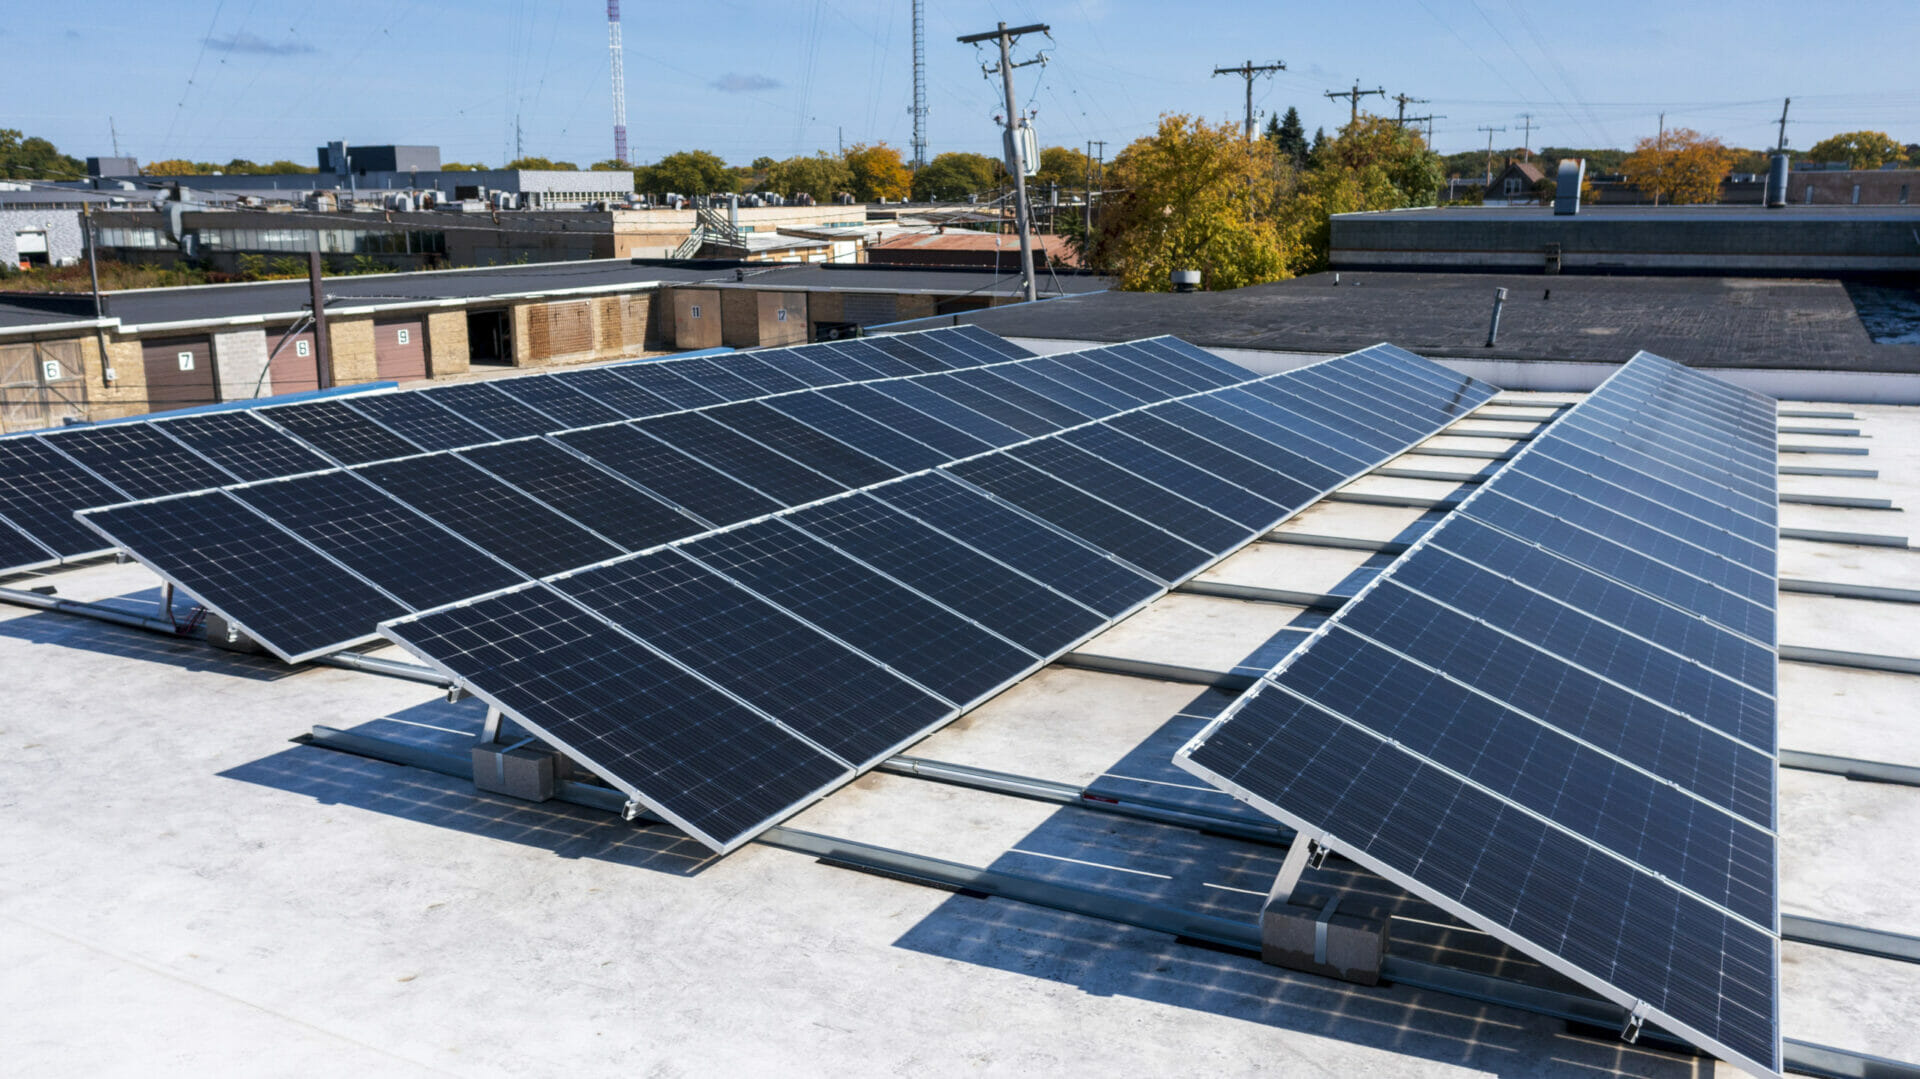
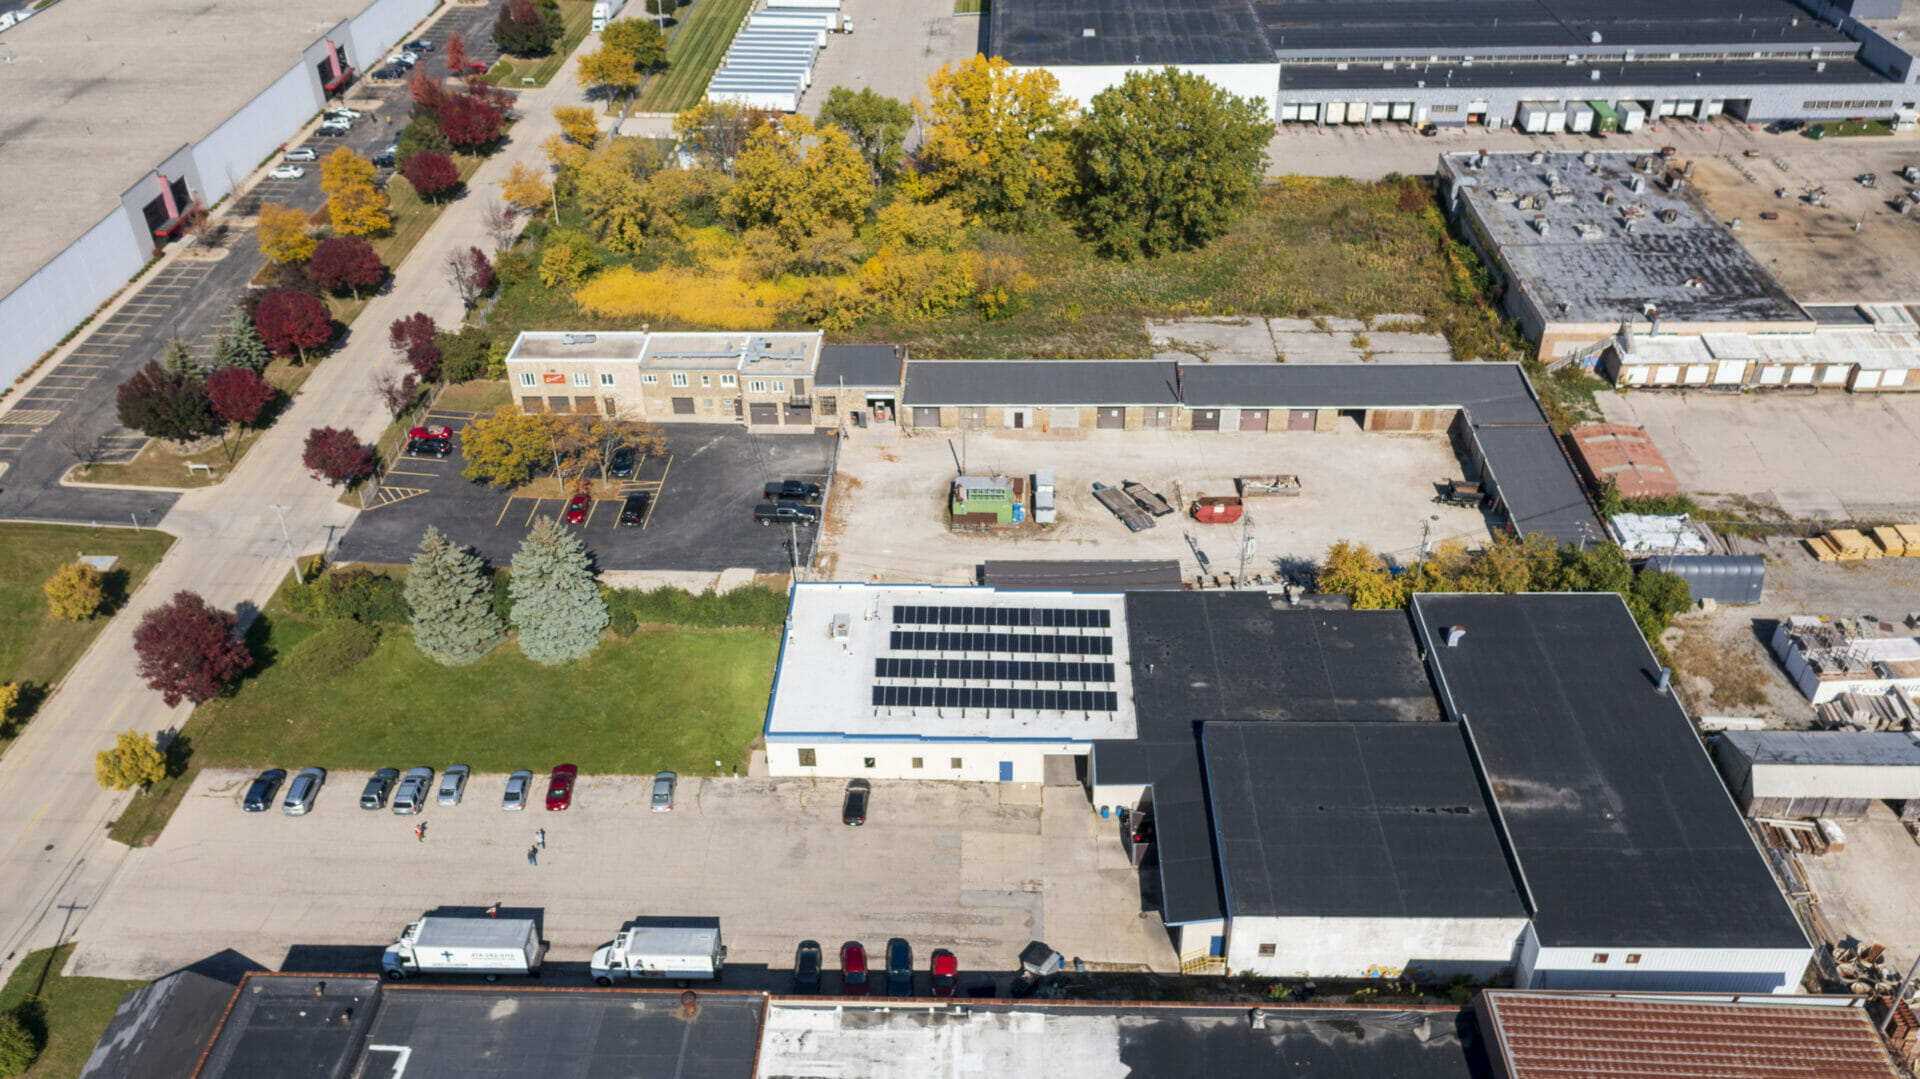
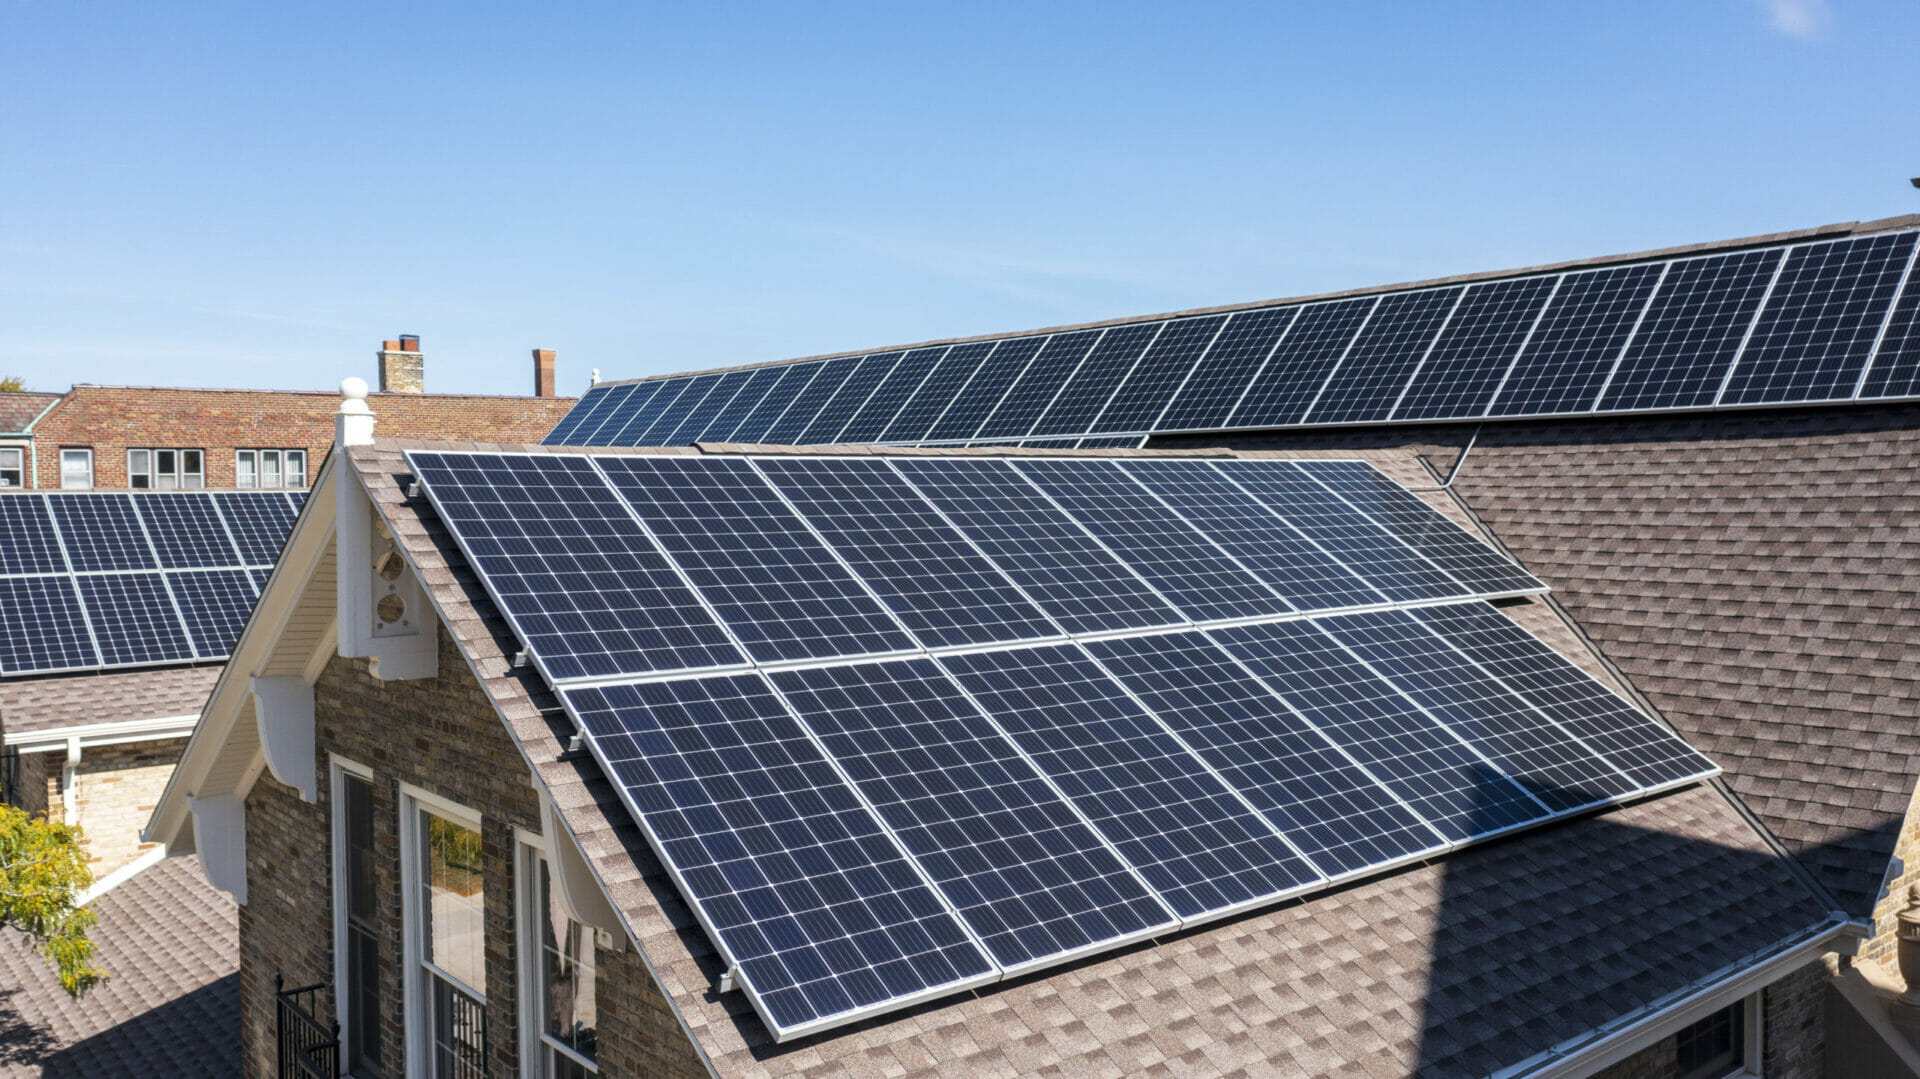
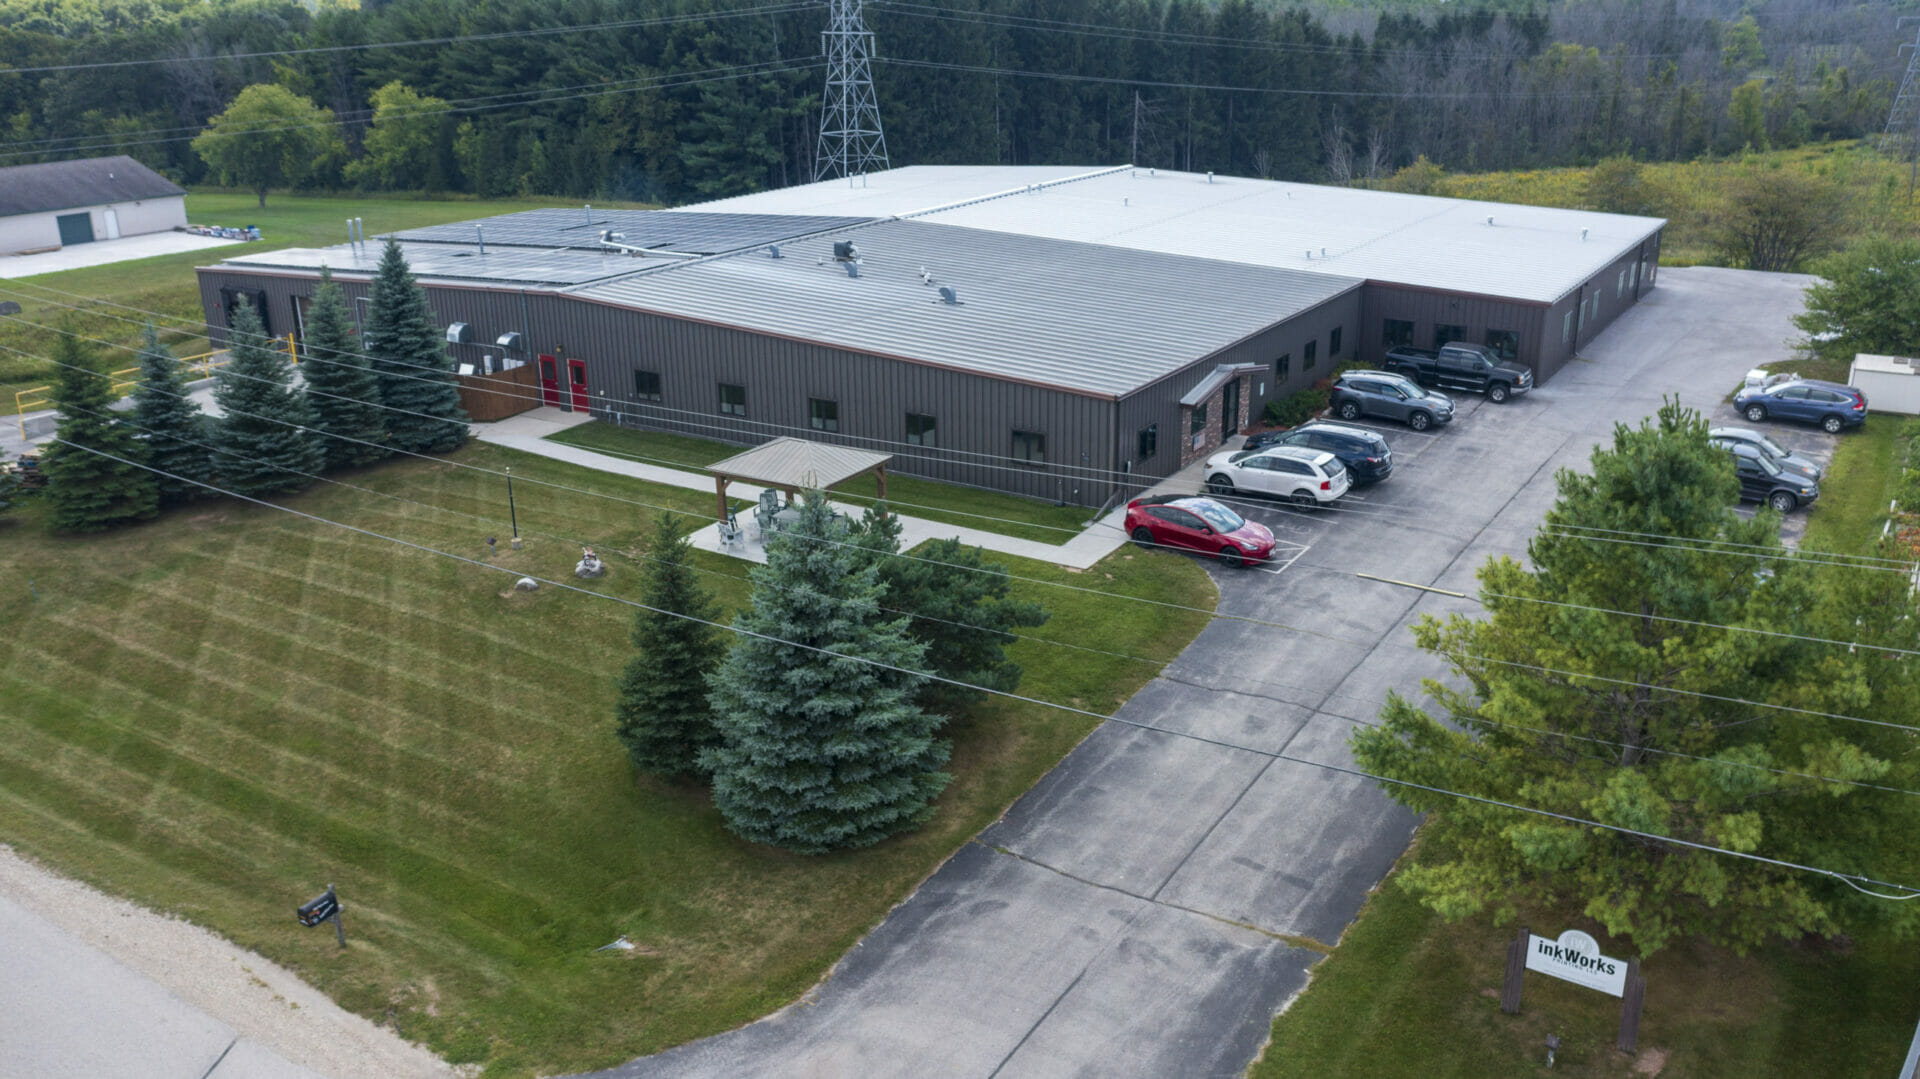
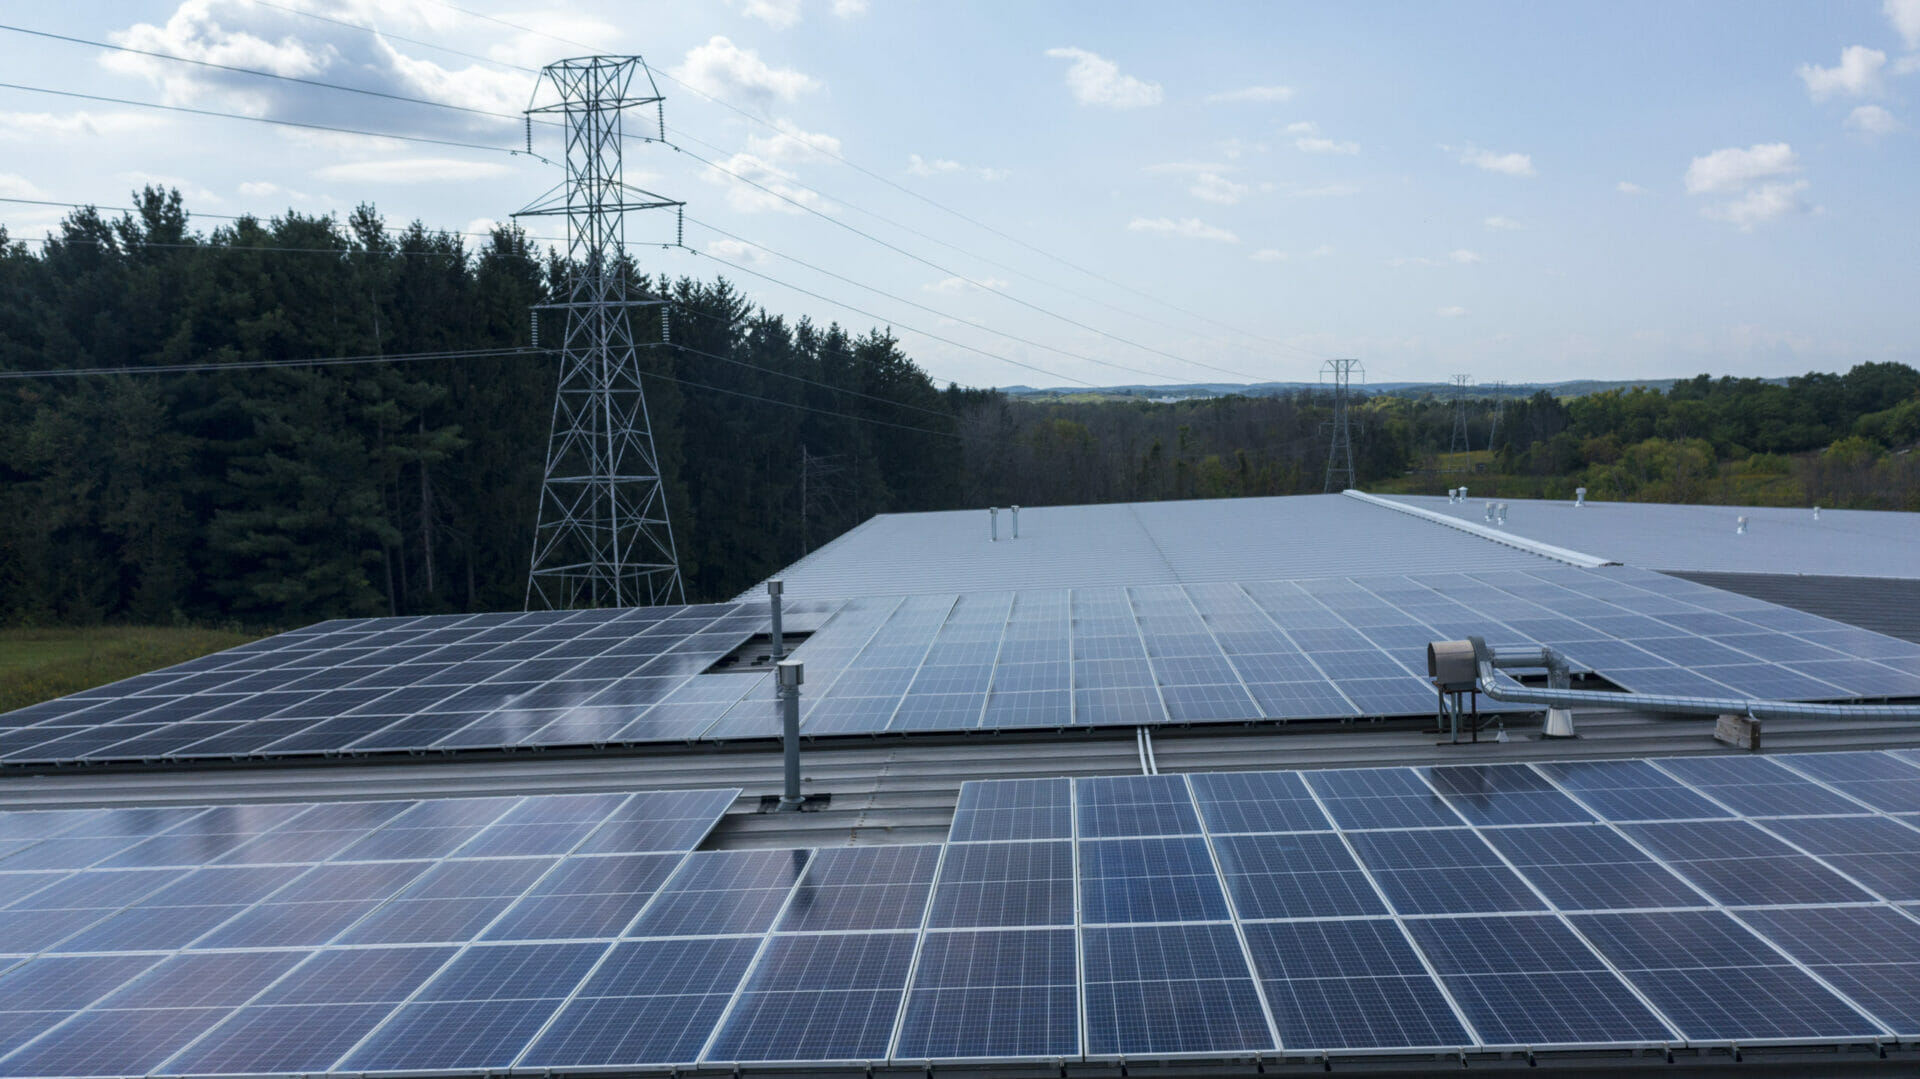
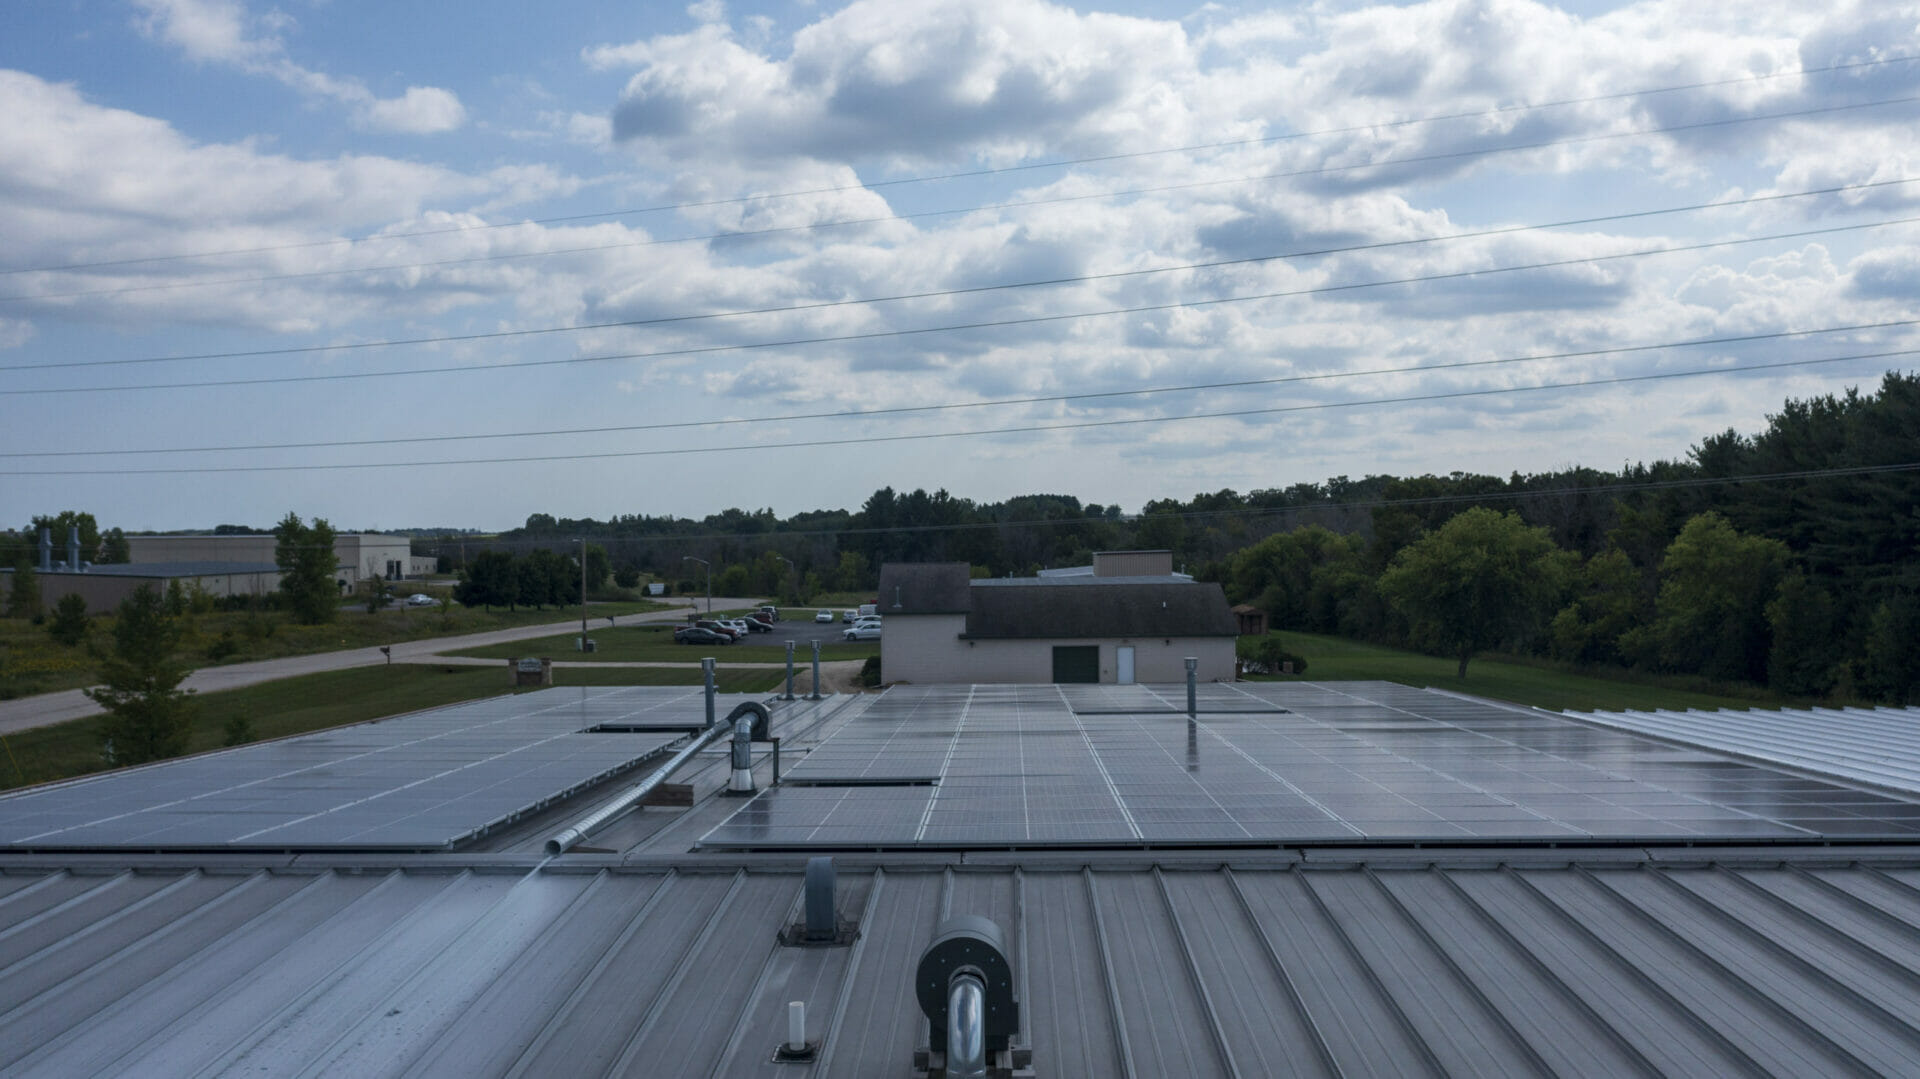
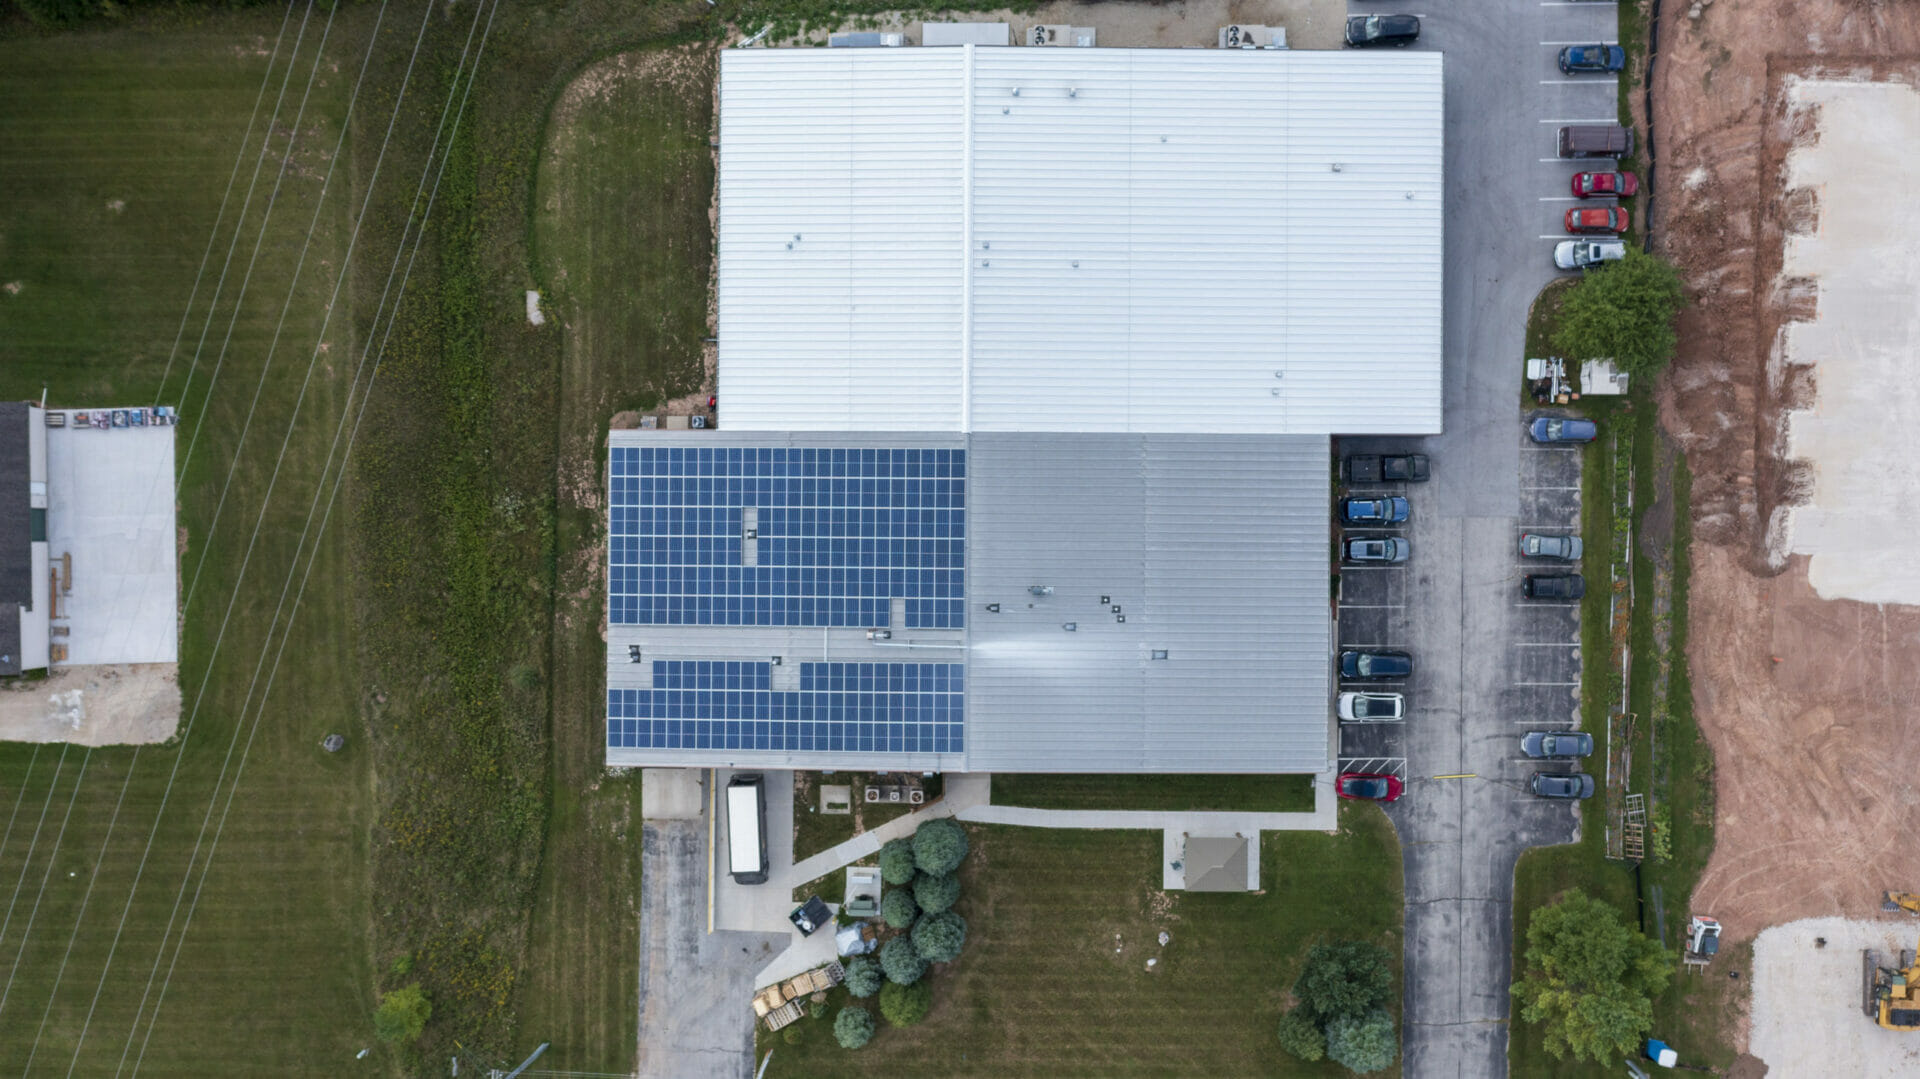
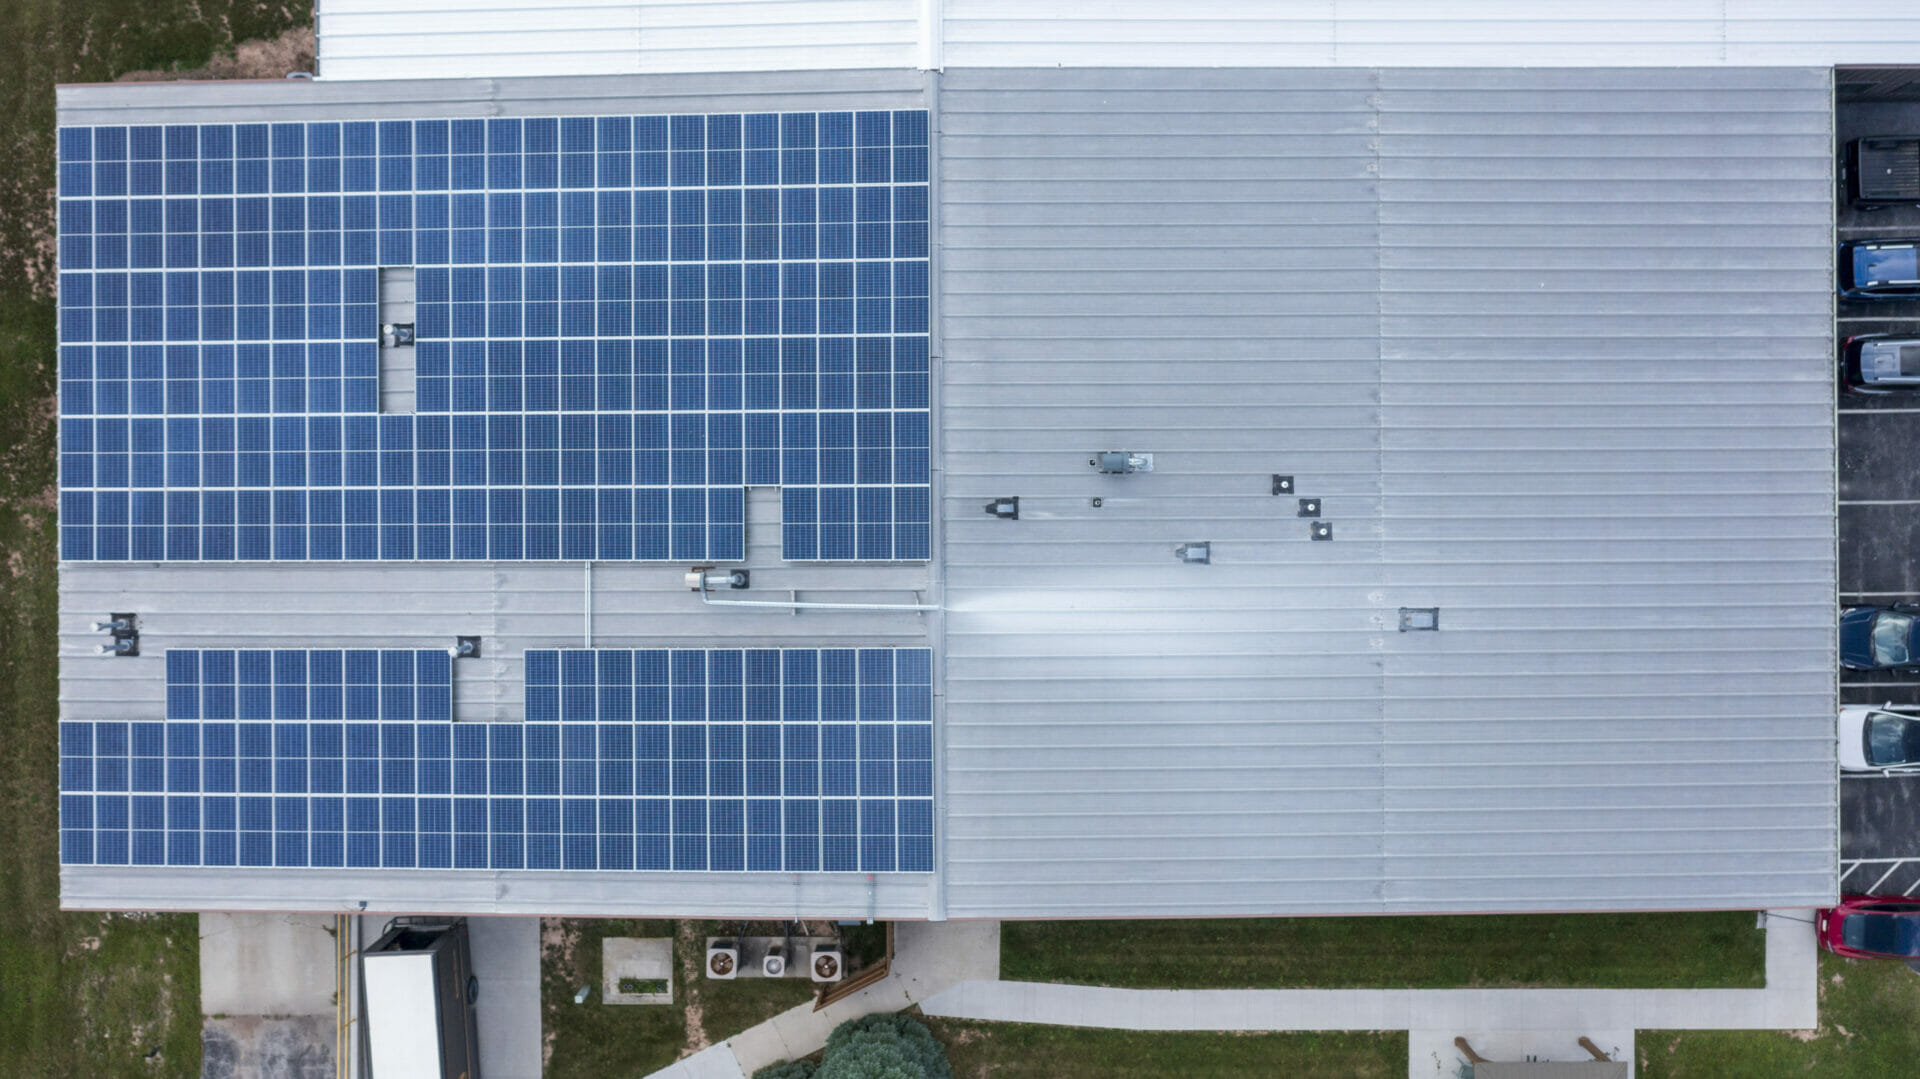
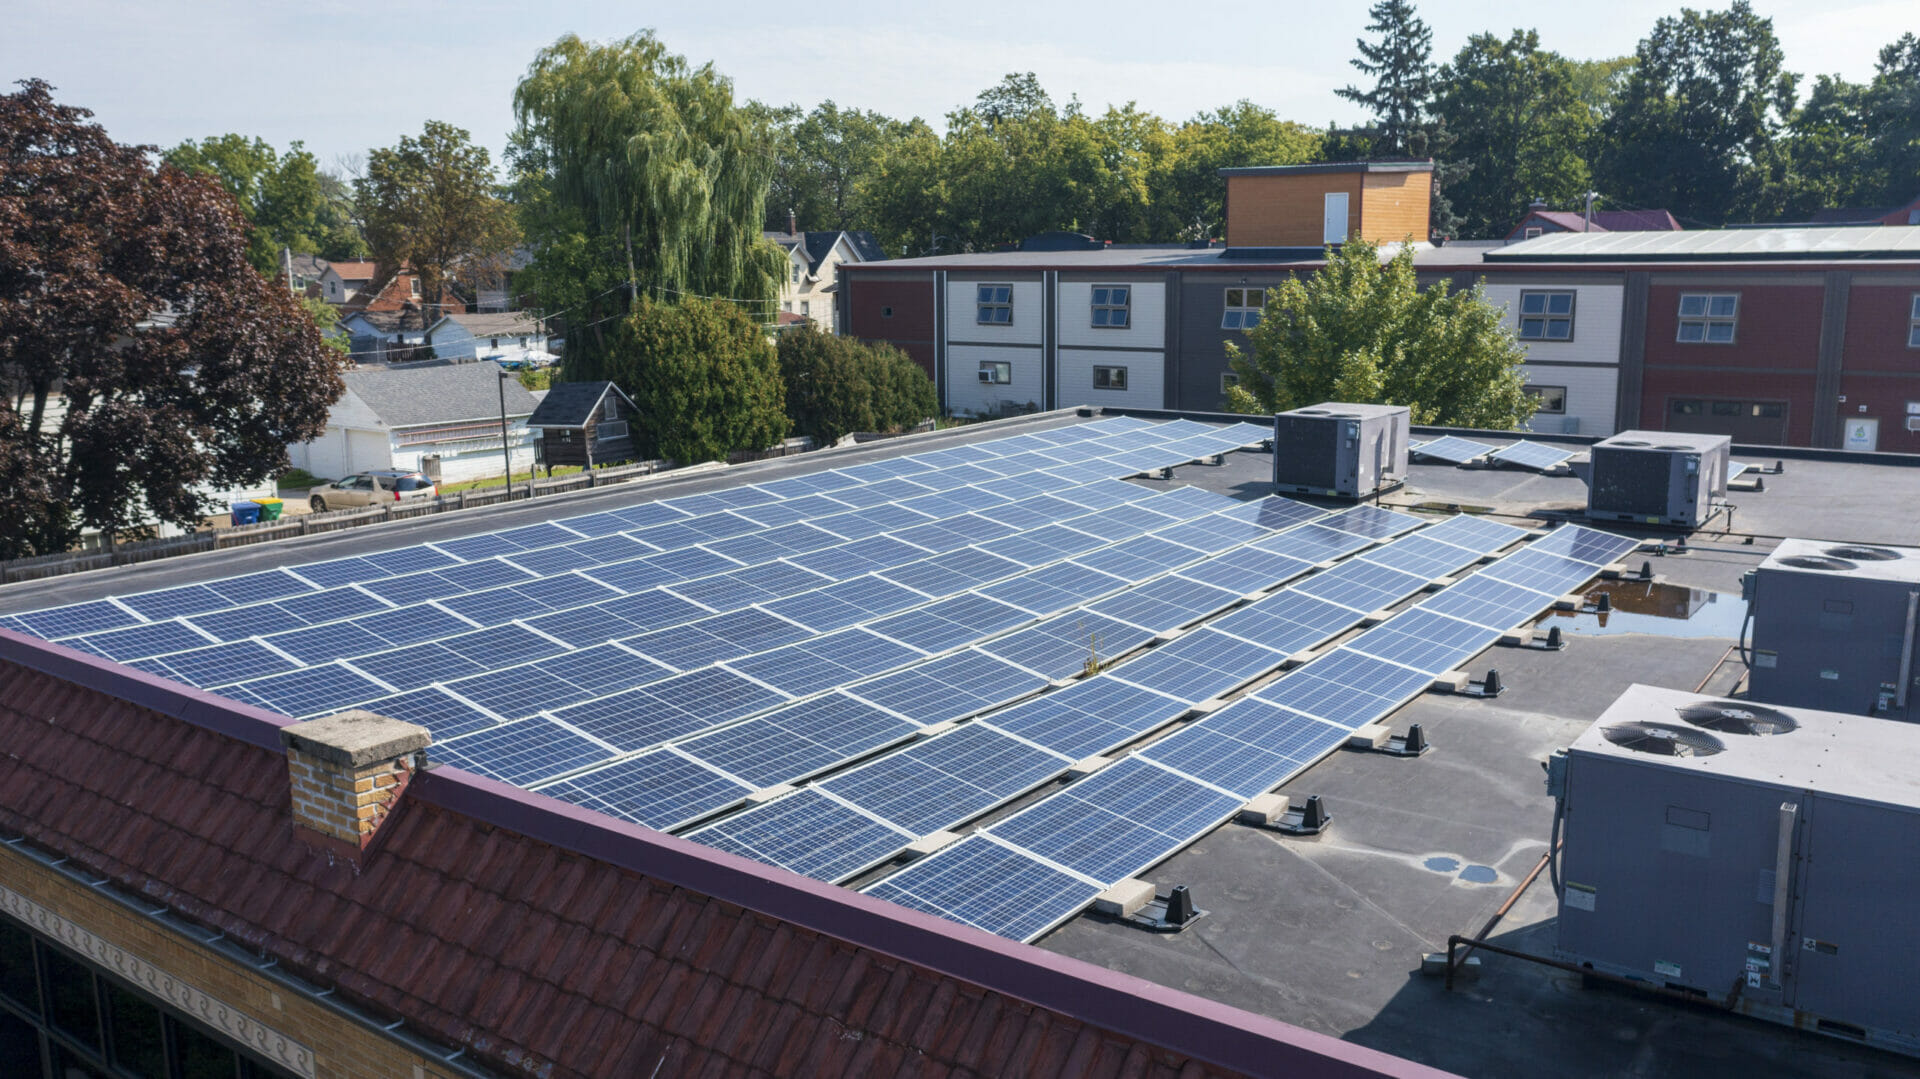
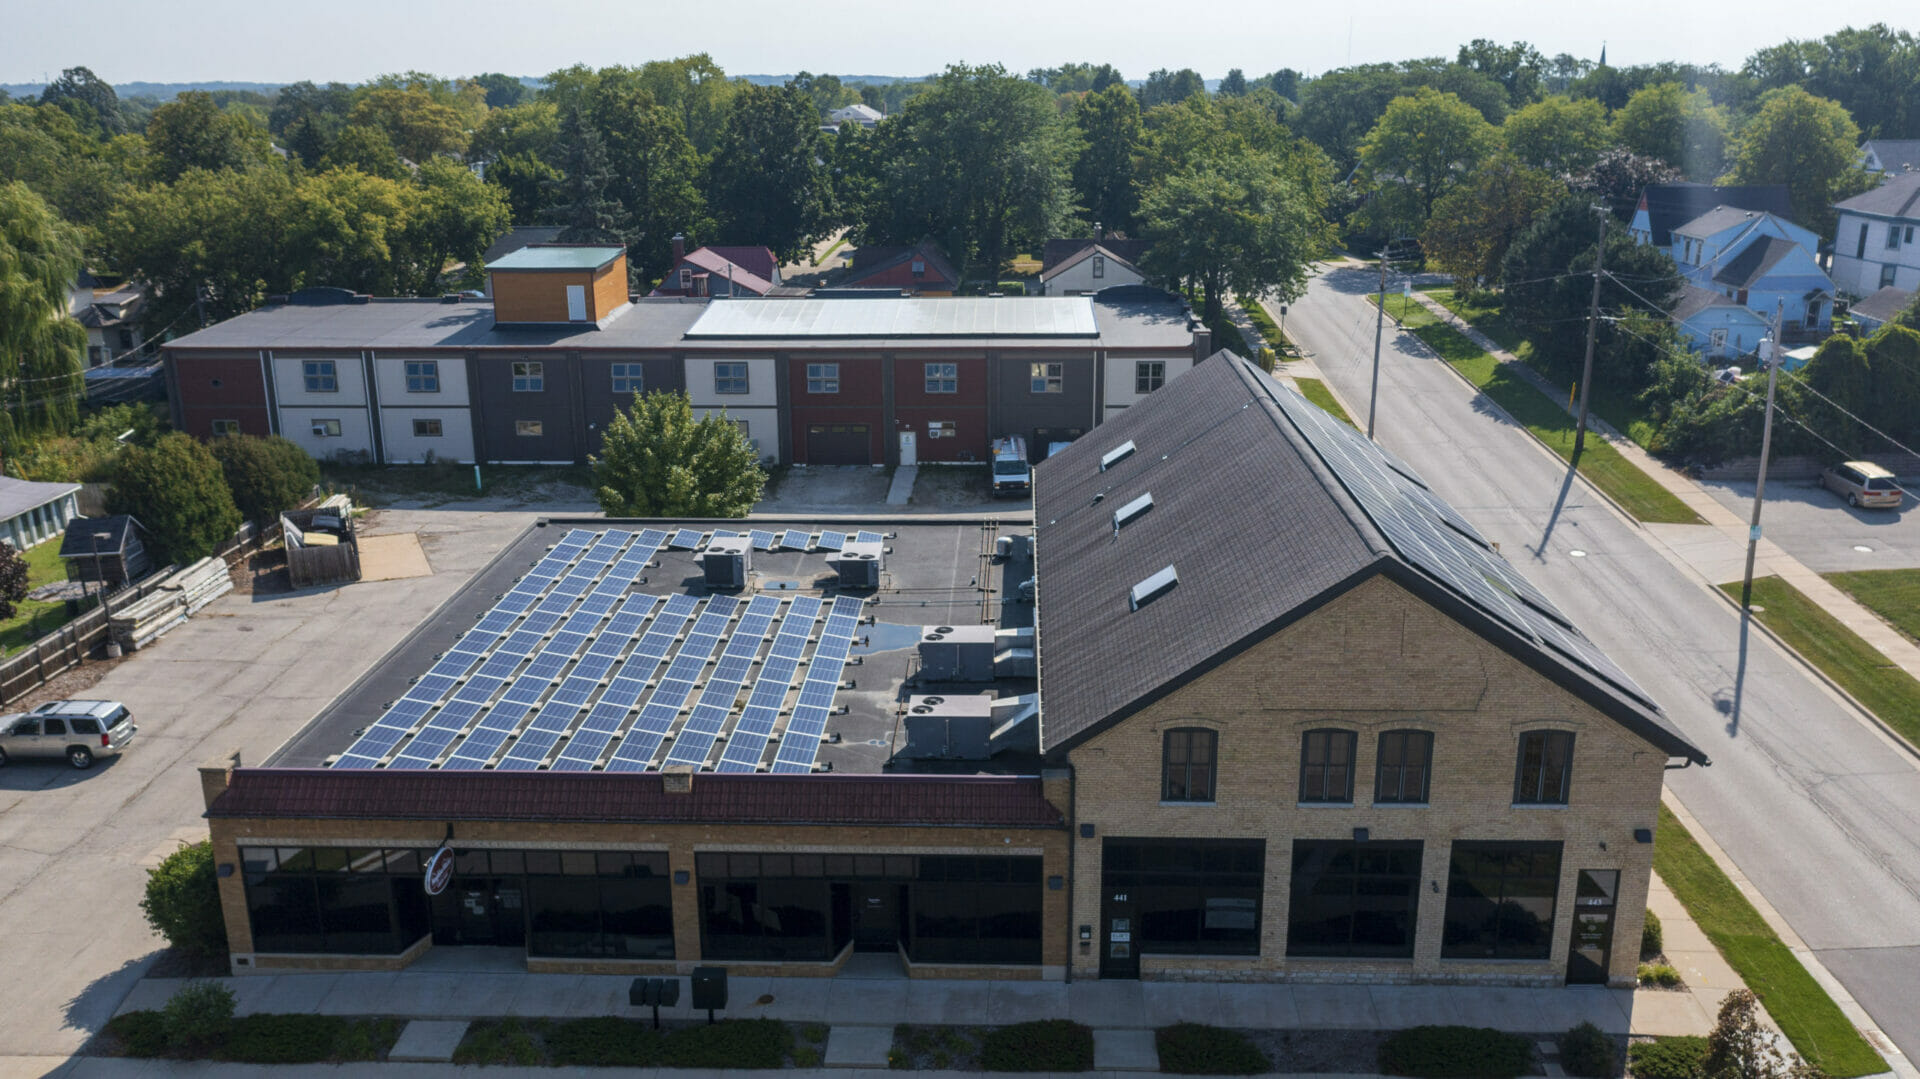
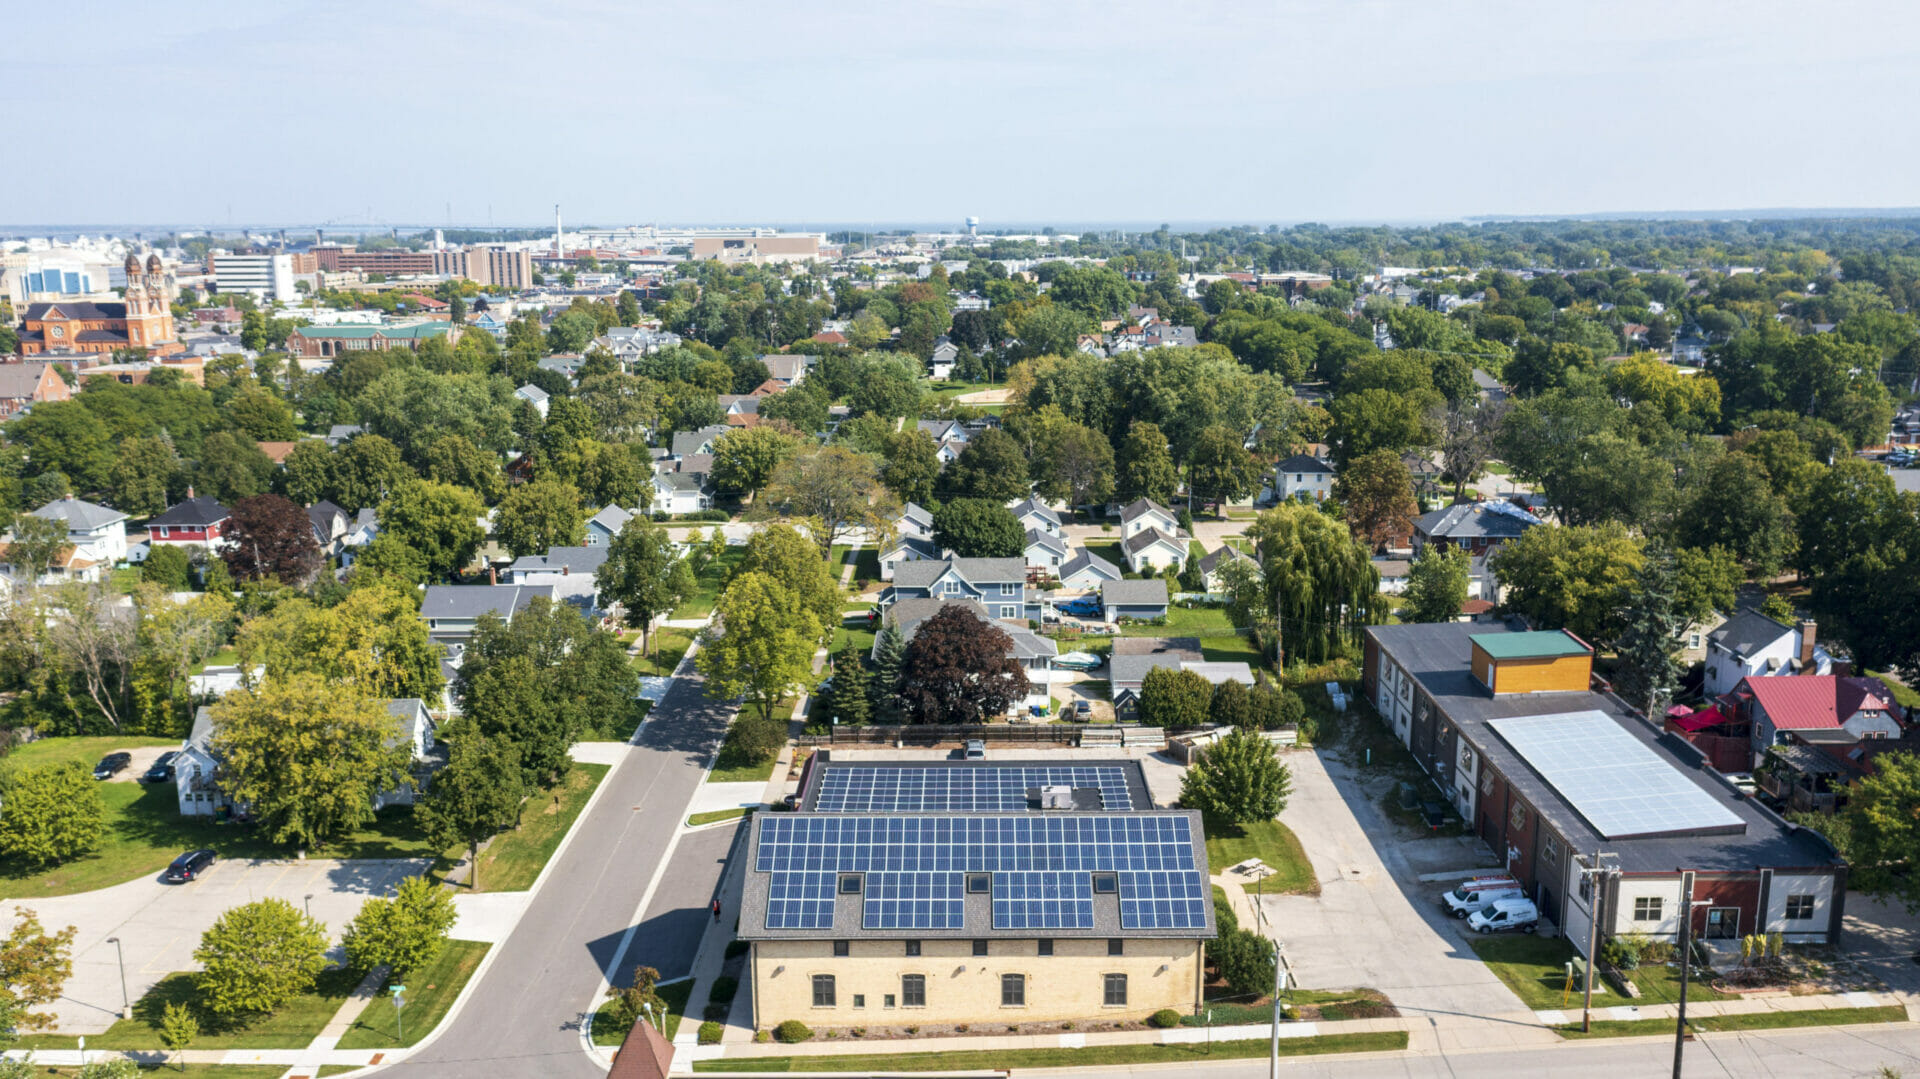
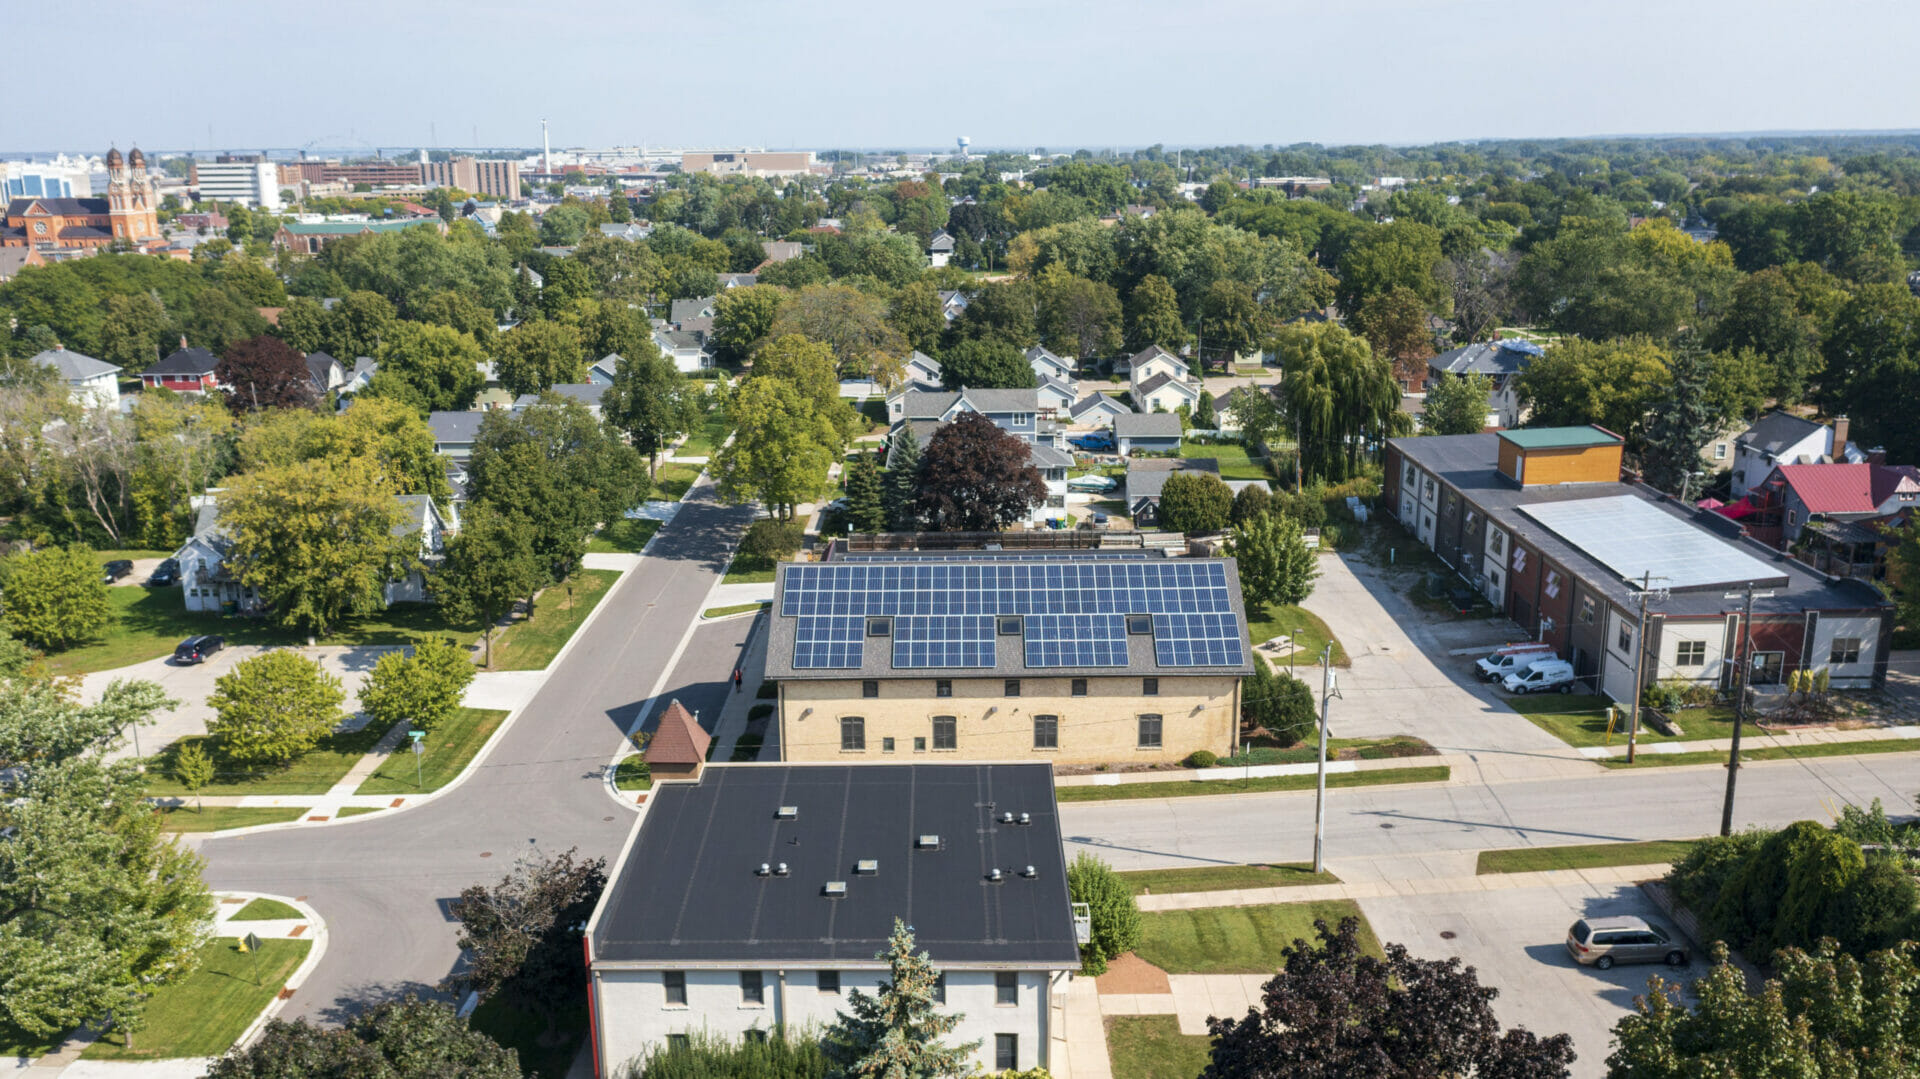
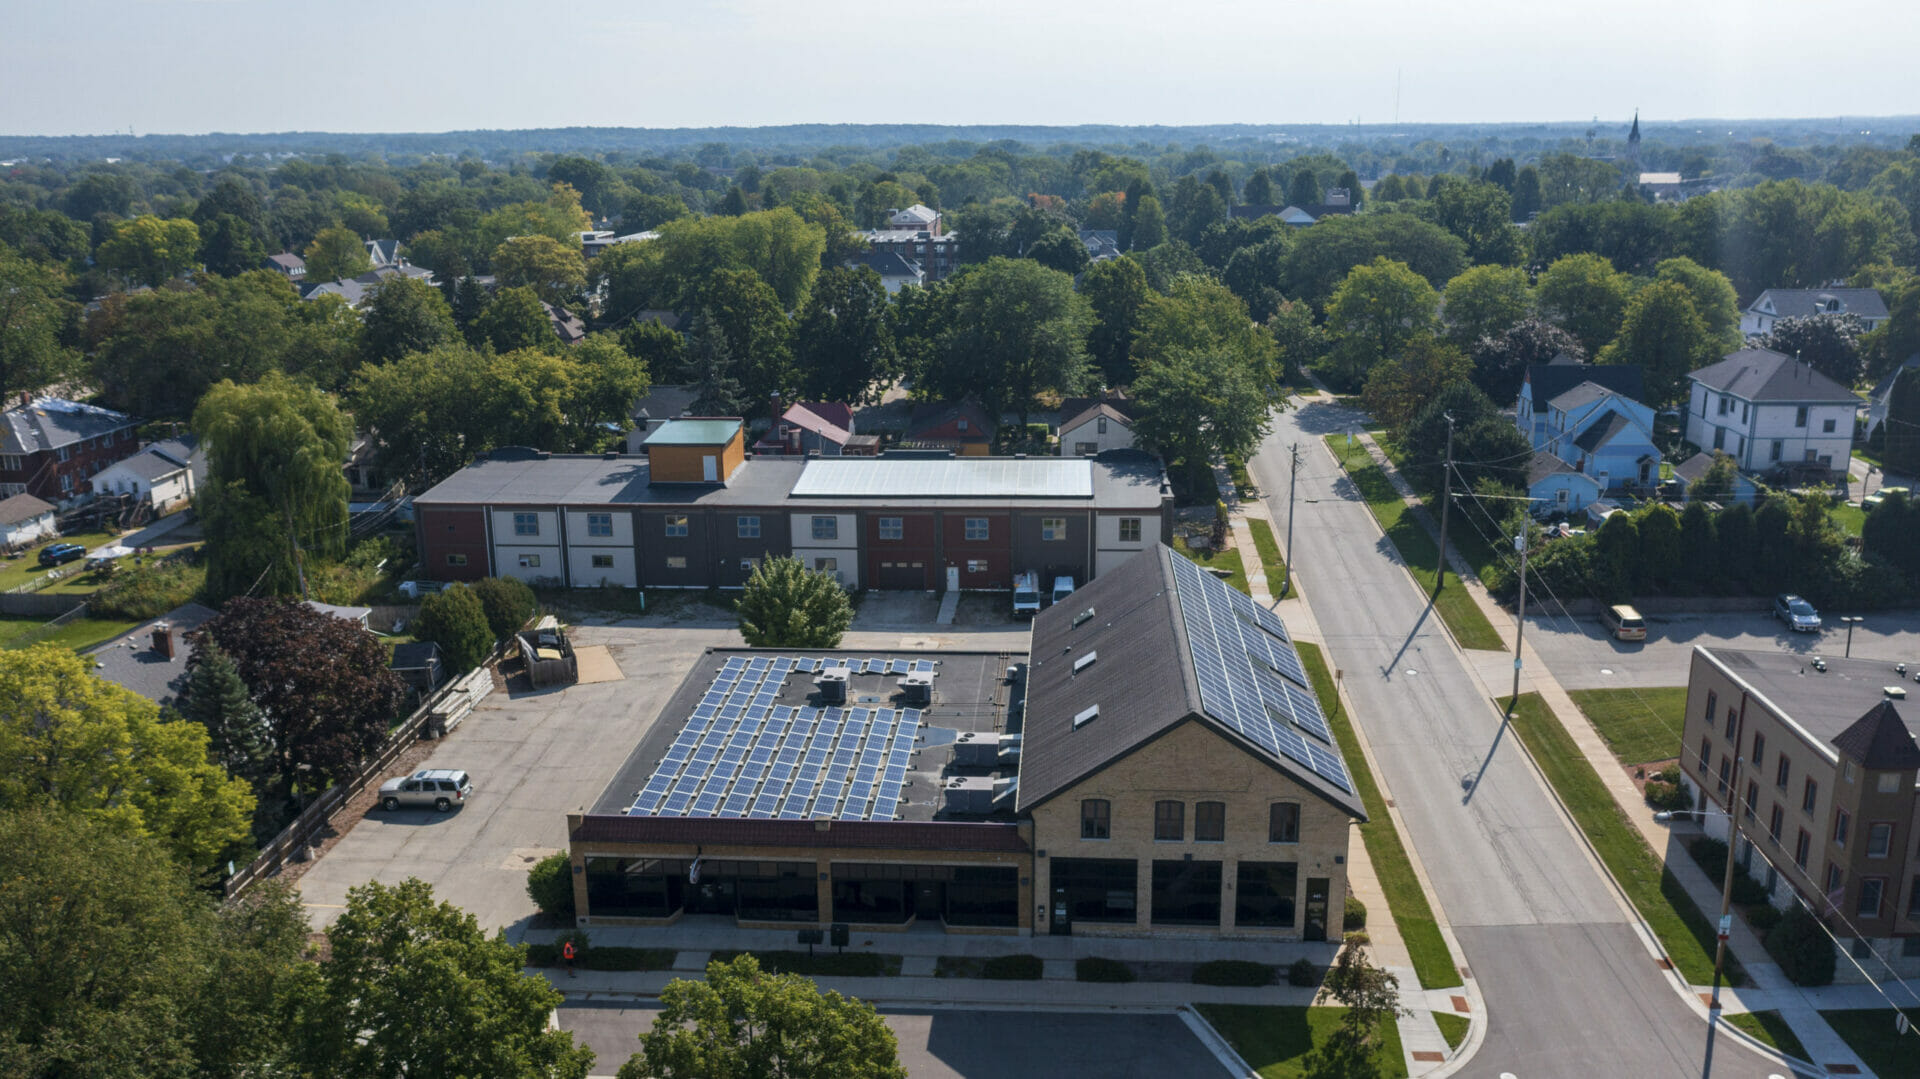
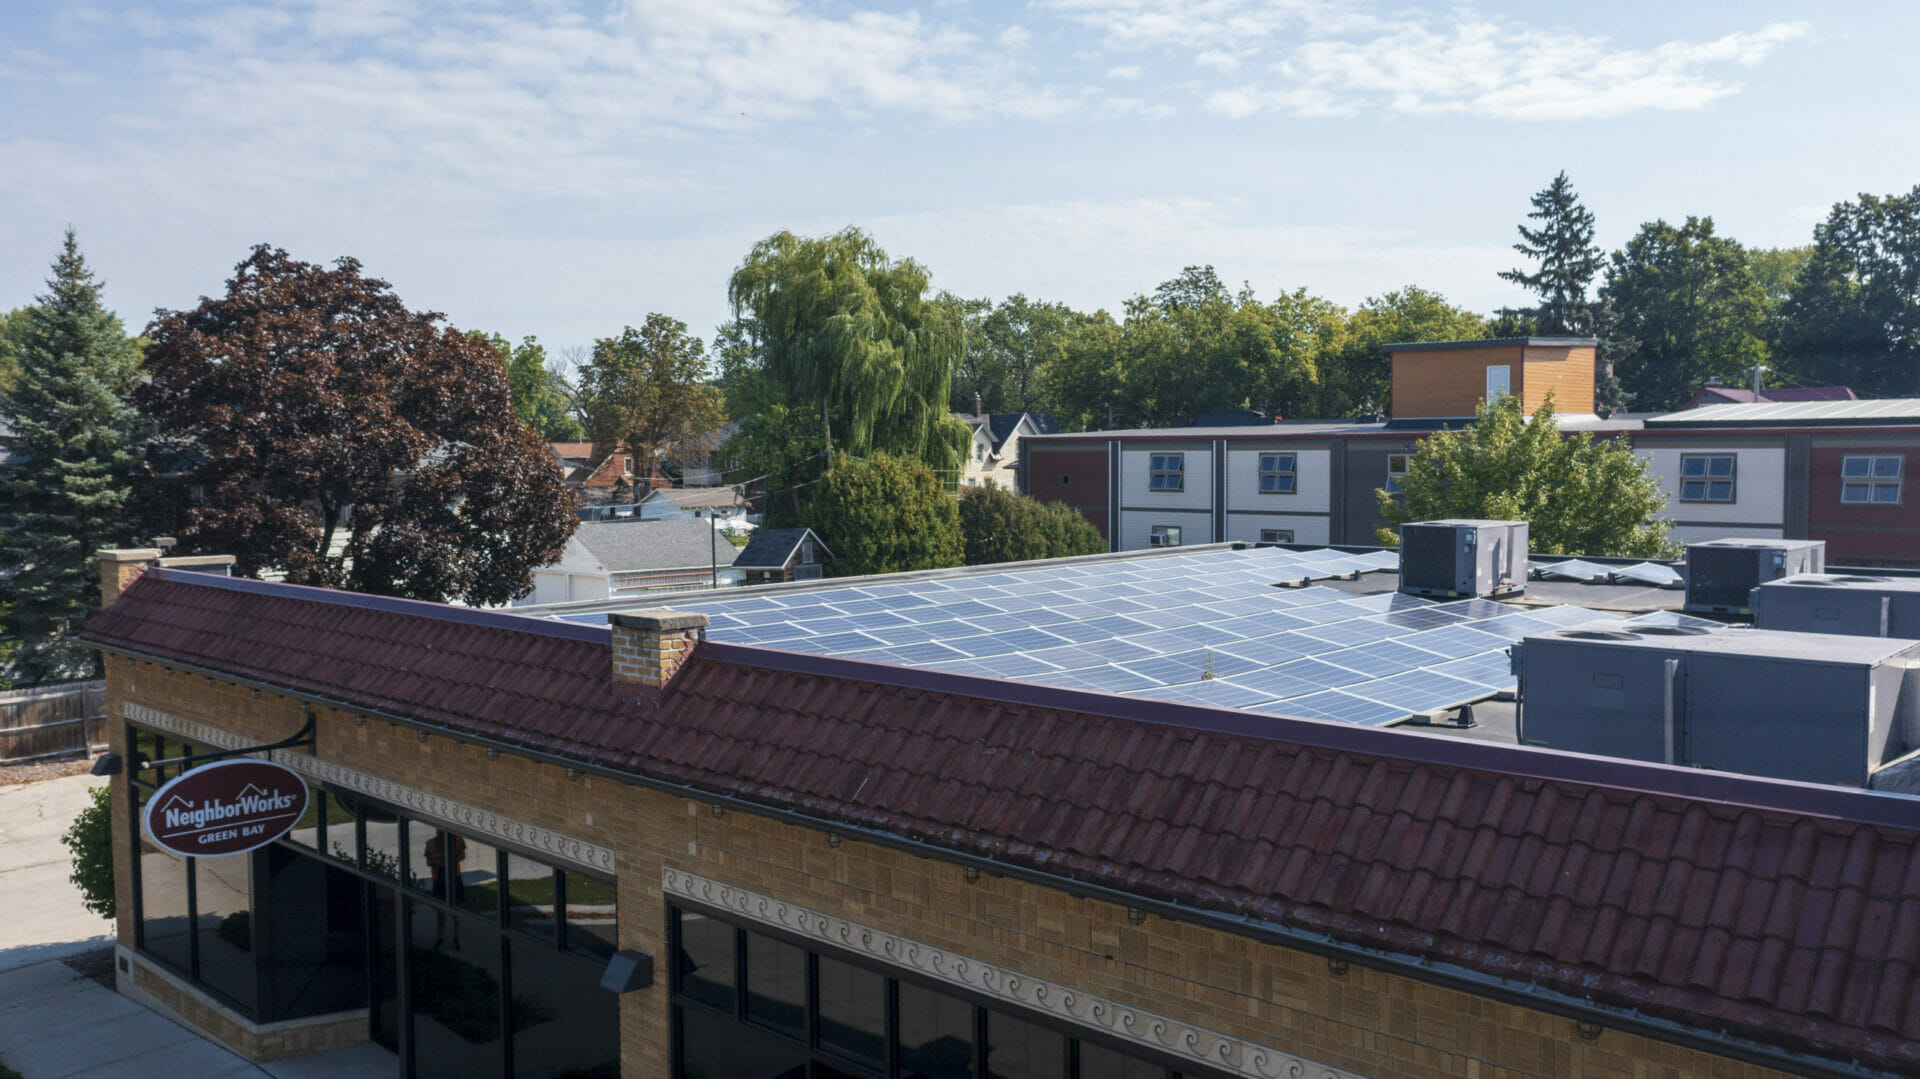
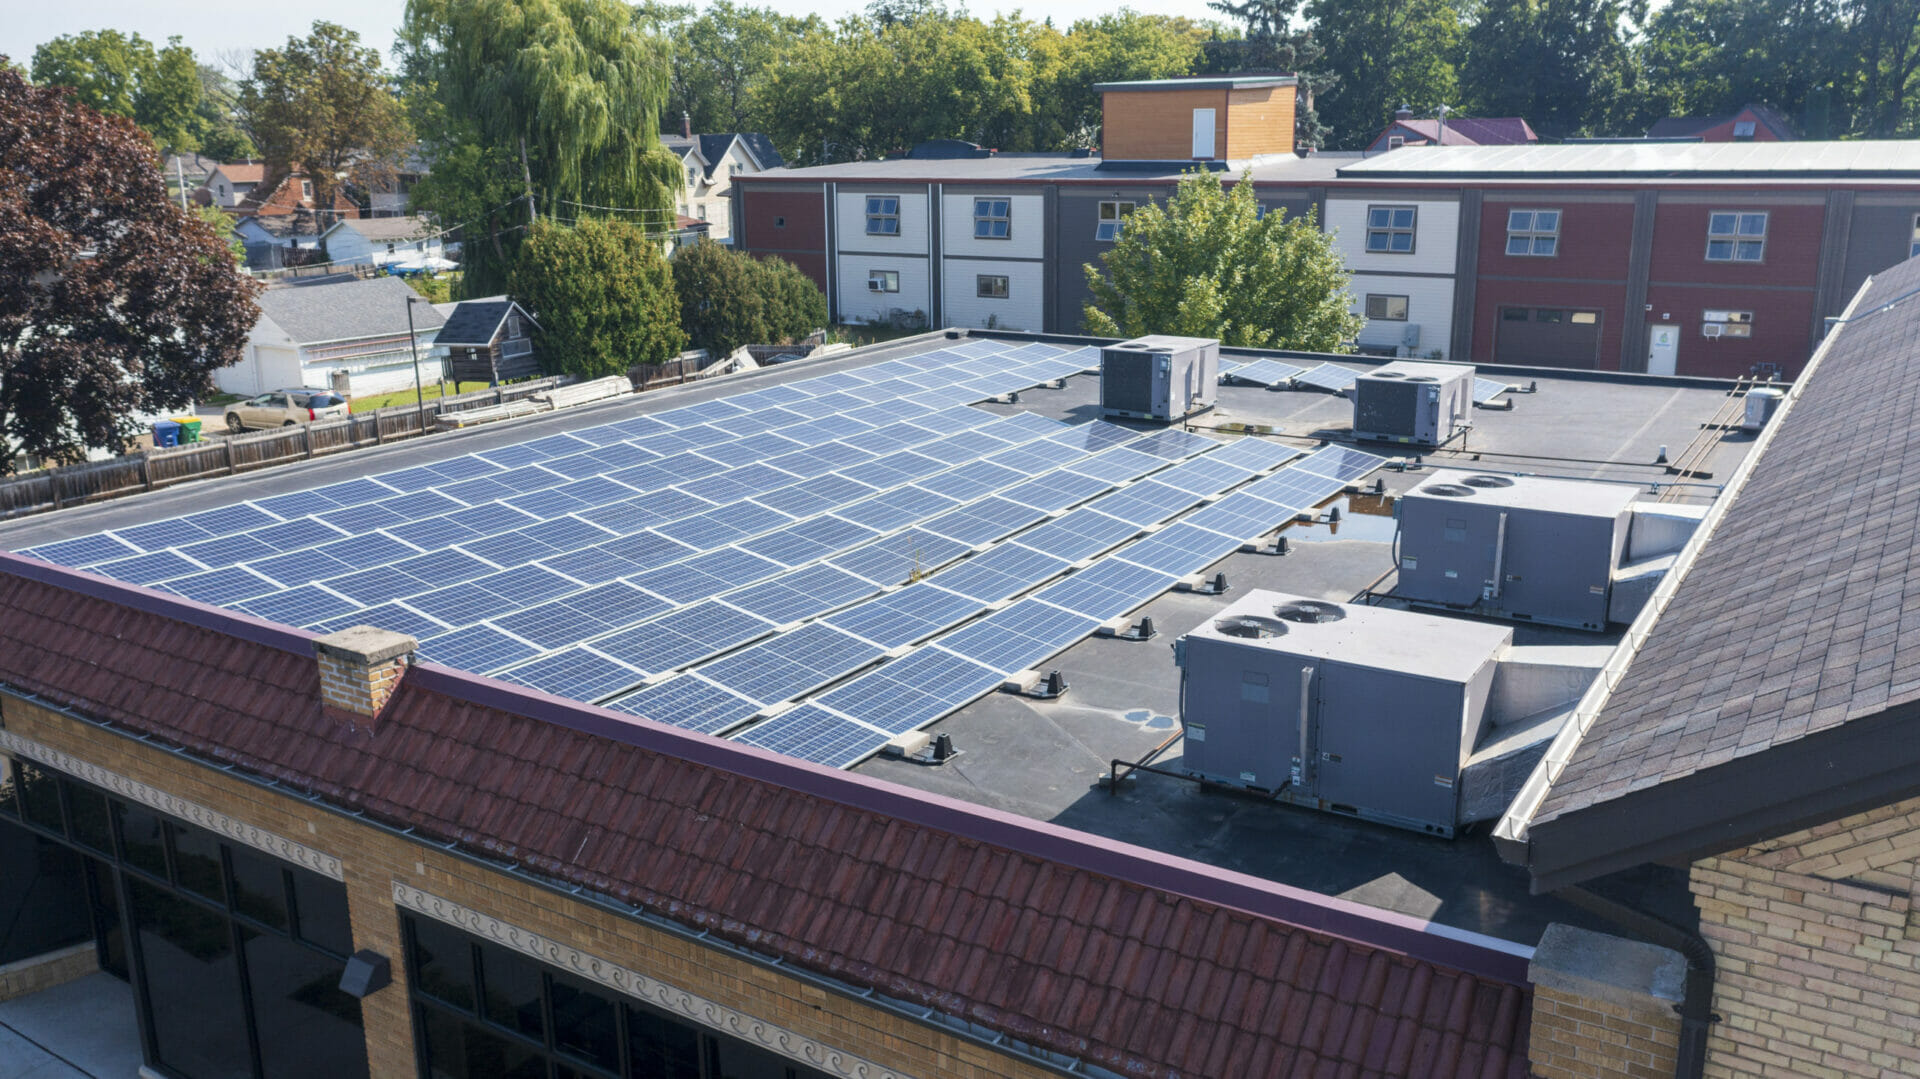
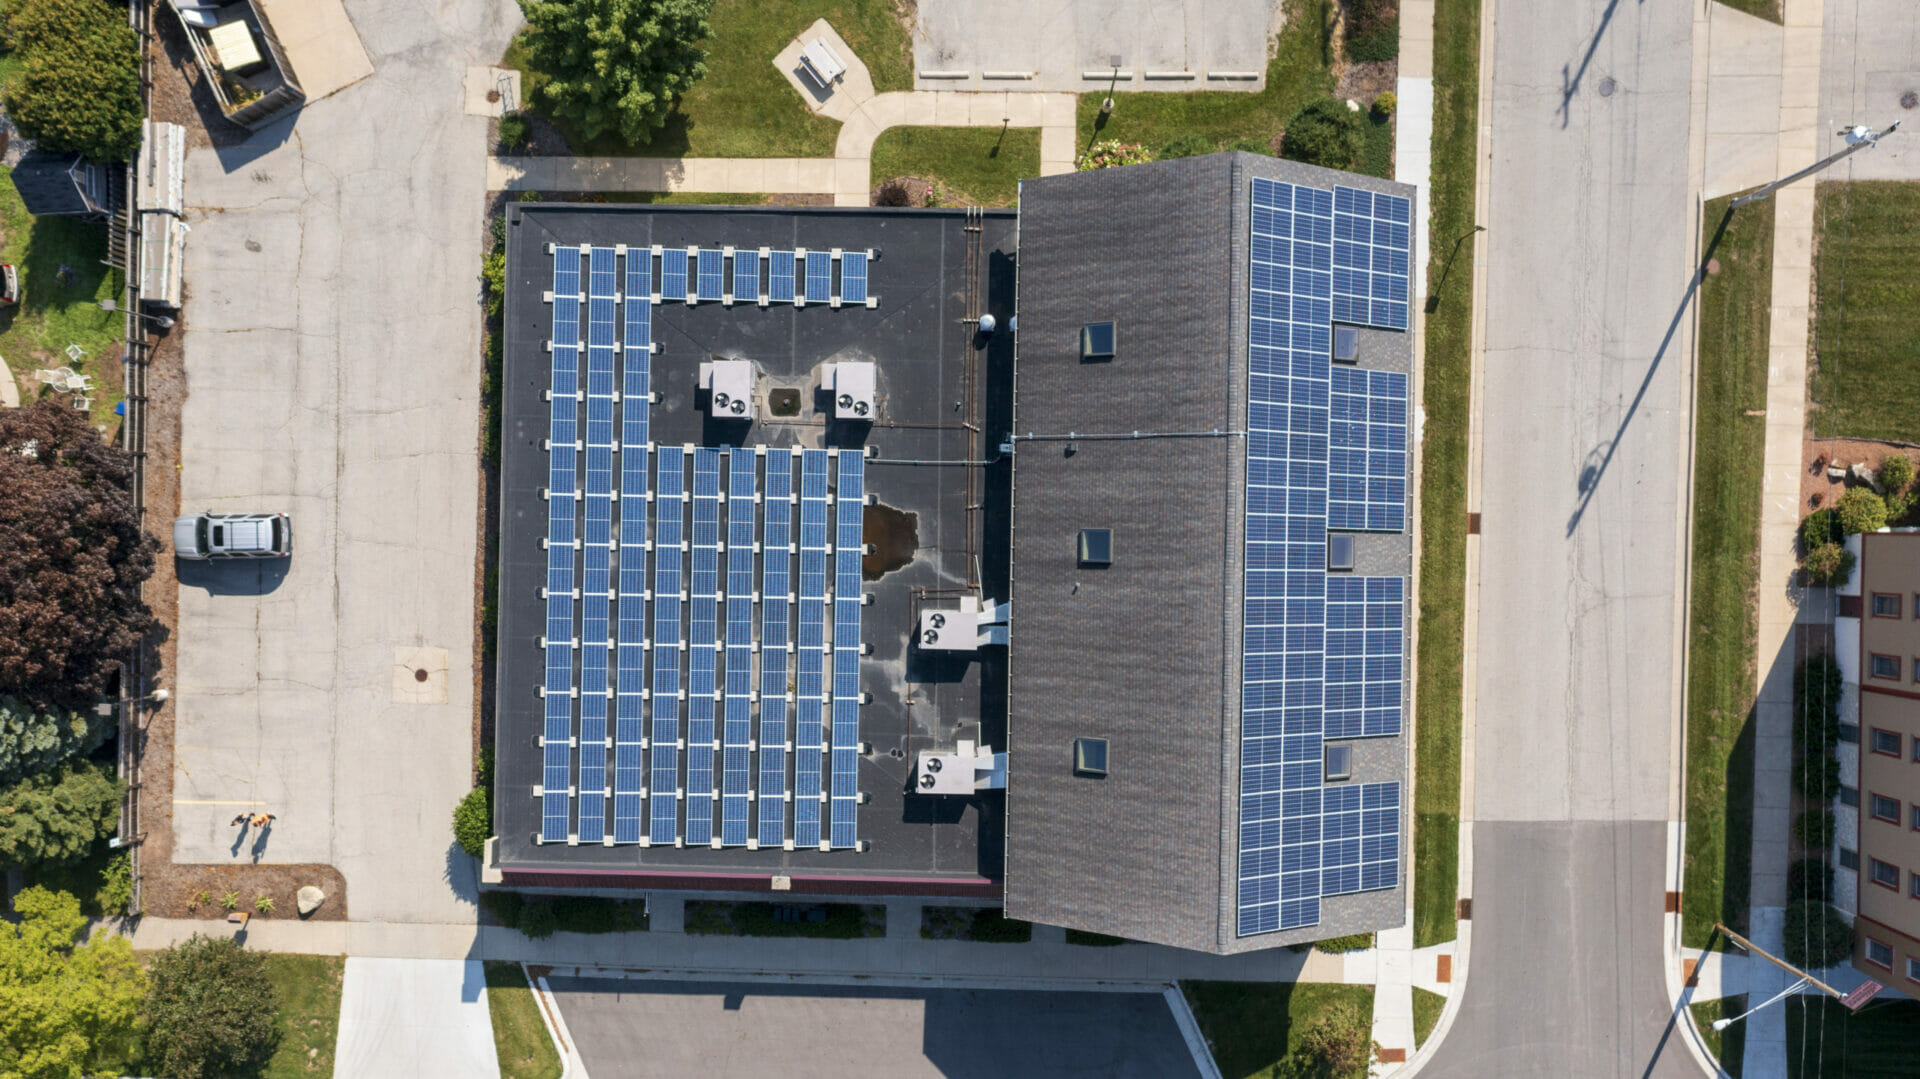
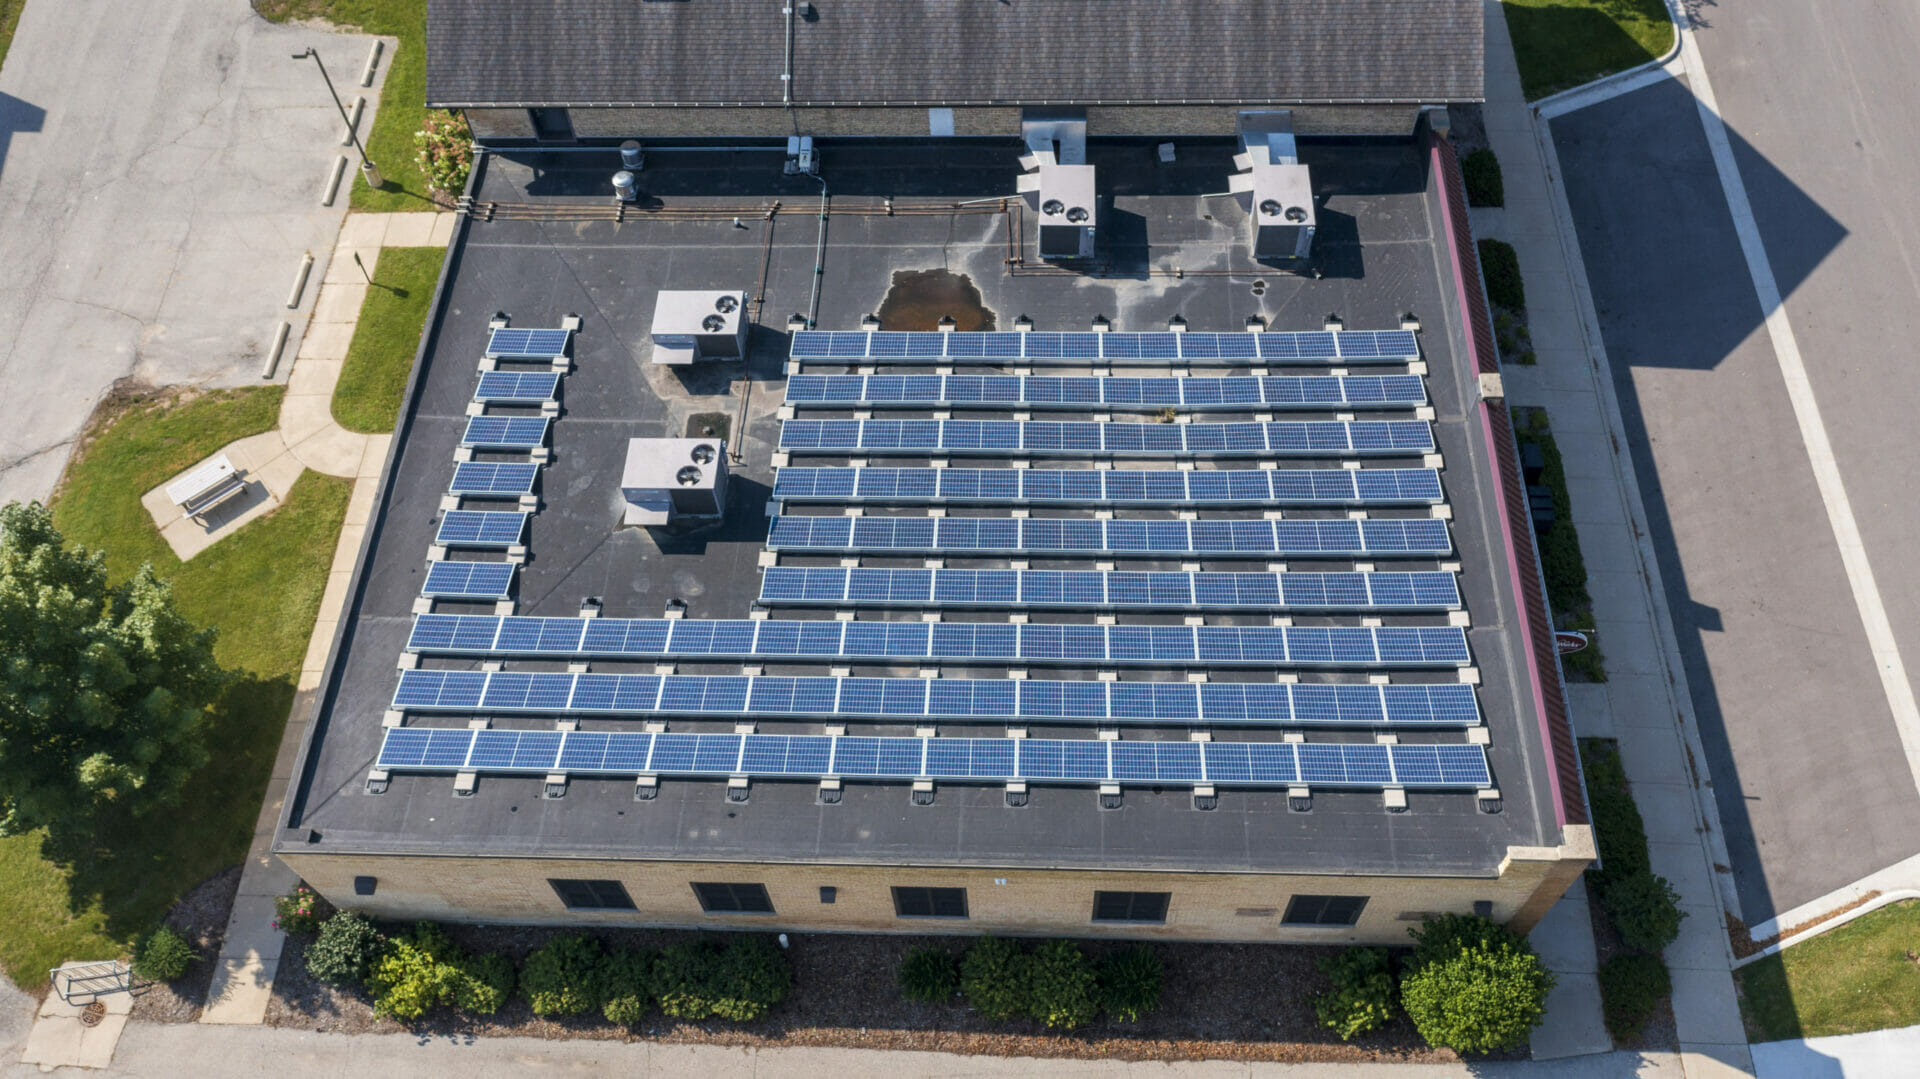
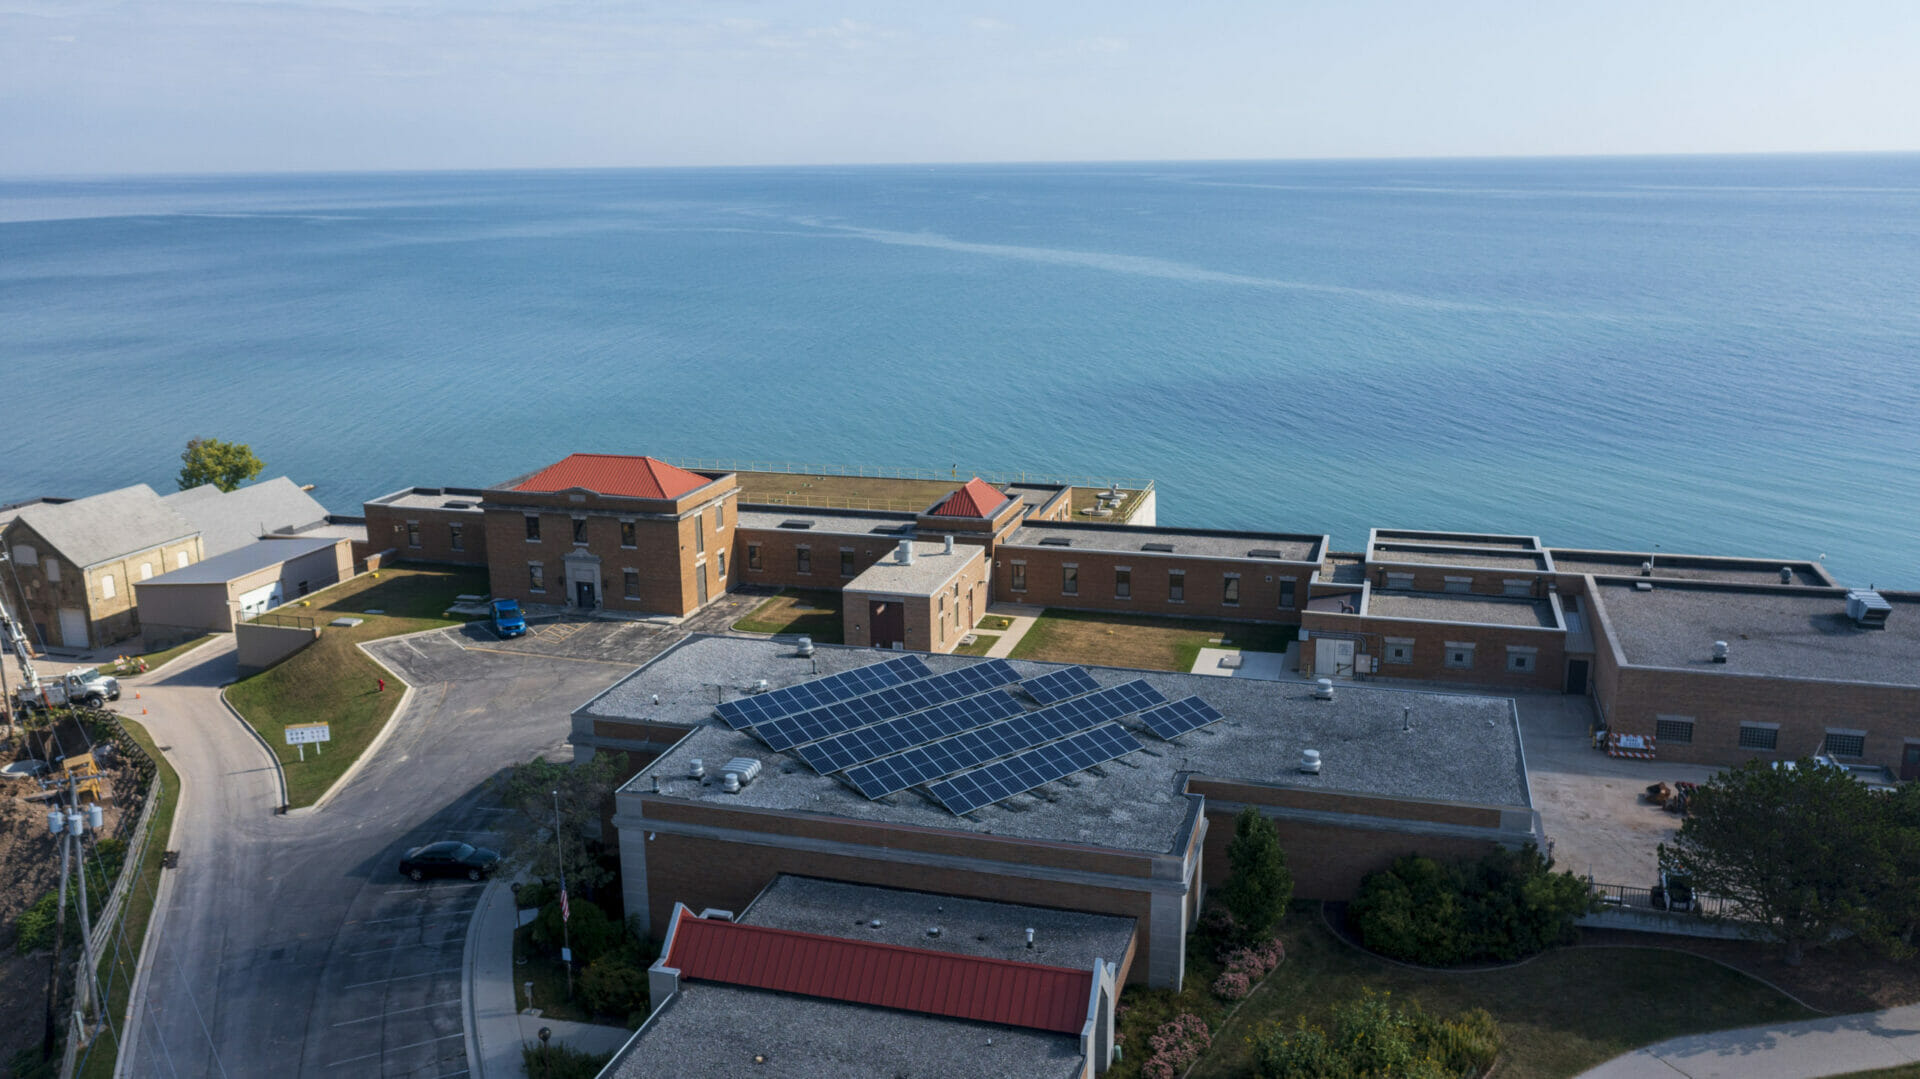
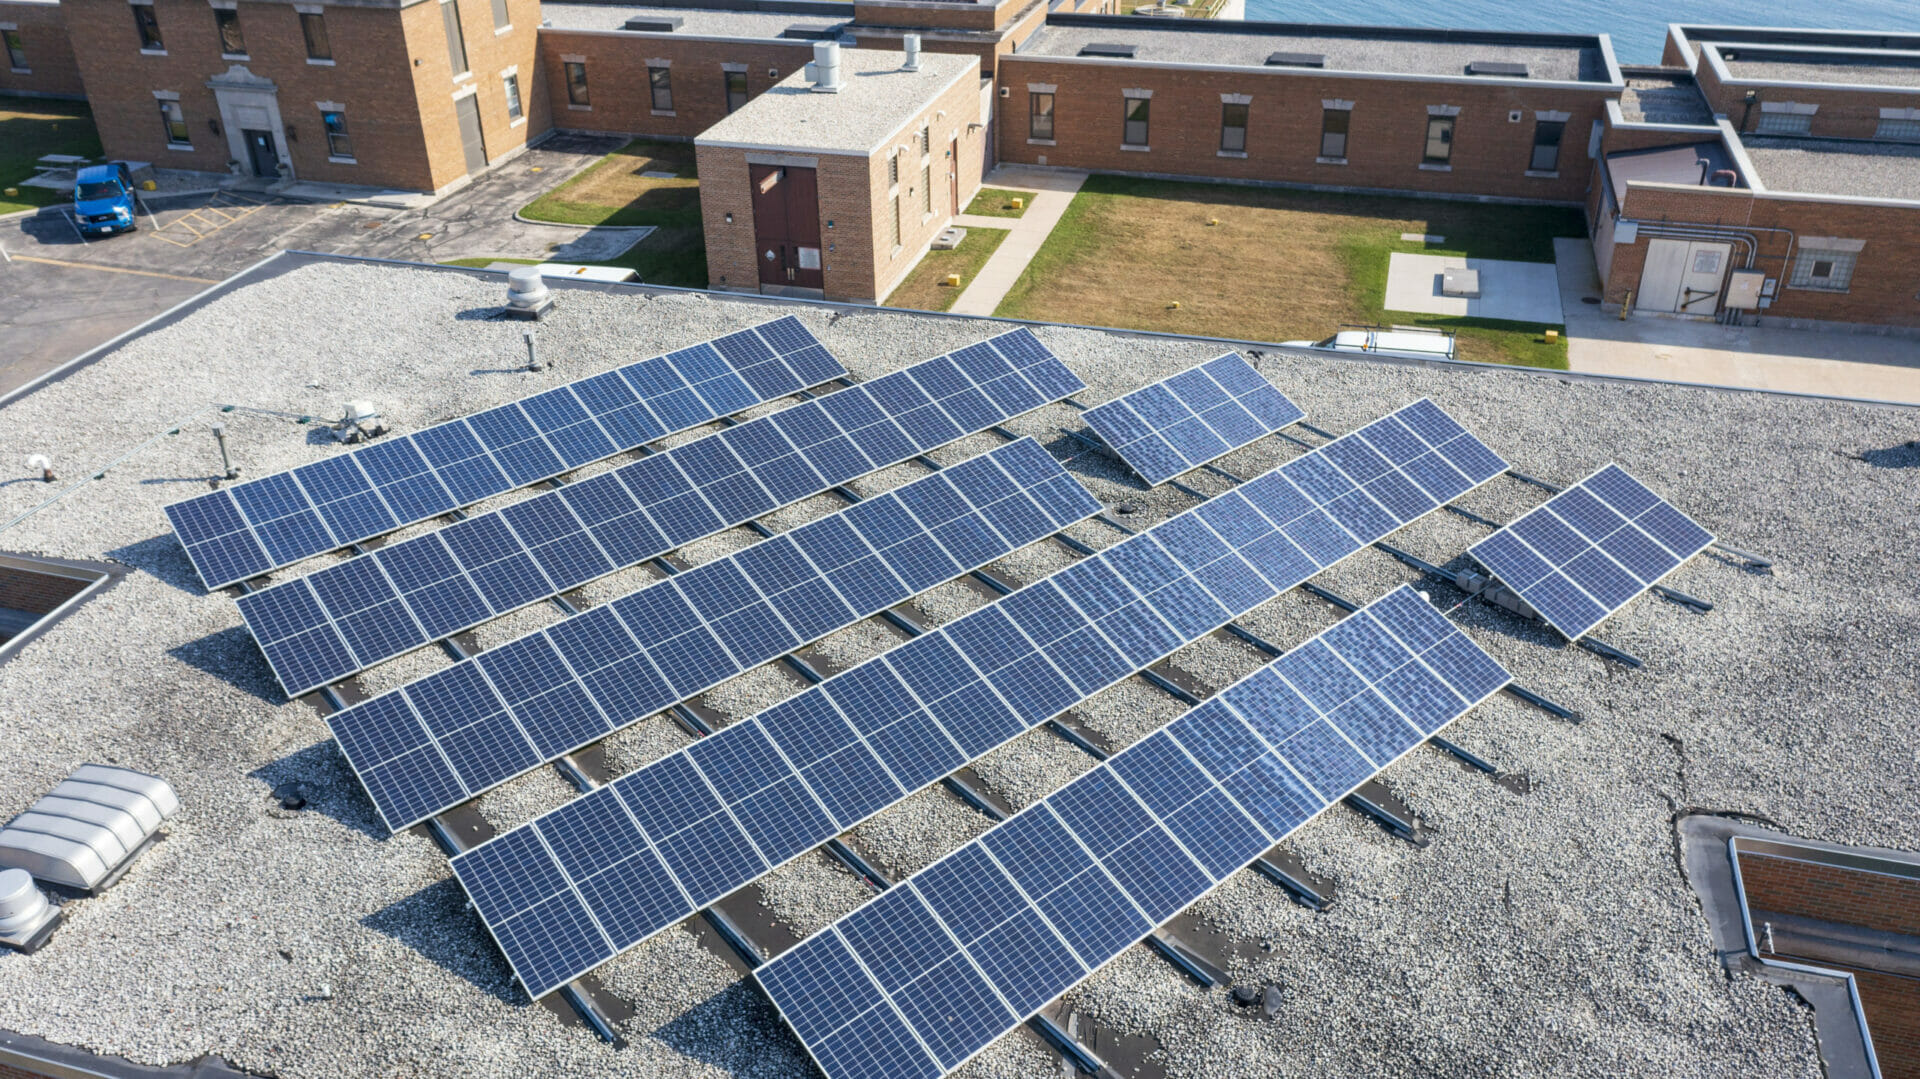
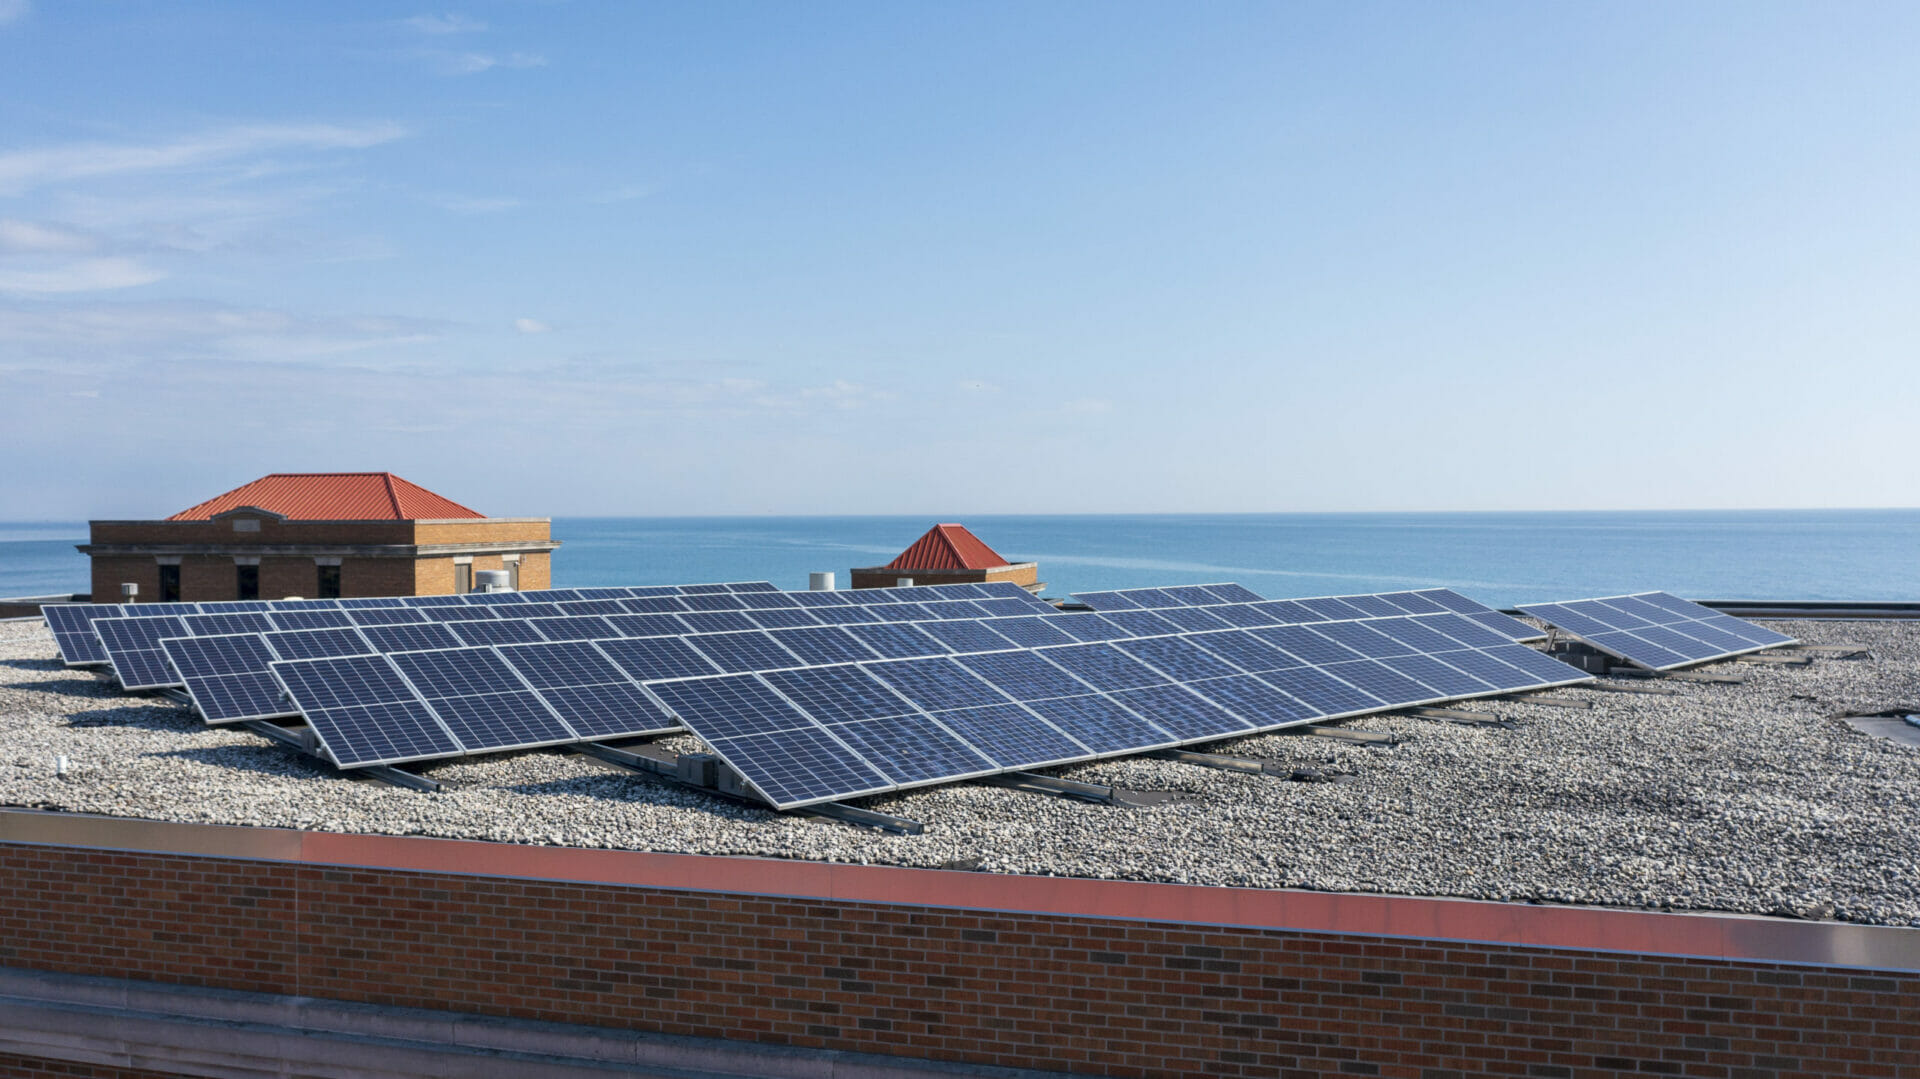
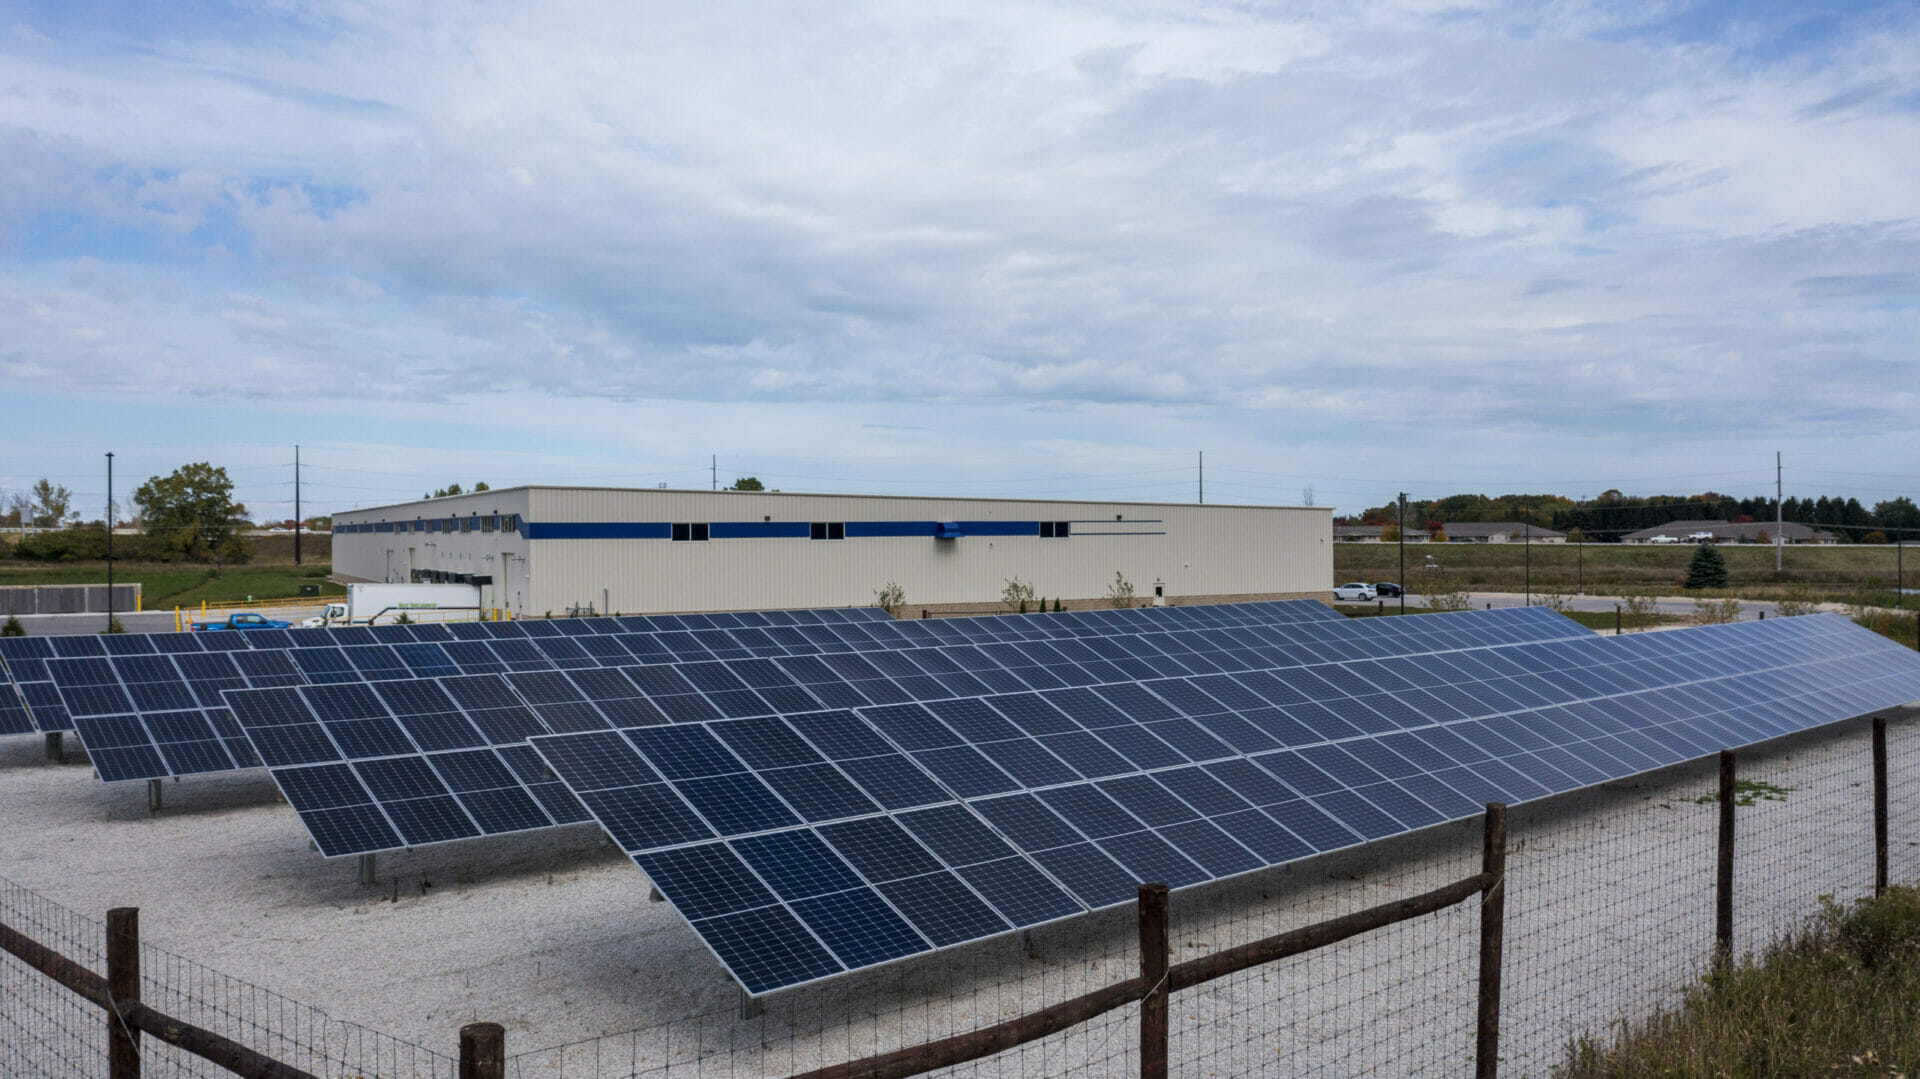
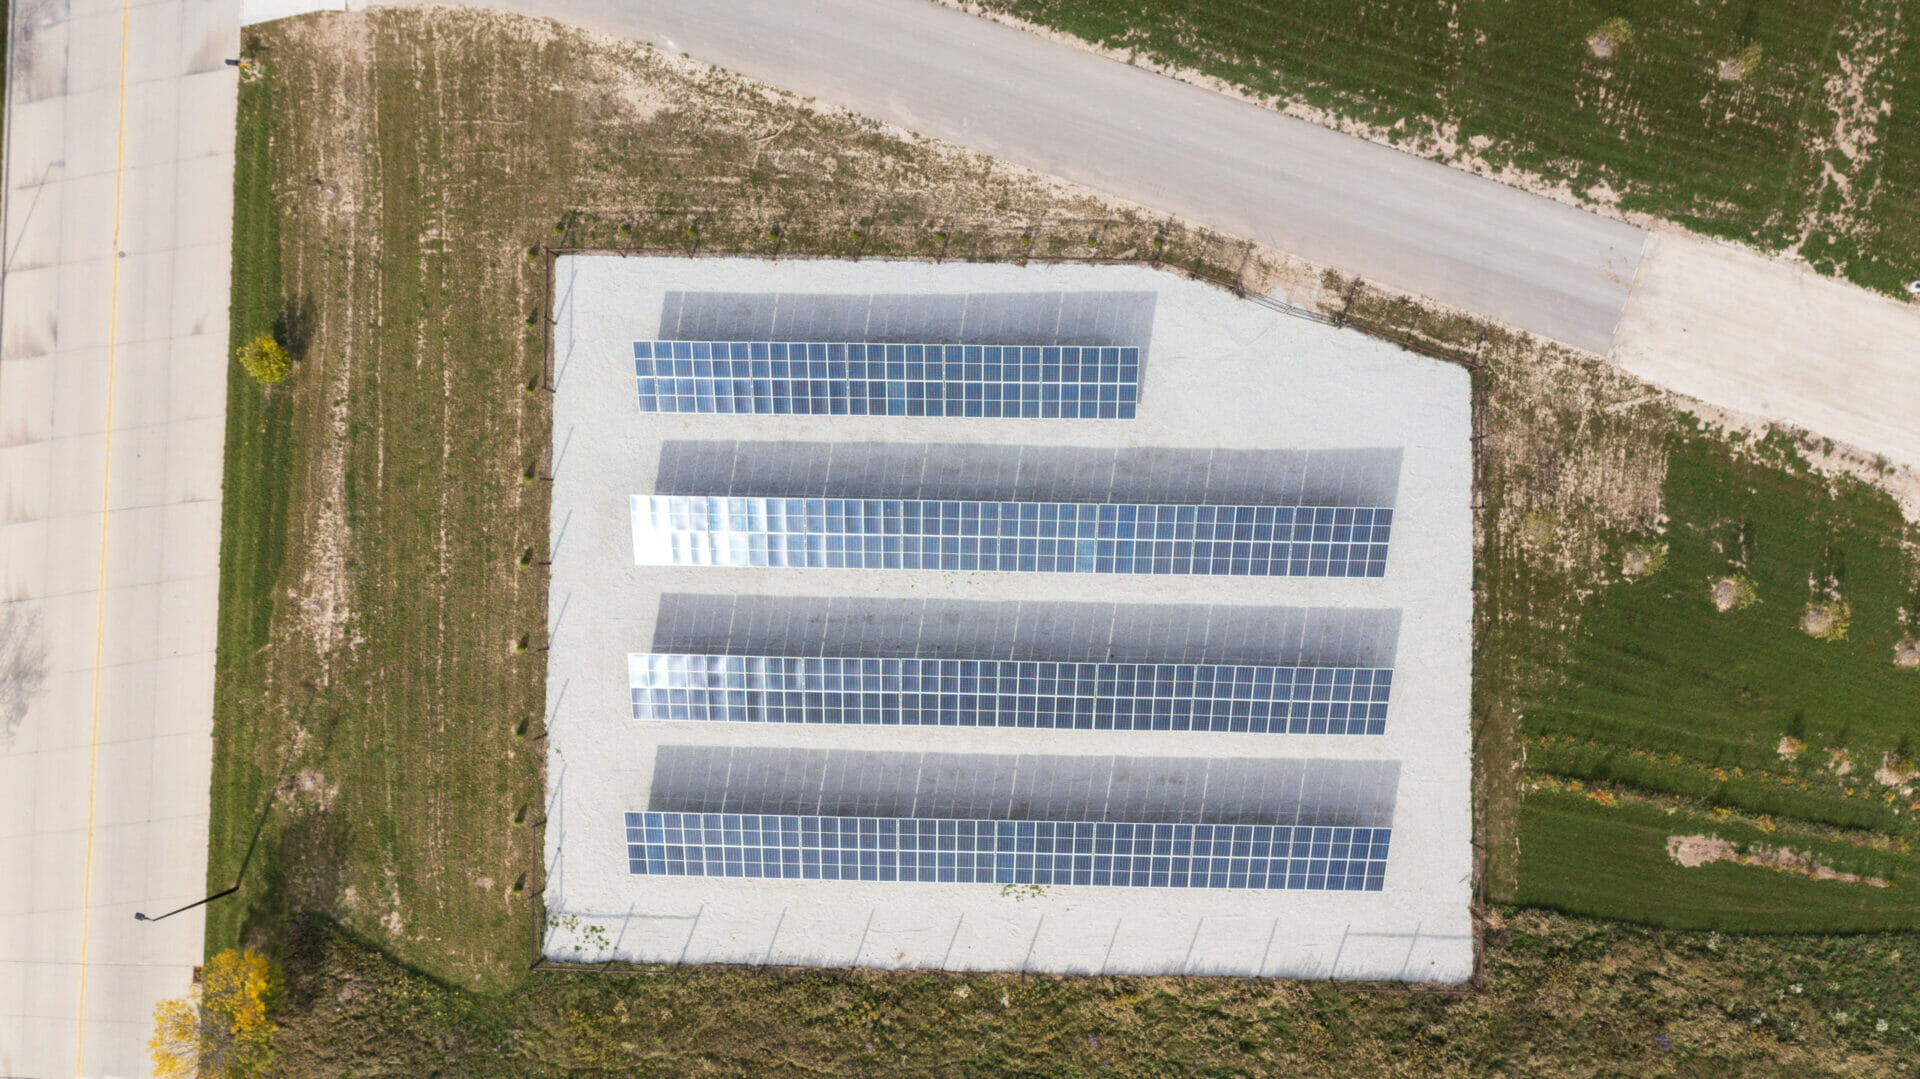
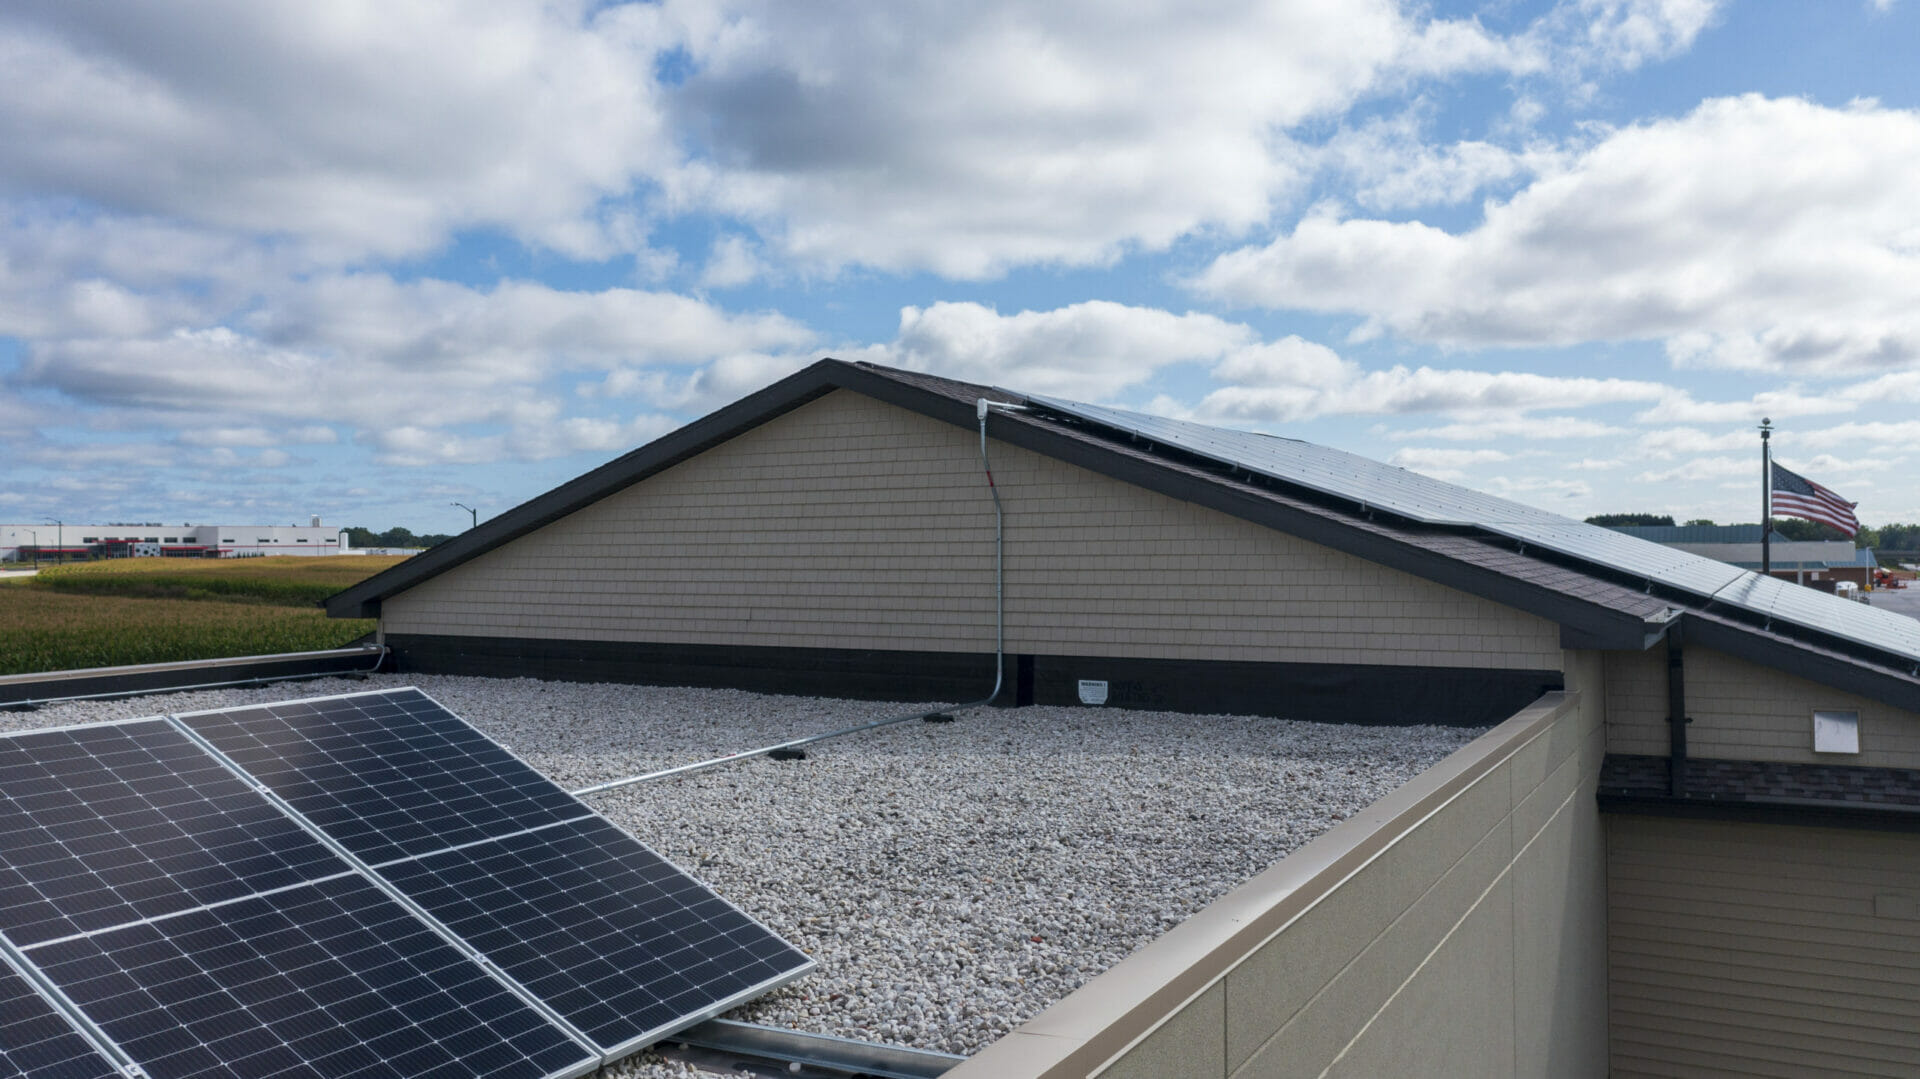
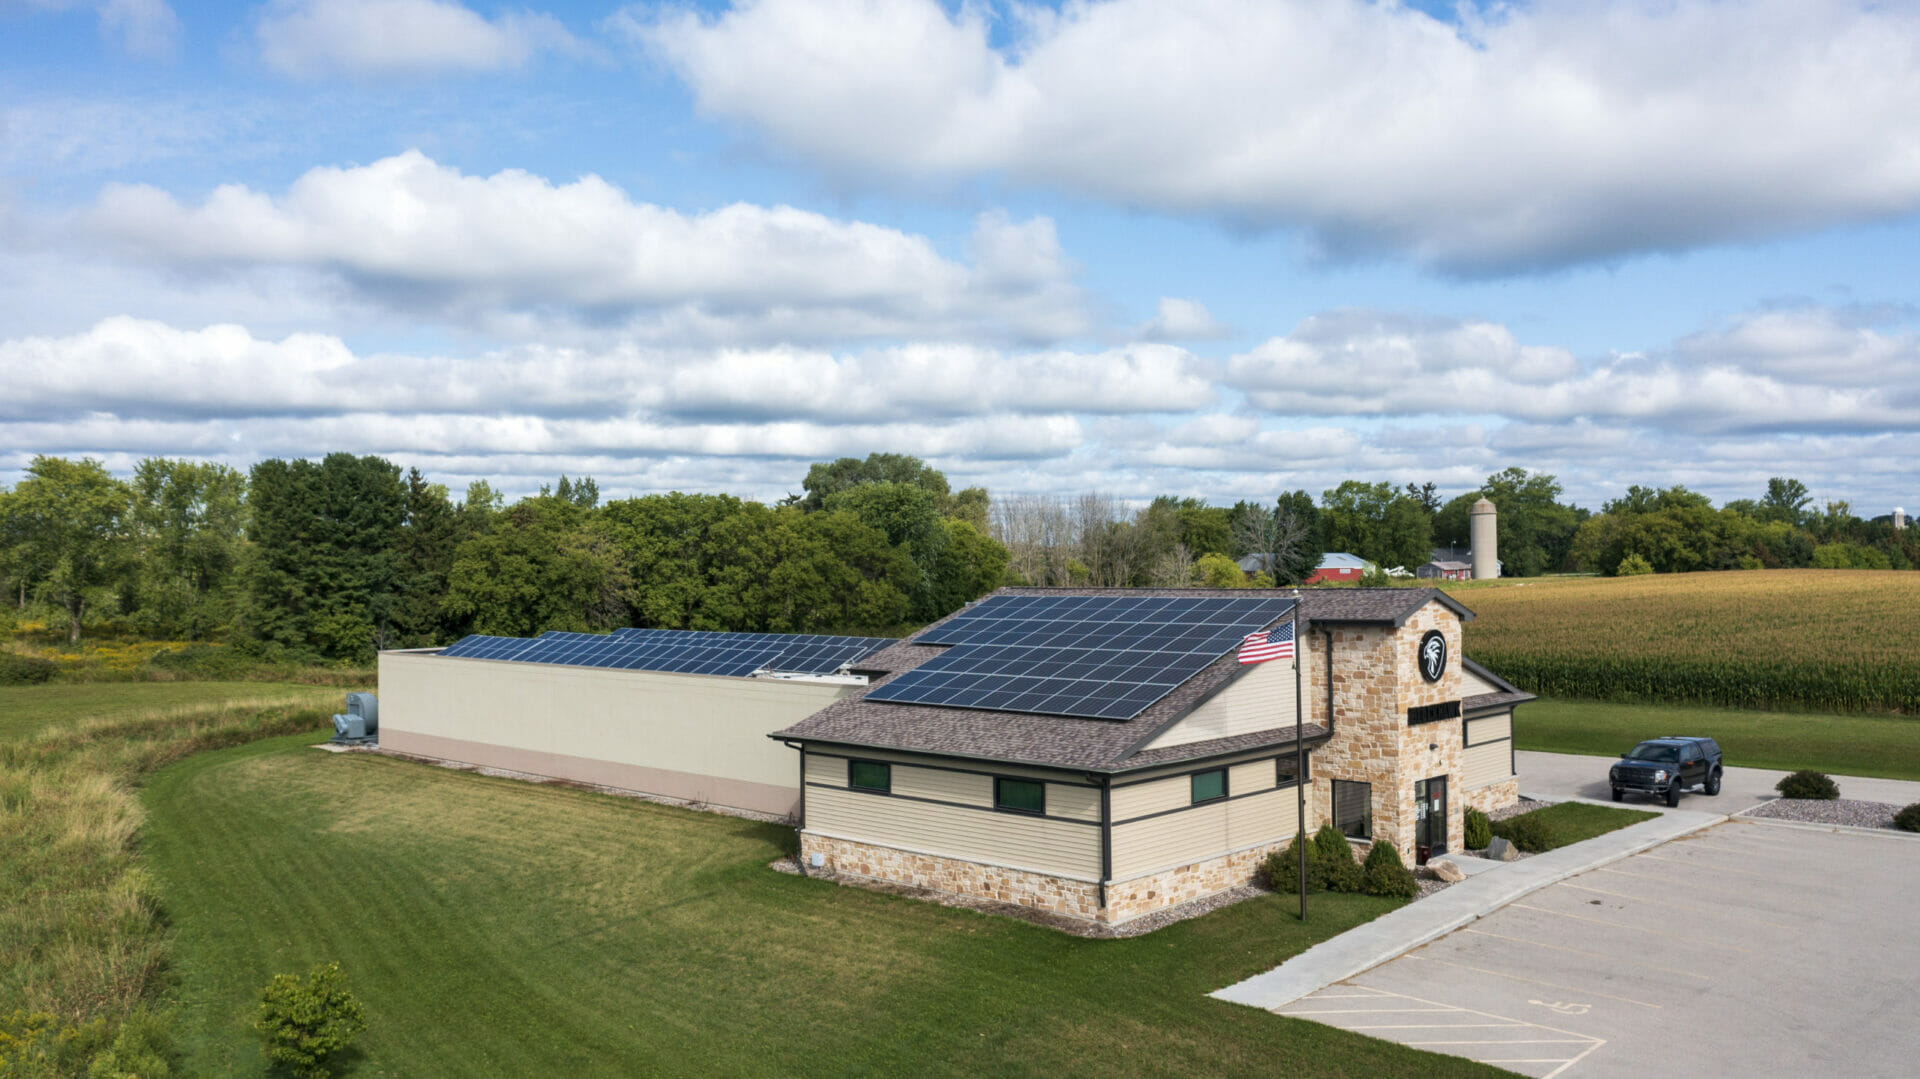
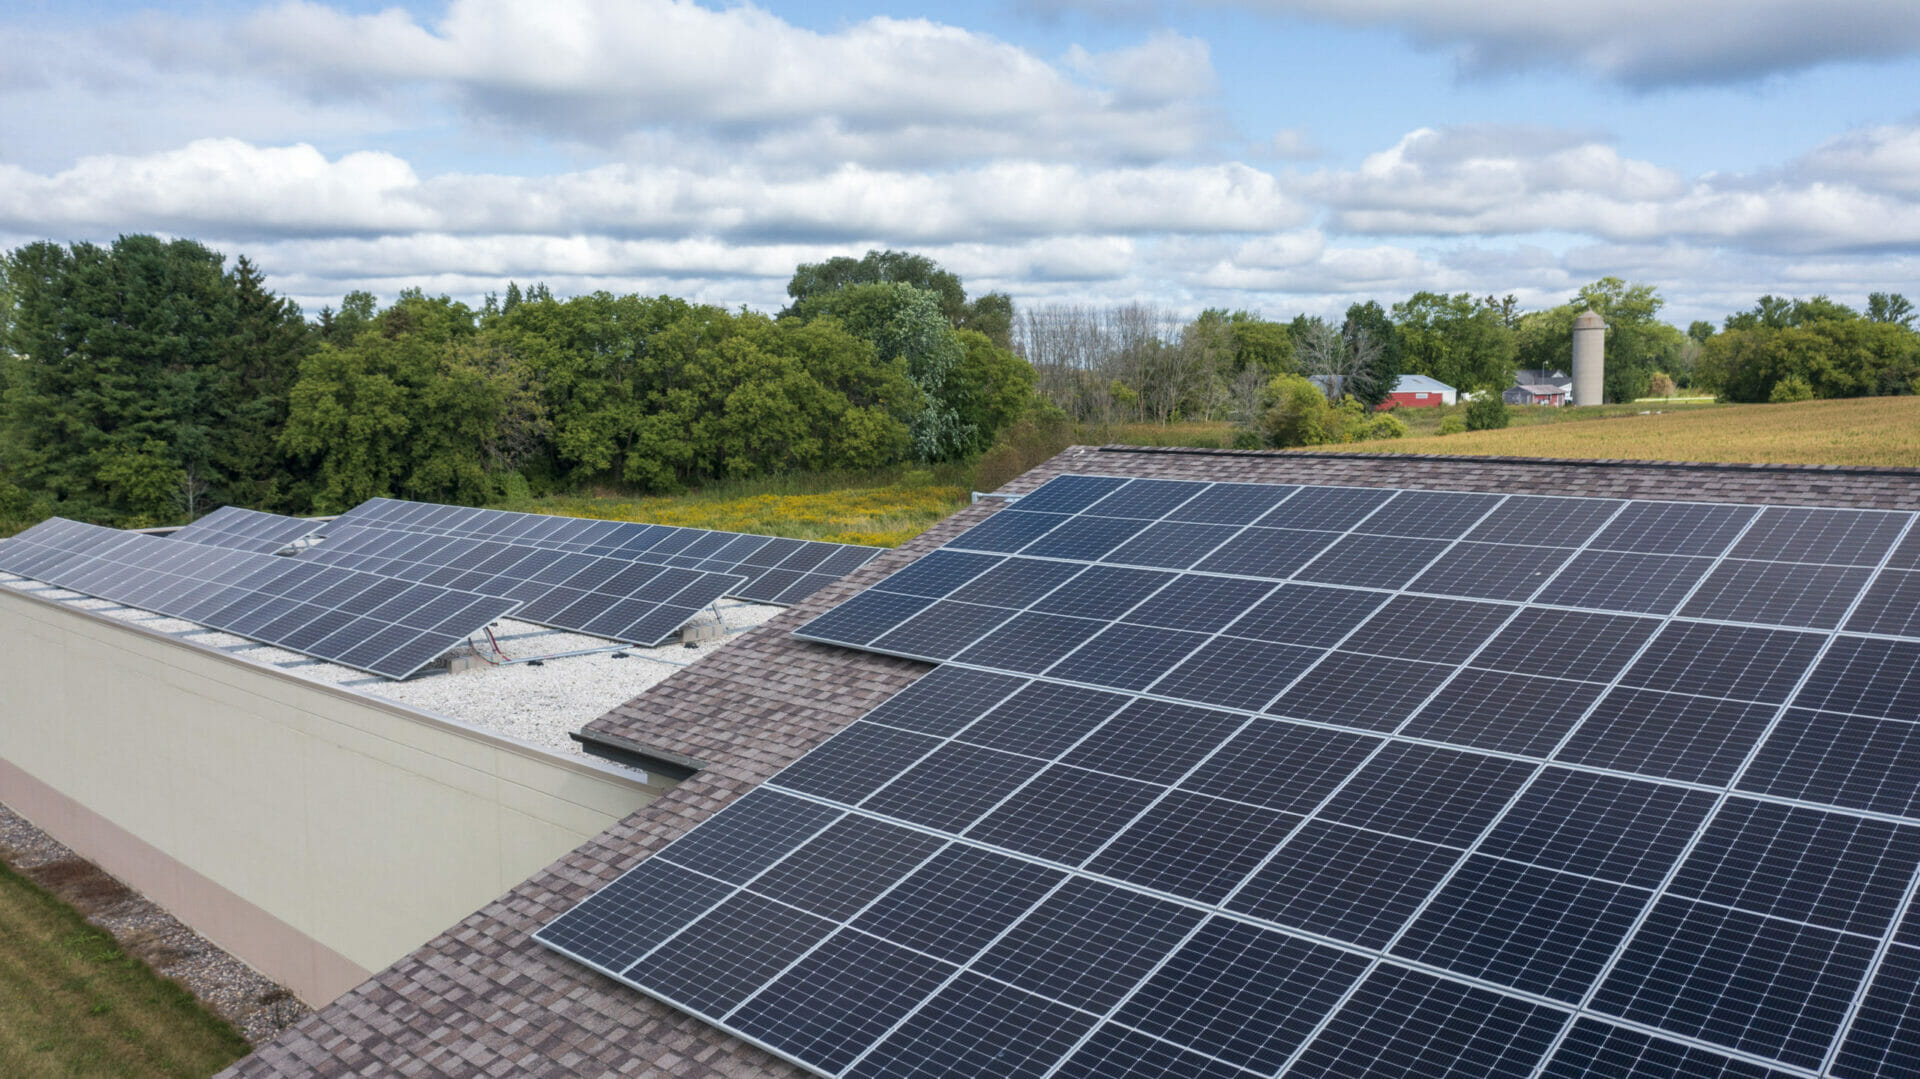
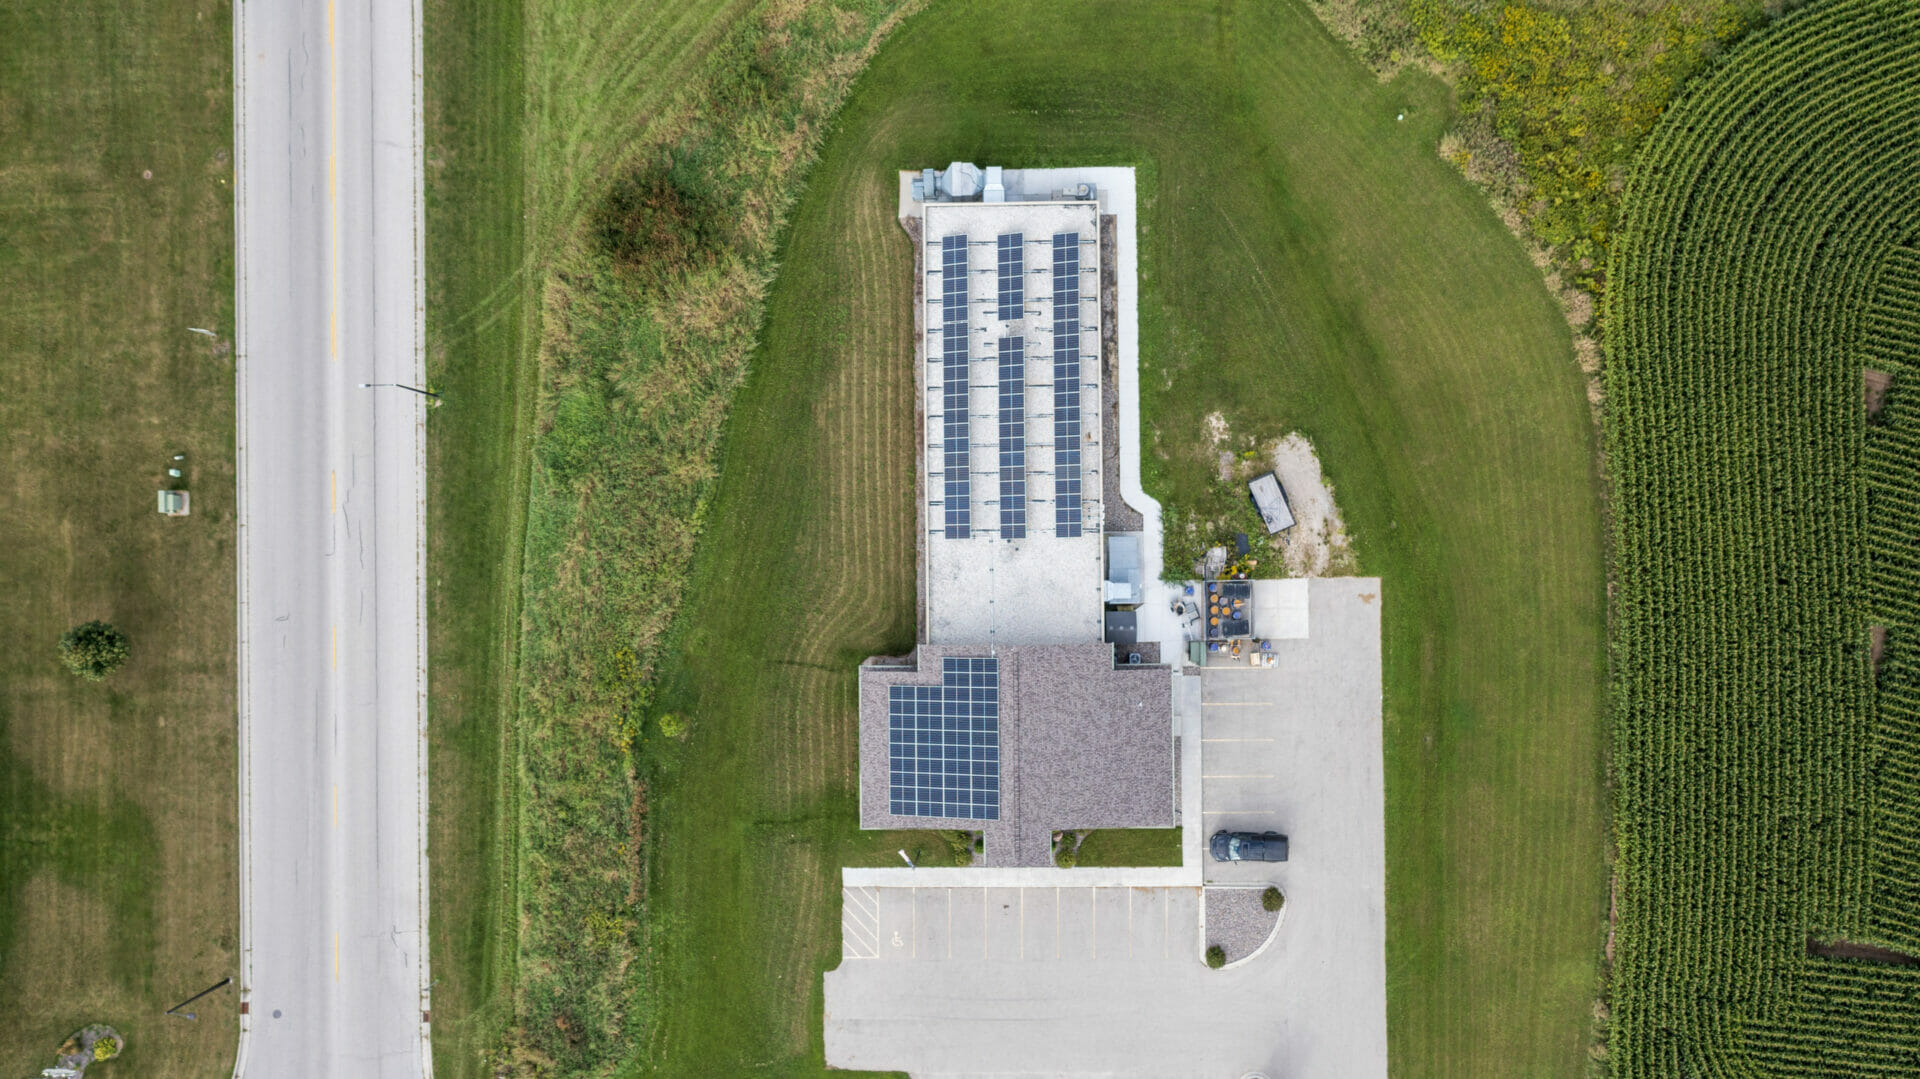
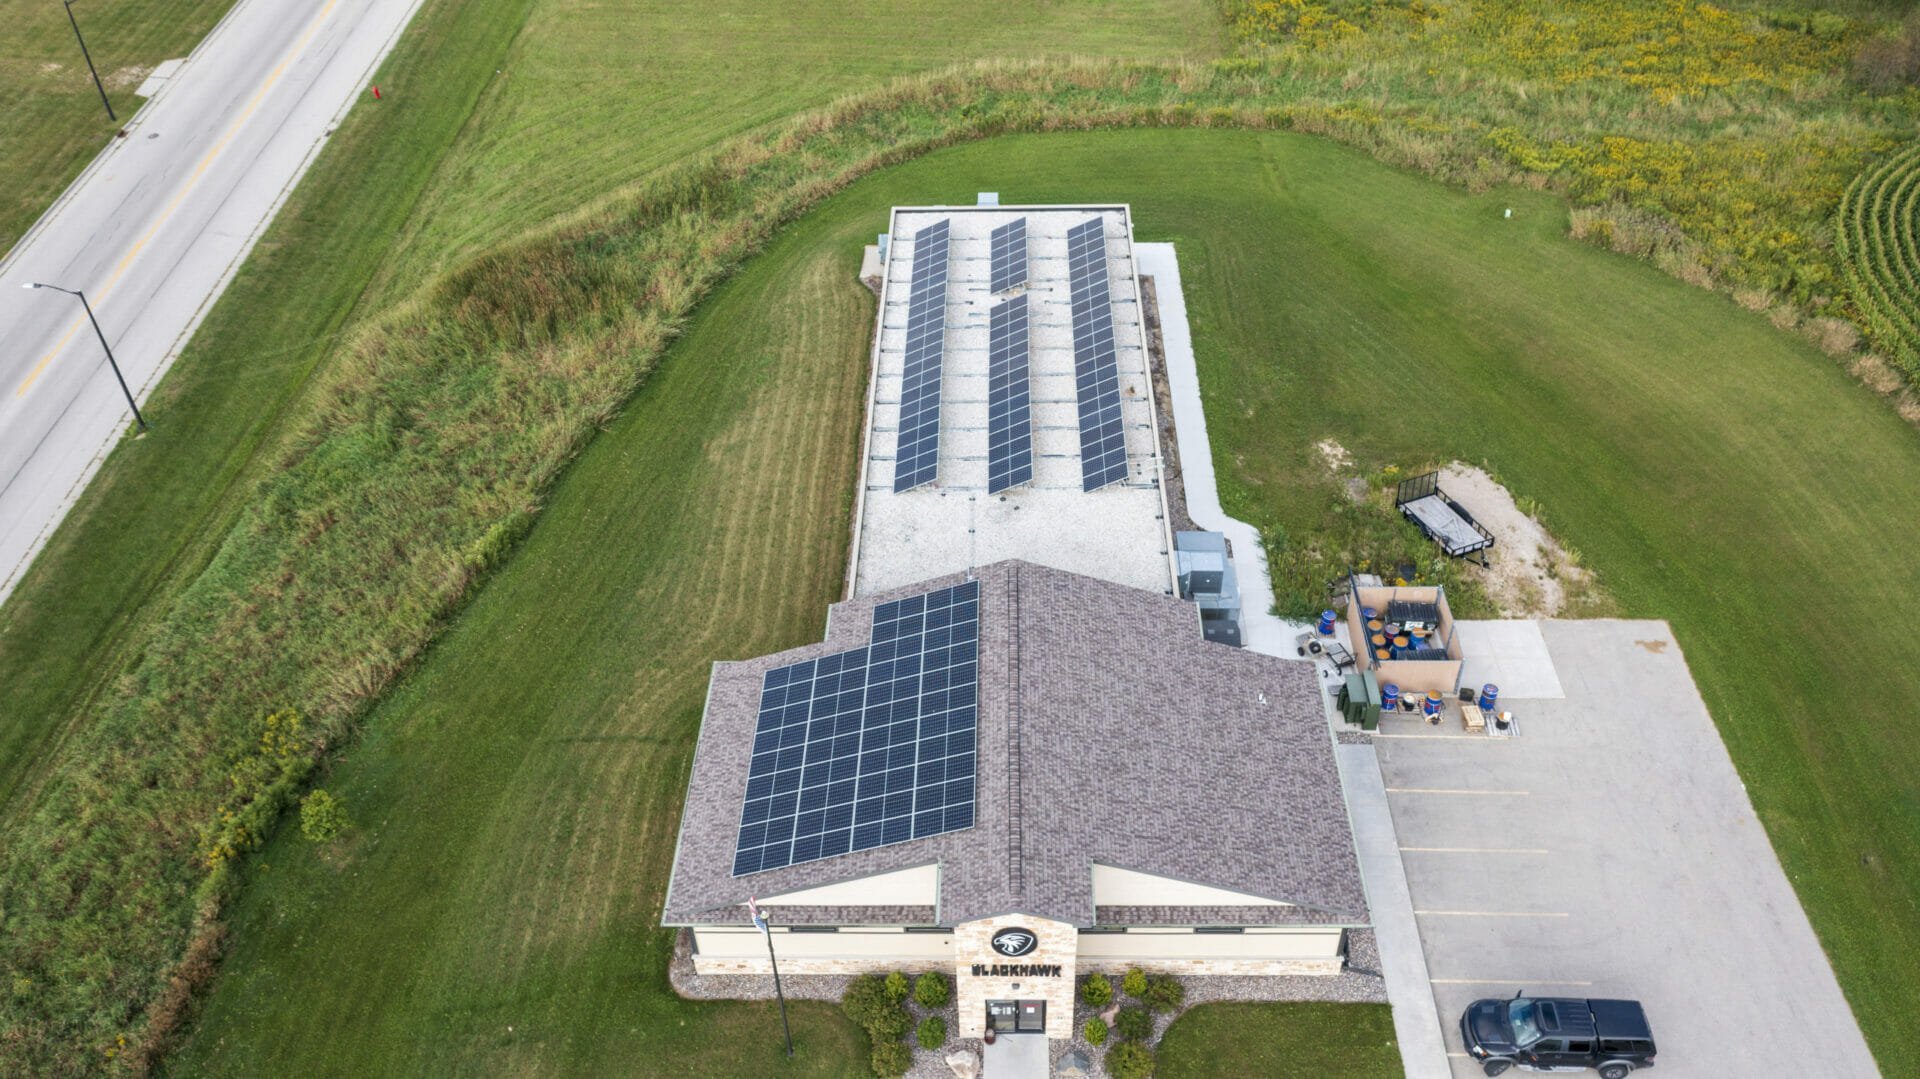
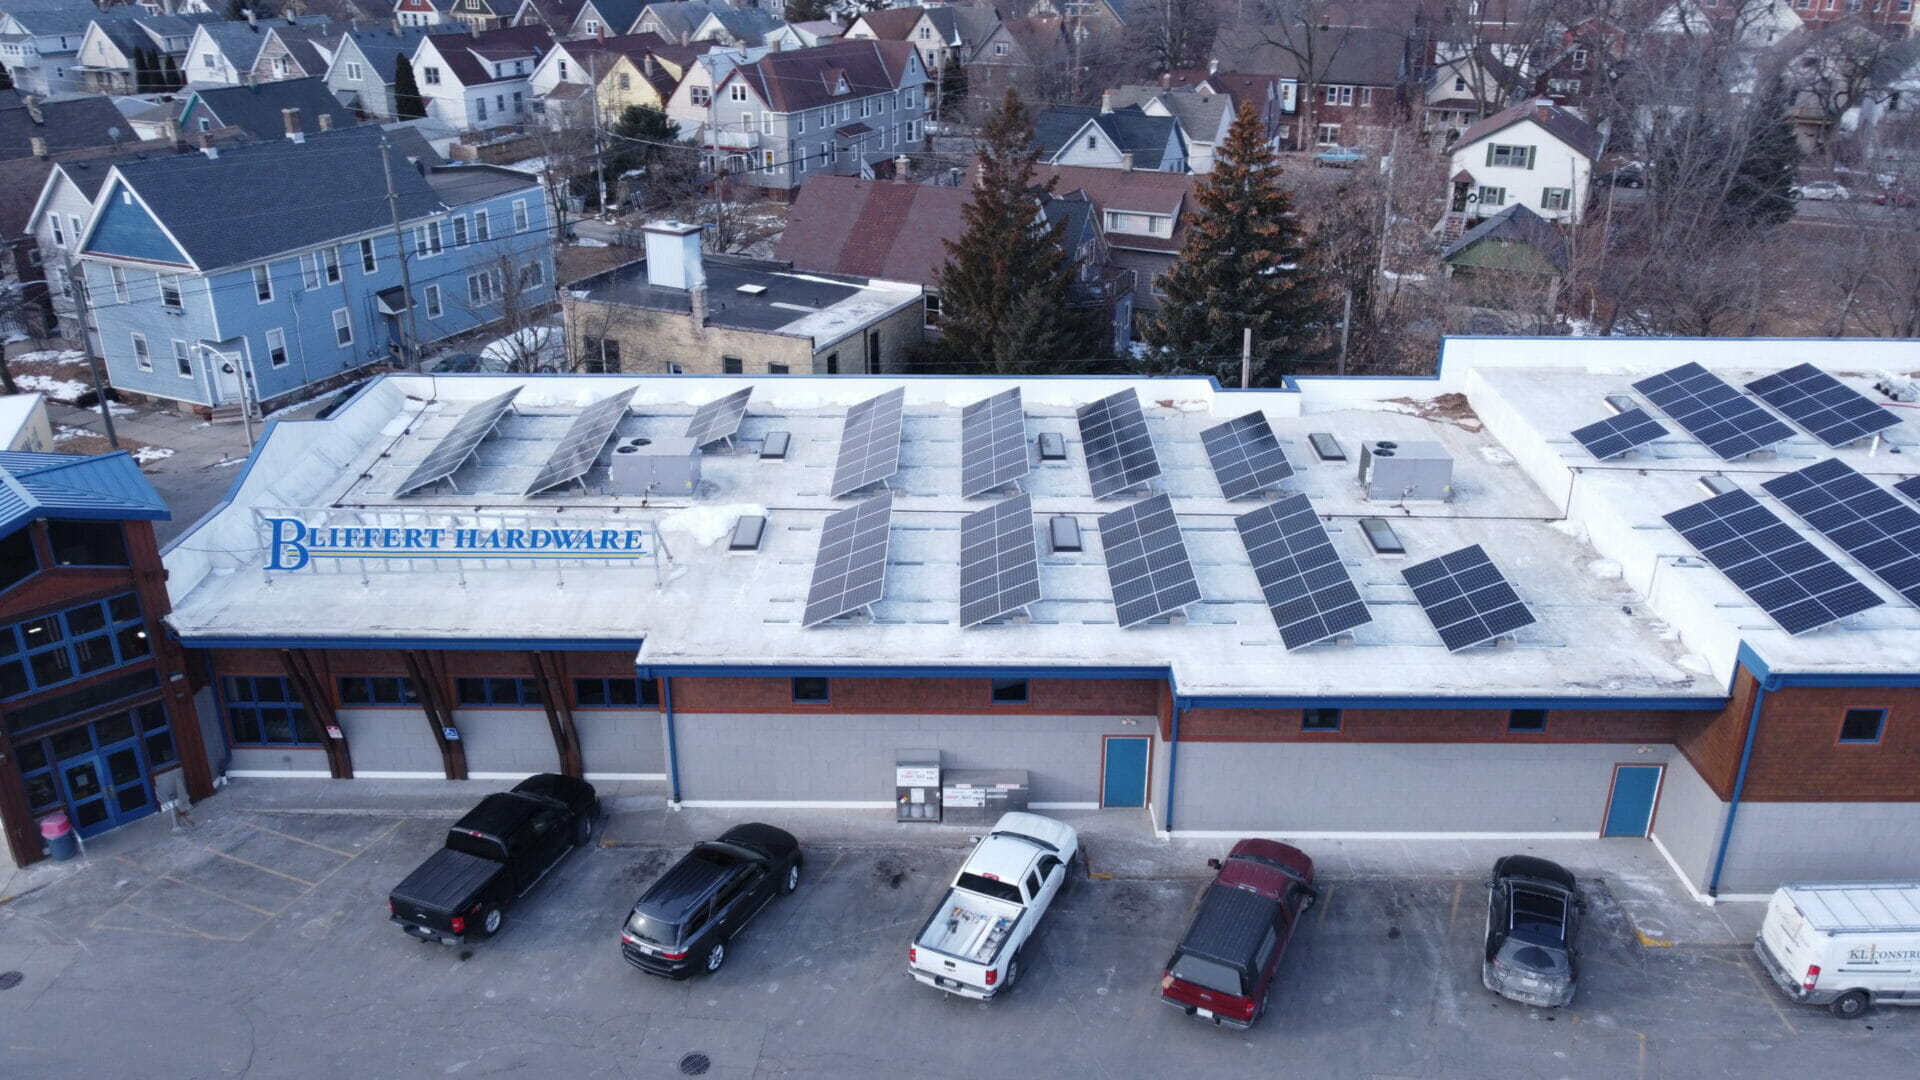
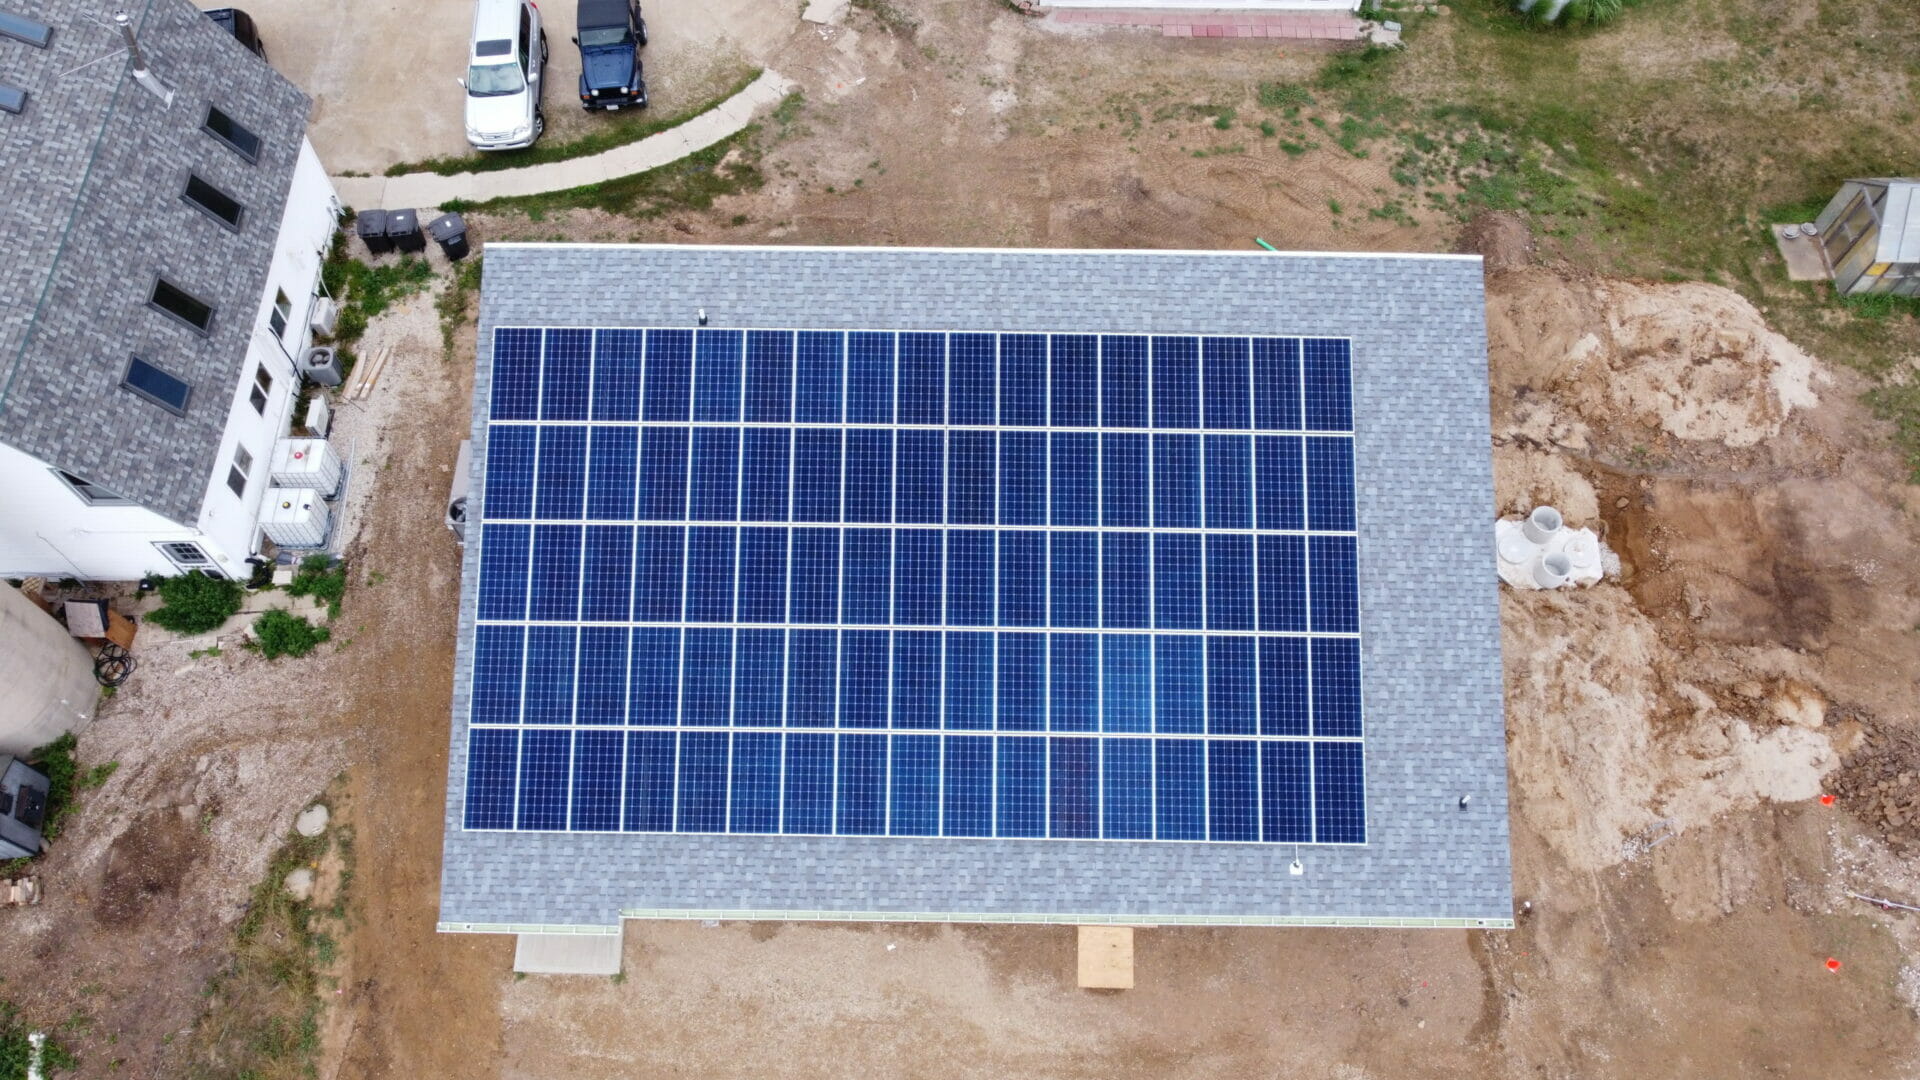
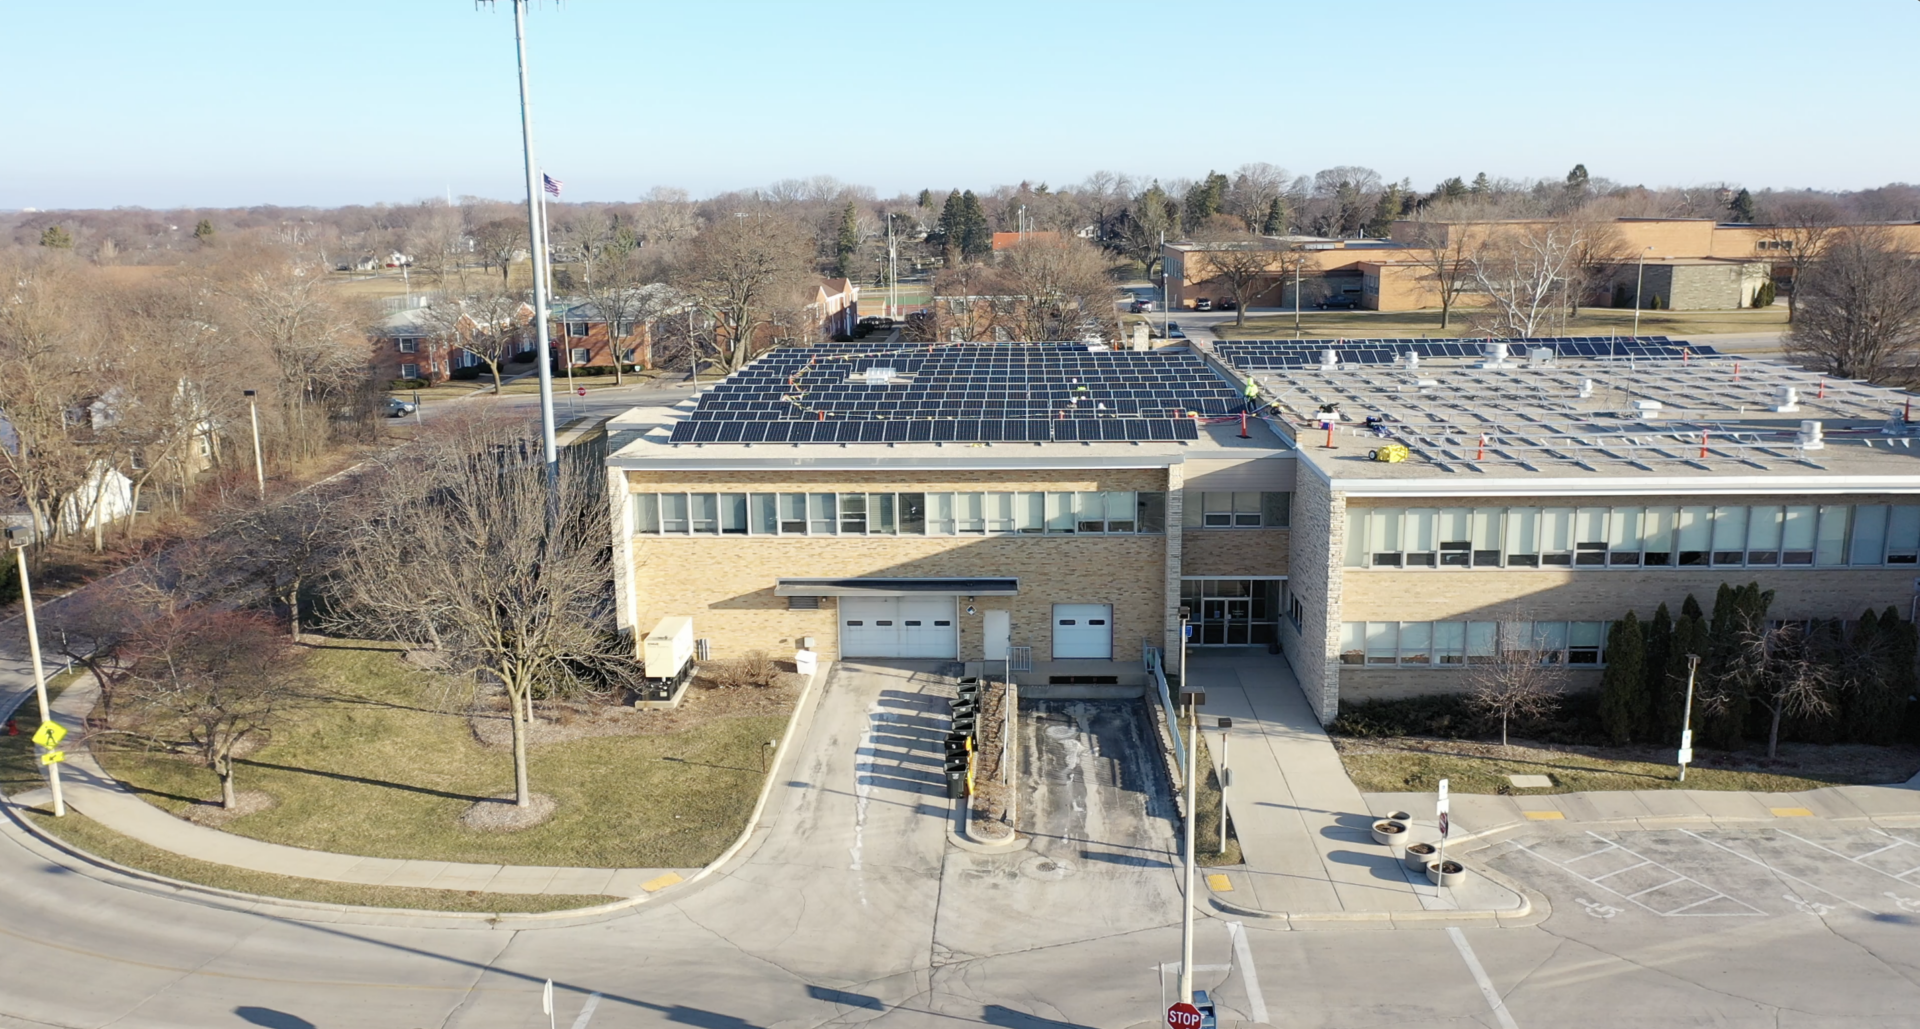
An example of a solar system on energy-only rates is Milwaukee Community Sailing Center.
With a barrel roof, Arch designed the system to maximize energy production complements the Center’s existing geothermal infrastructure

Aerial image of Milwaukee Community Sailing Center’s solar array.
Time of Use (TOU) Rates and Demand Charges
Time-of-use (TOU) rate programs charge different electricity prices depending on the time of day. Electricity used during peak demand periods costs more, while off-peak electricity is billed at a lower rate.
This structure creates an additional advantage for solar energy because peak solar production typically occurs during daytime hours, when electricity prices are often highest. By generating power during these premium-rate periods, businesses can offset some of the most expensive energy on their utility bill.
In addition to TOU, larger commercial and industrial facilities are often subject to demand charges in addition to standard energy charges. Demand charges are based on the highest amount of power a facility uses during a short interval—typically 15 minutes—within a billing period.
Many Wisconsin utilities use multiple demand components. For example, some tariffs include an On-Peak Demand charge, which measures a customer’s highest demand during designated peak hours, along with a Non-Coincident (NC) Maximum Demand charge, which is based on the facility’s highest demand regardless of when it occurs. With On-Peak Demand rates, a facility is monitored and charged for the maximum power draw during an on peak period, usually between 9AM – 9PM. NC Maximum Demand charges are typically based on the highest demand recorded during the current billing period, although some utility tariffs include demand ratchets that use the highest demand over the previous 12 months when calculating charges.
For many Wisconsin manufacturers, warehouses, and large commercial operations, demand charges can account for a substantial portion of monthly utility costs. Equipment startups, HVAC systems, refrigeration equipment, and production machinery can all contribute to demand peaks.
Just one demand spike can significantly impact a utility bill. Solar can help reduce demand charges when a facility’s peak usage occurs during solar production hours. However, facilities with evening or early morning peaks may benefit from combining solar with battery storage to maximize demand savings.

Image of company comparison with a spike in power creating a high demand charge on a utility bill. Credit: Chargepoint
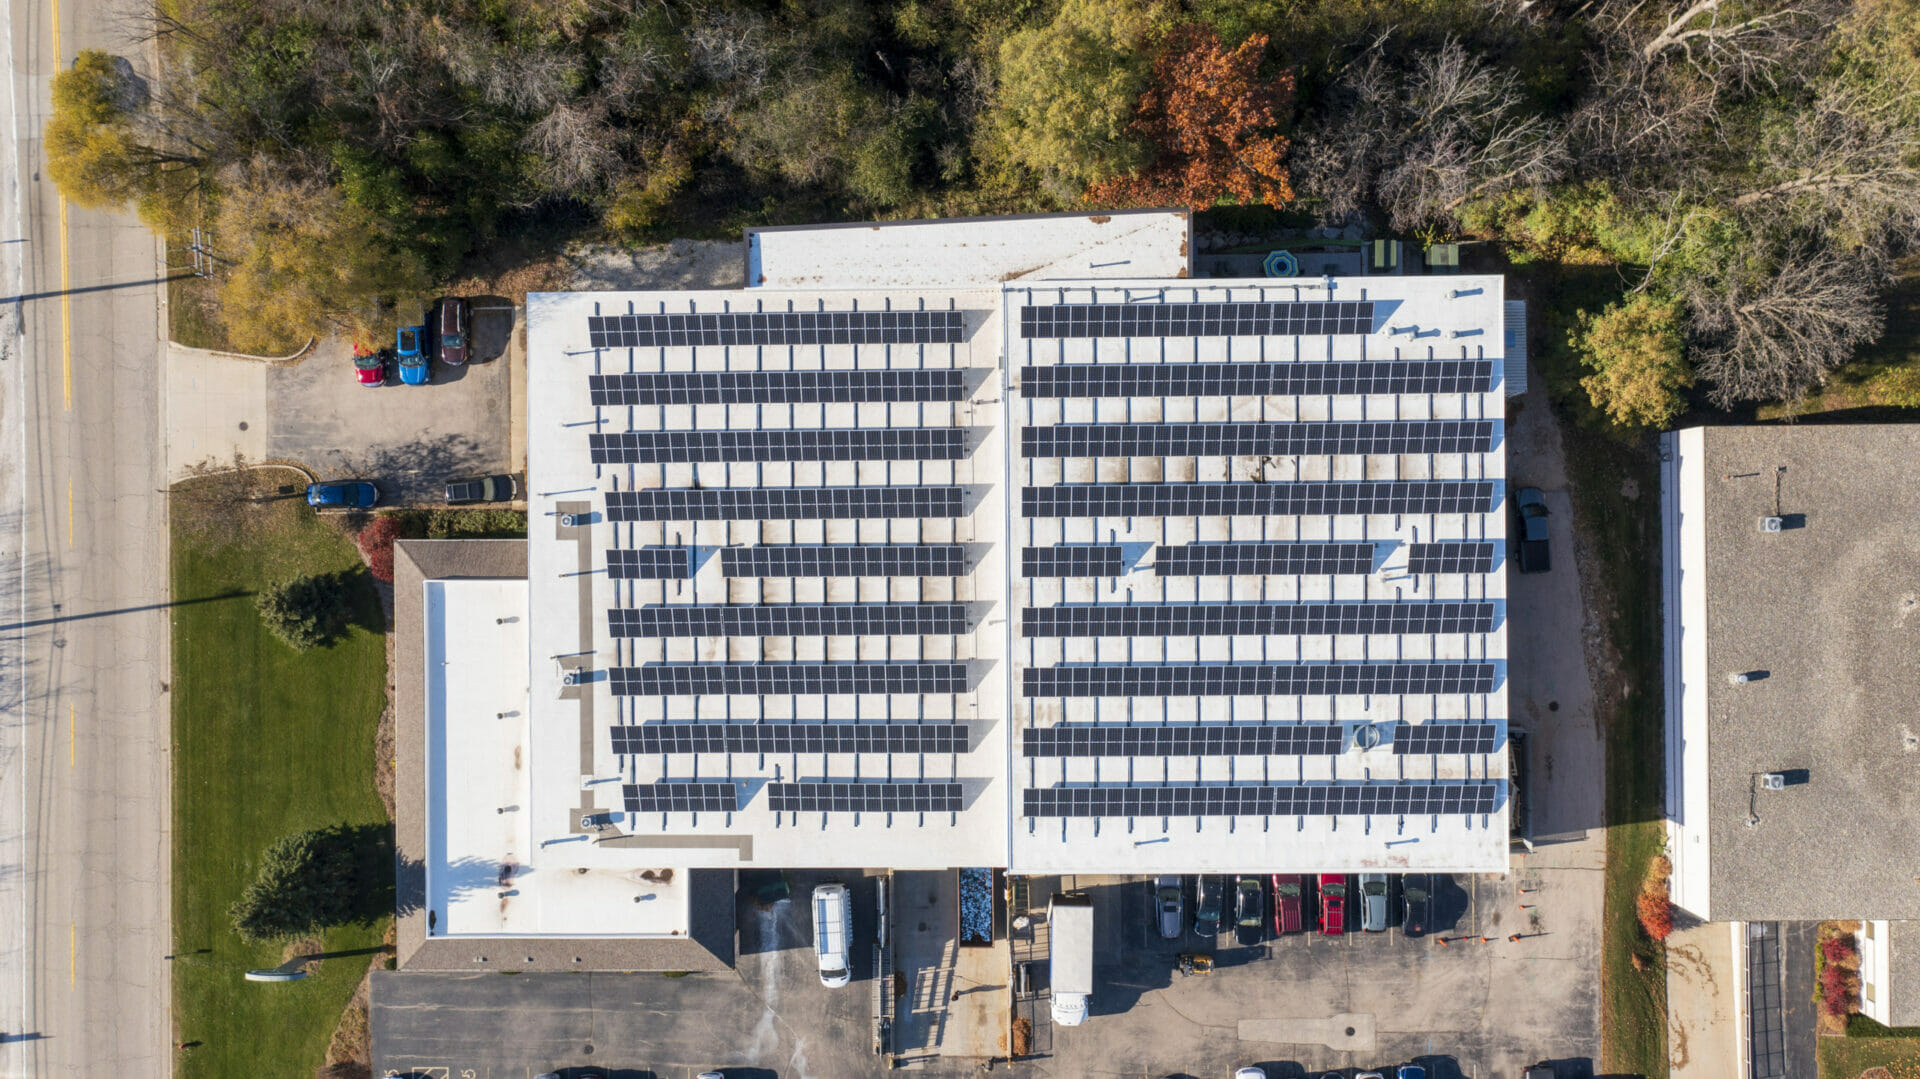
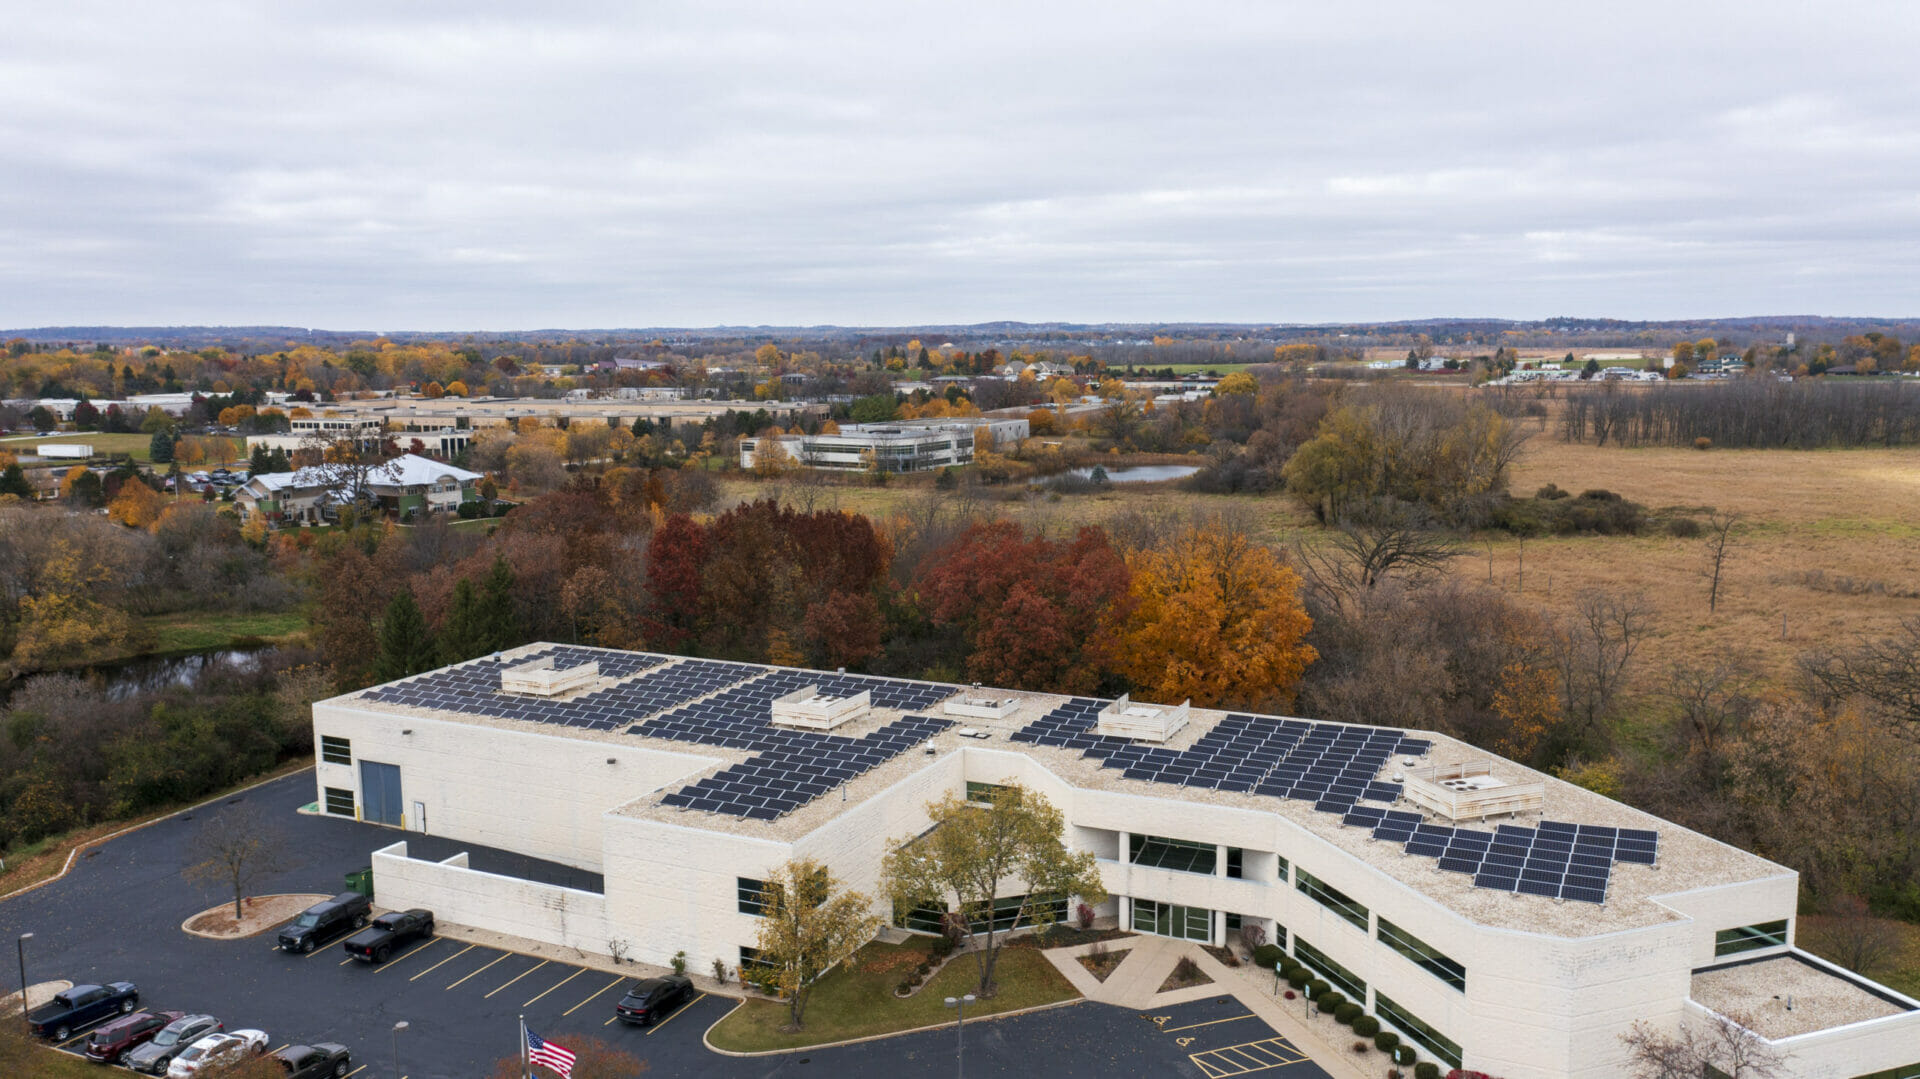
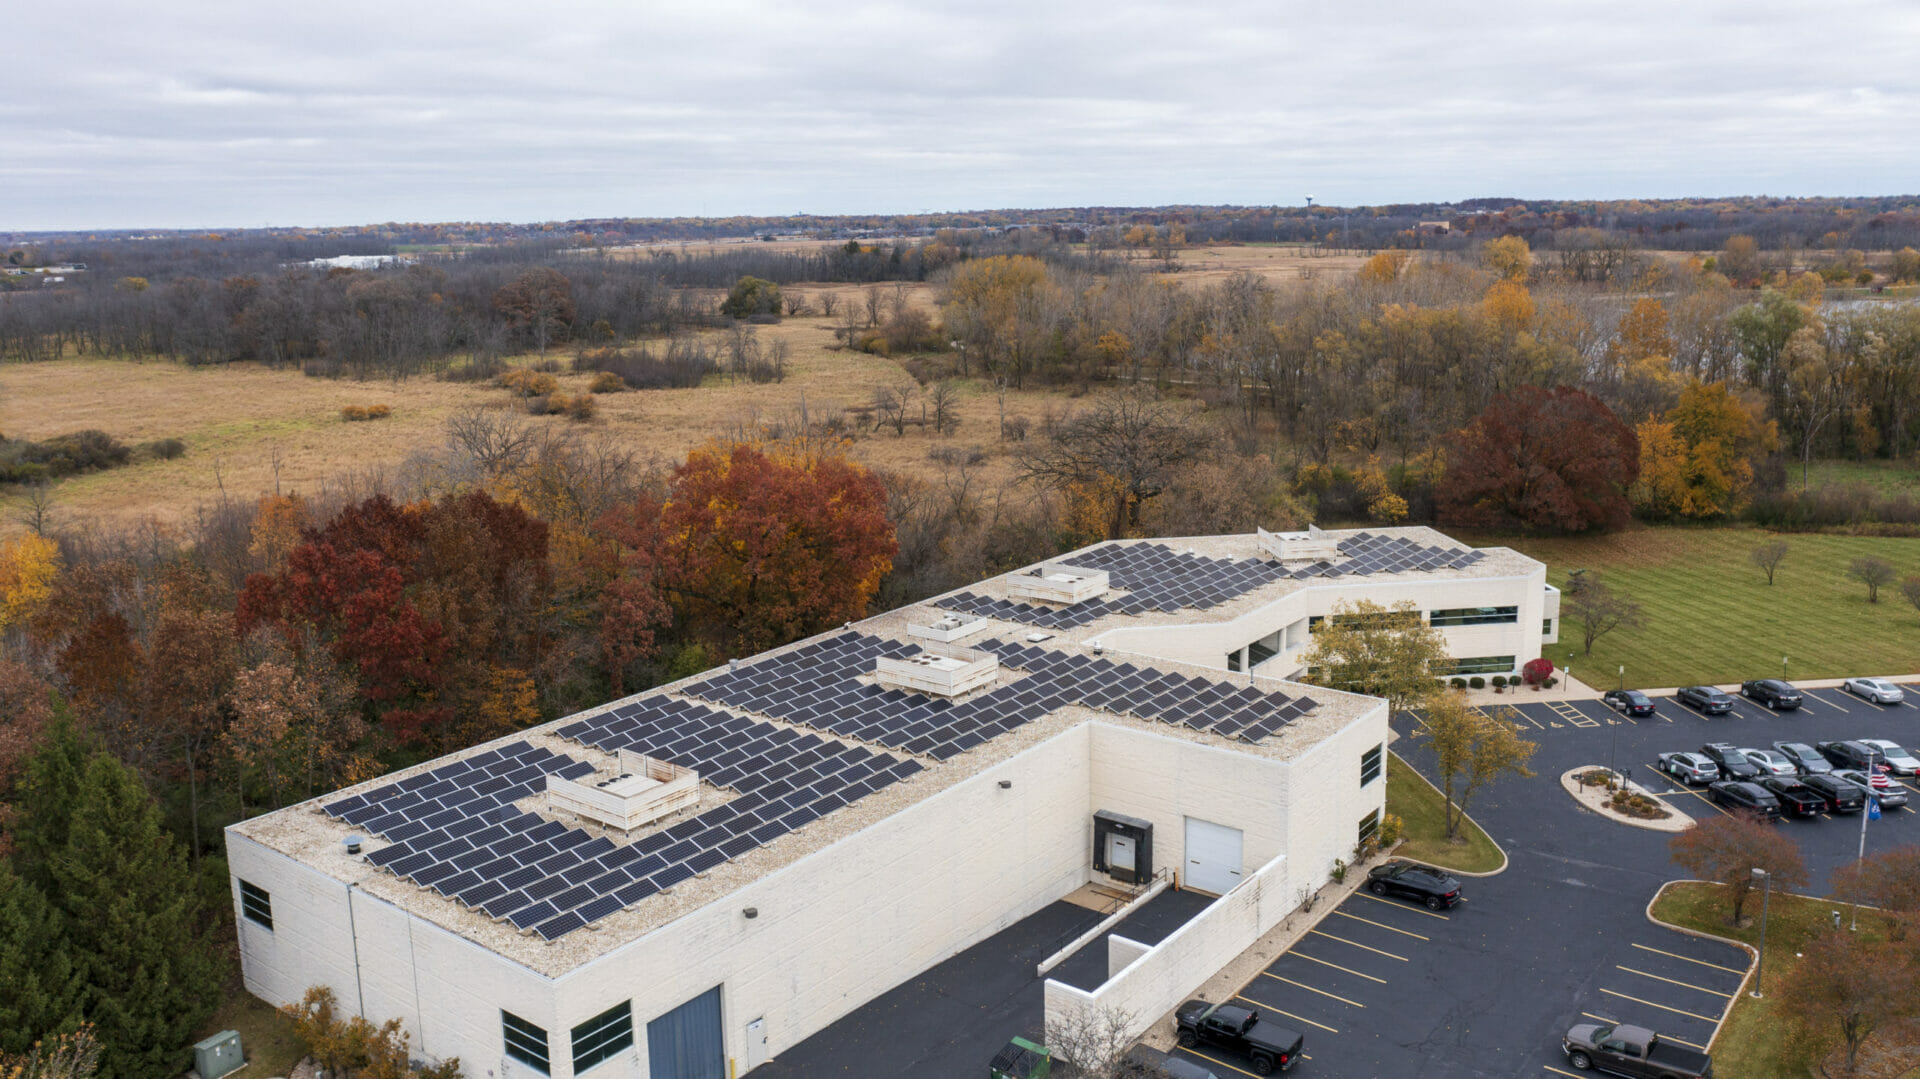
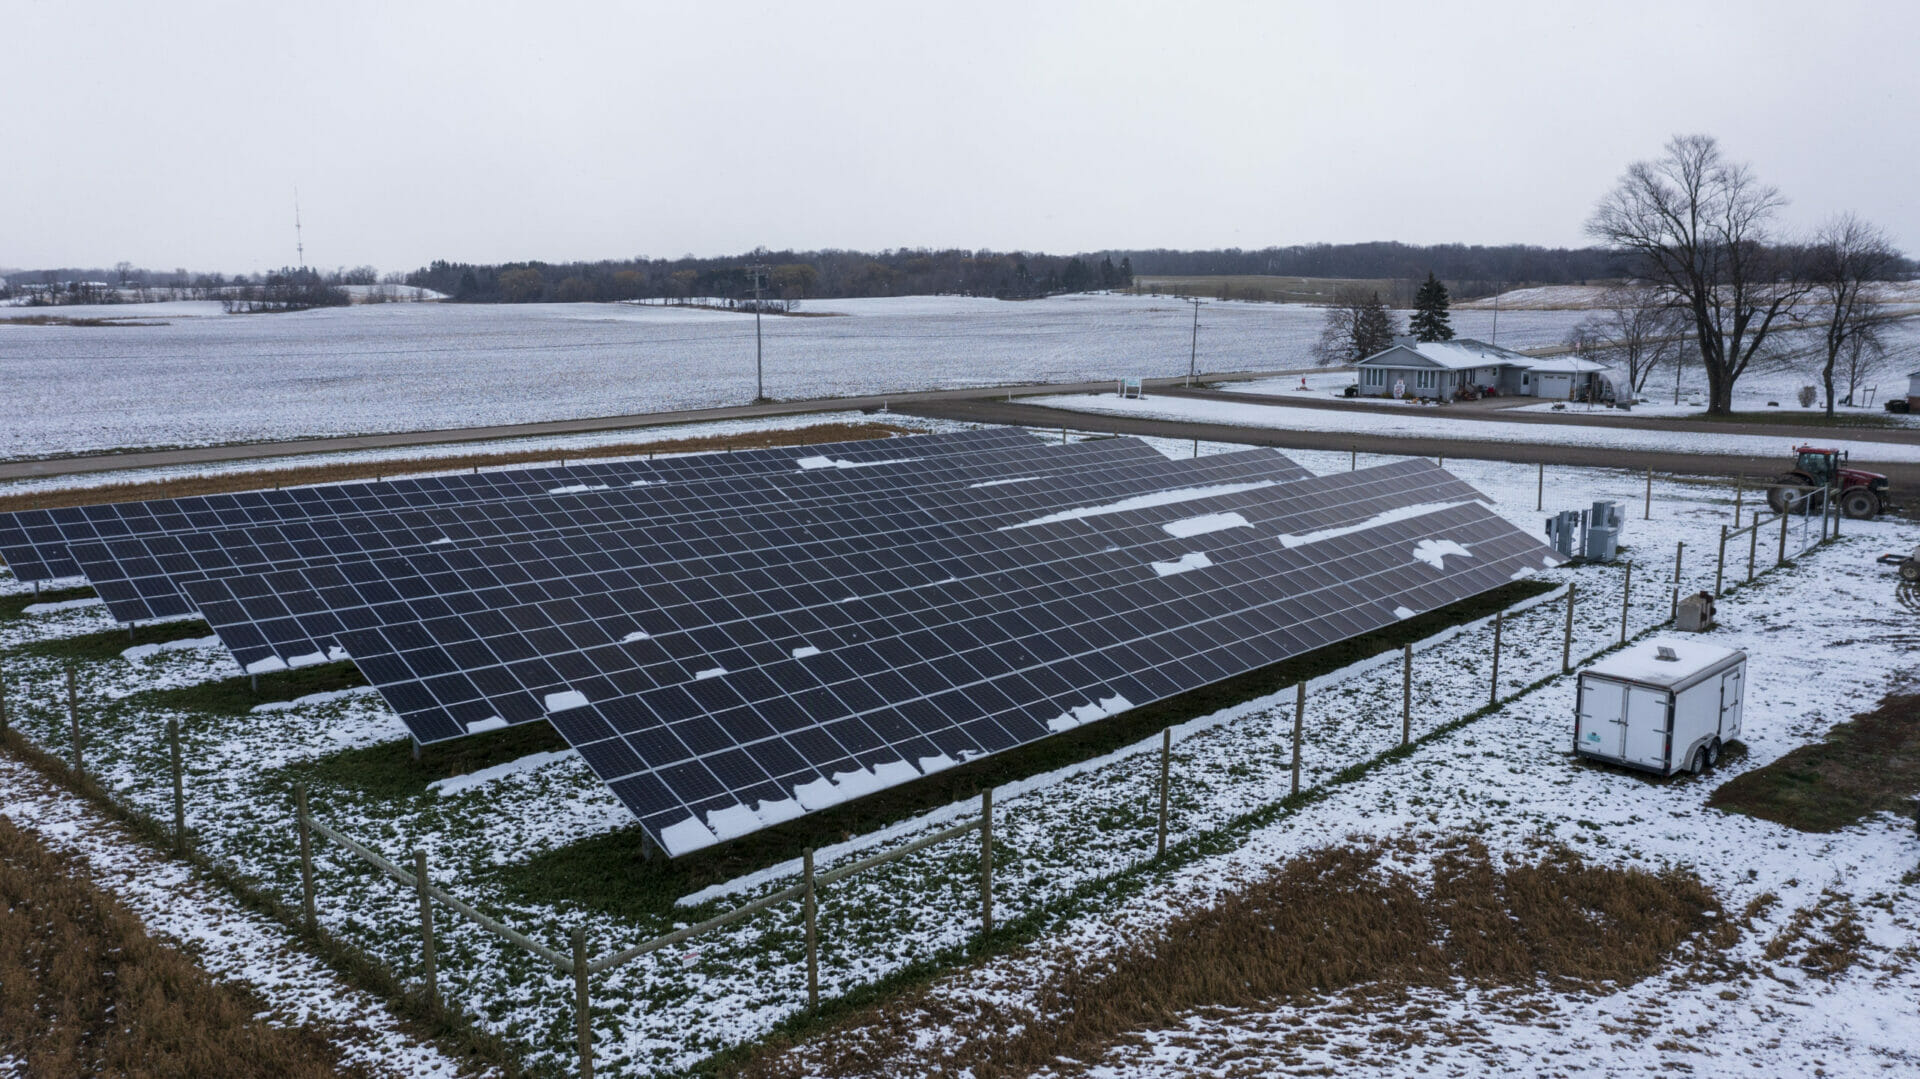
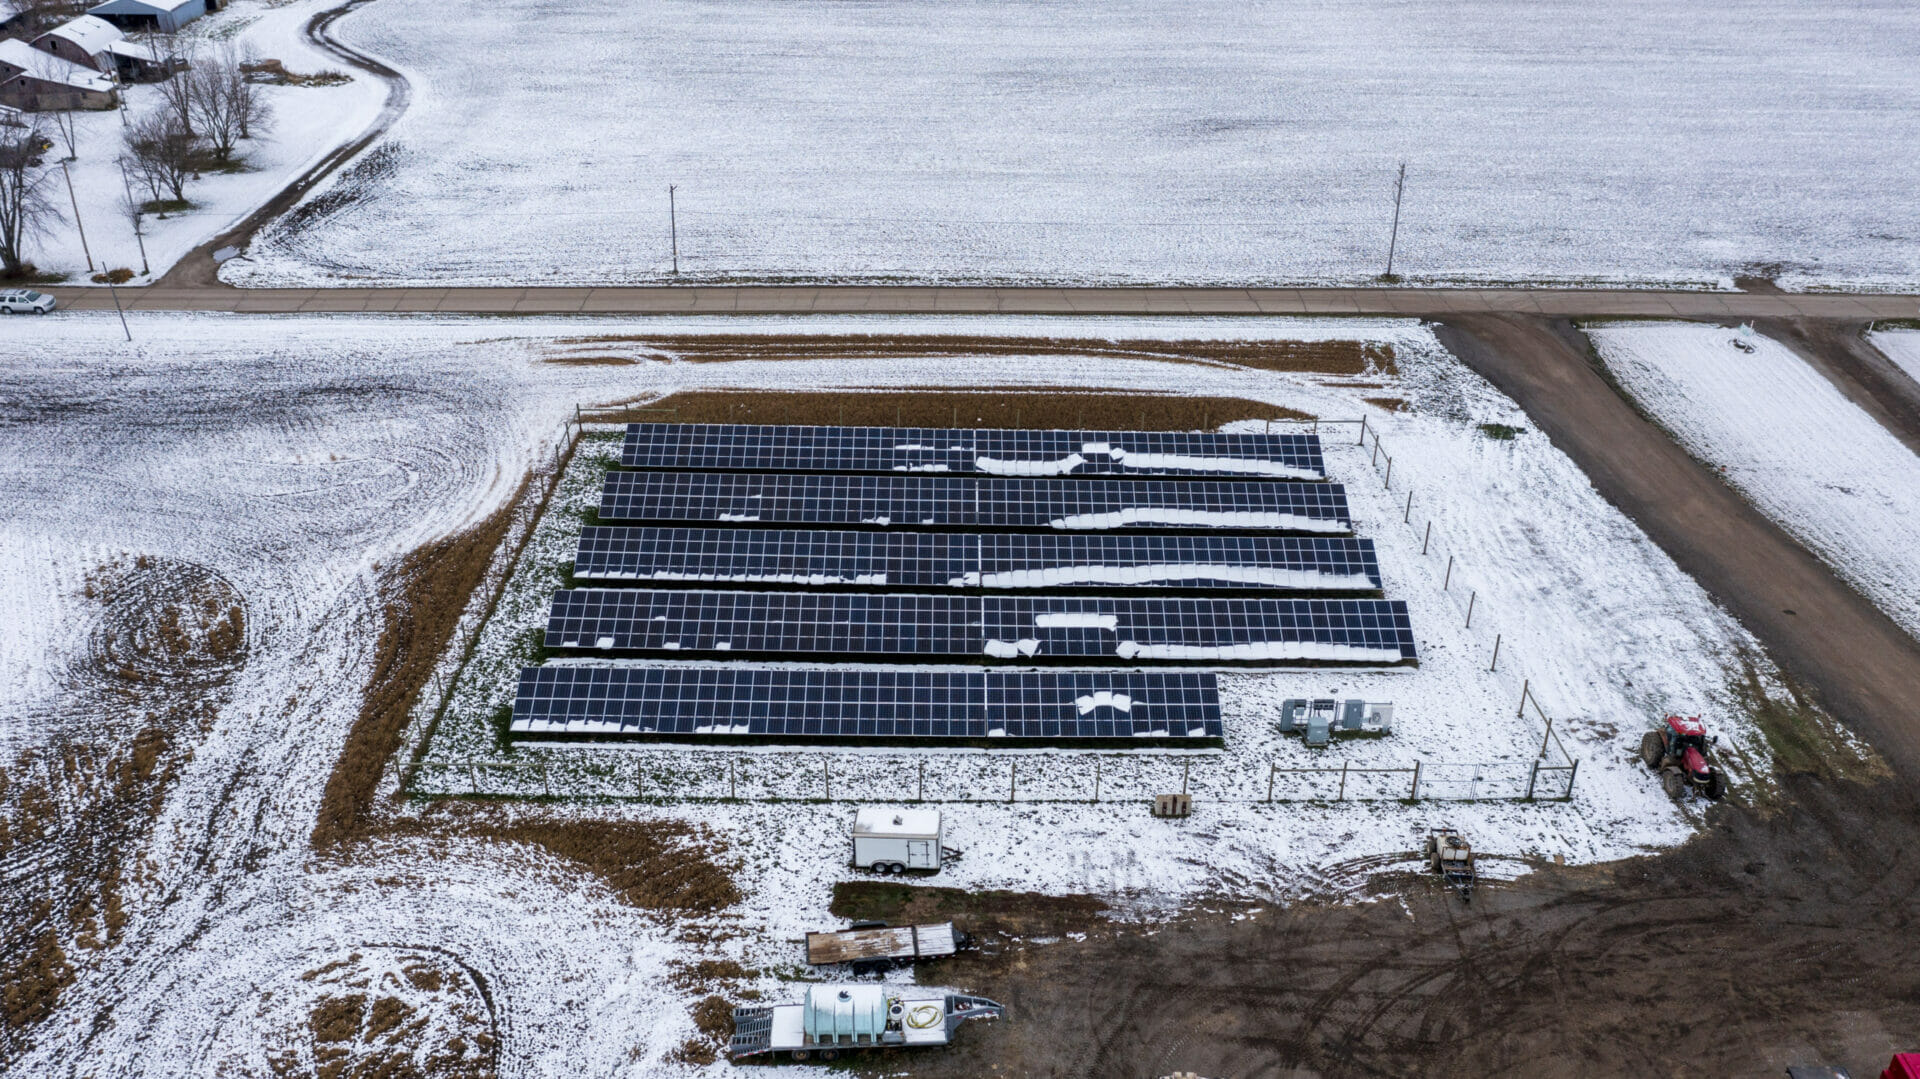
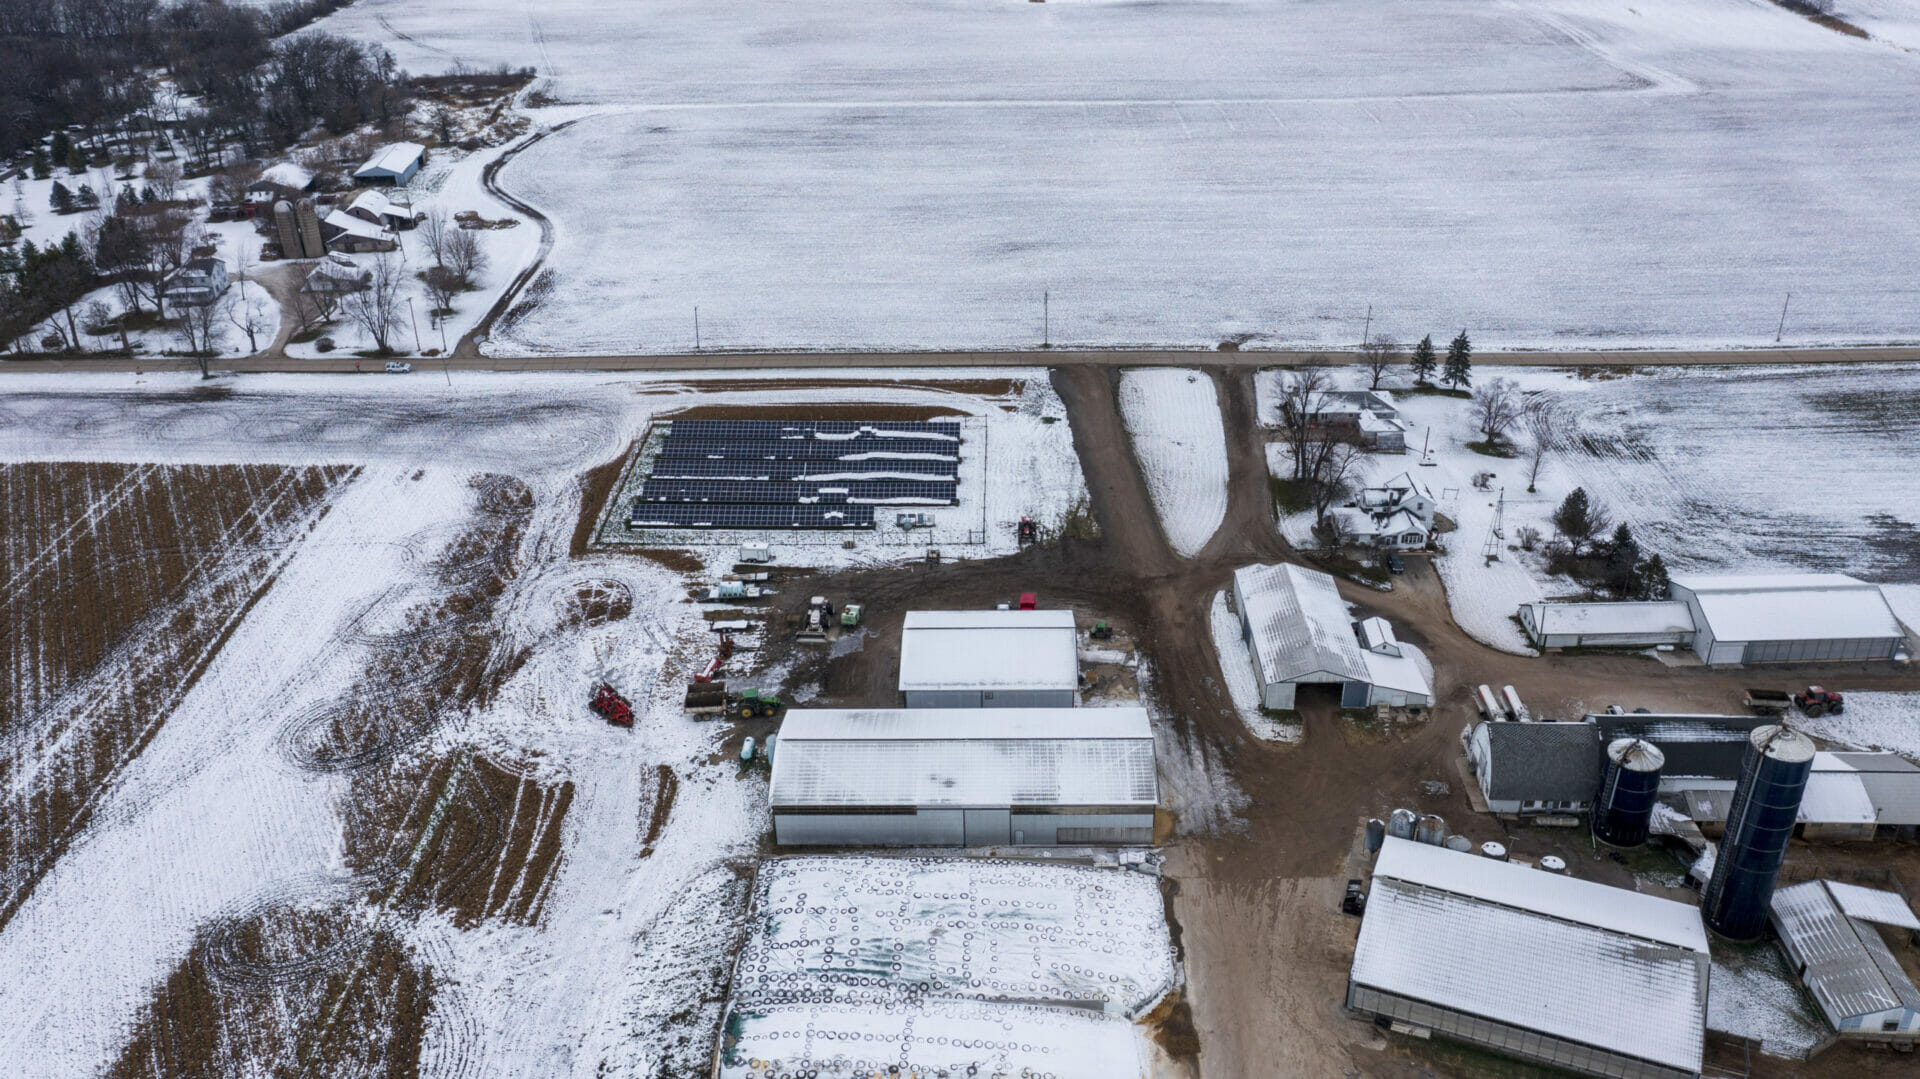
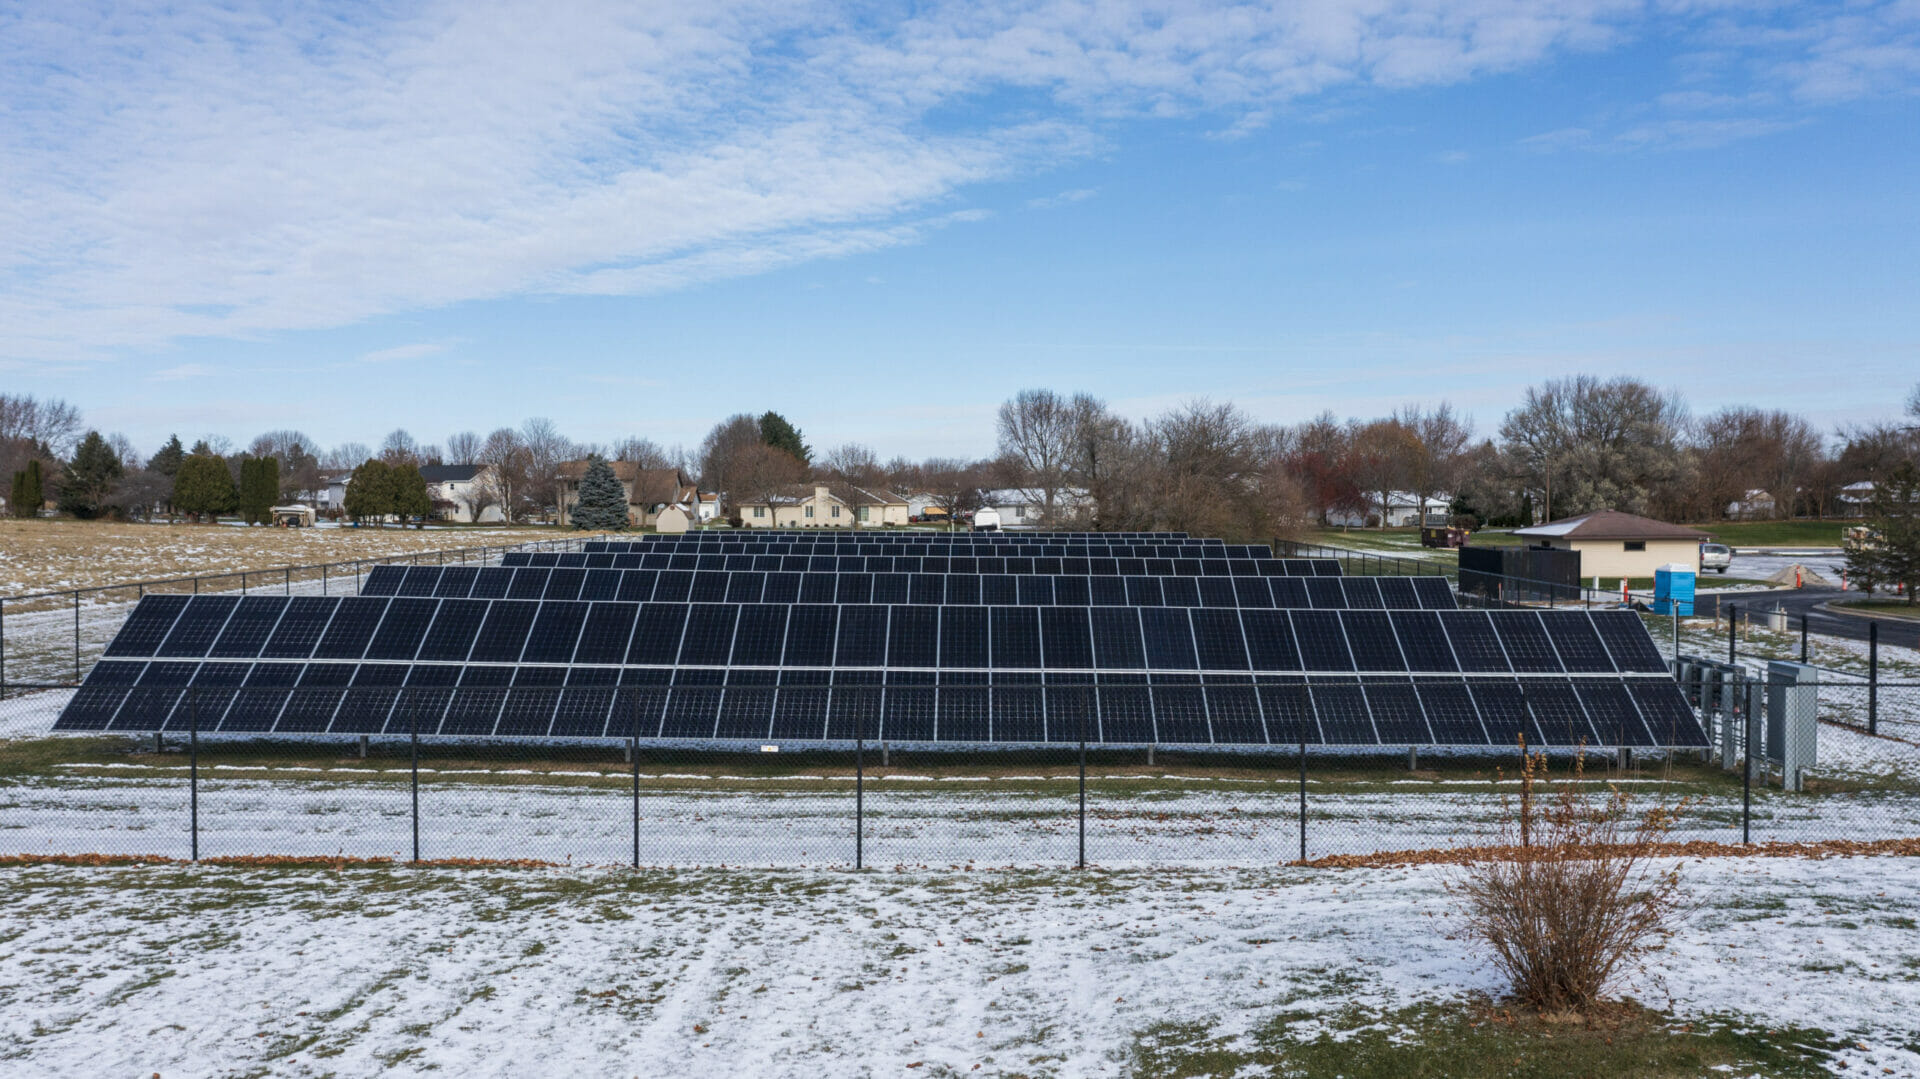
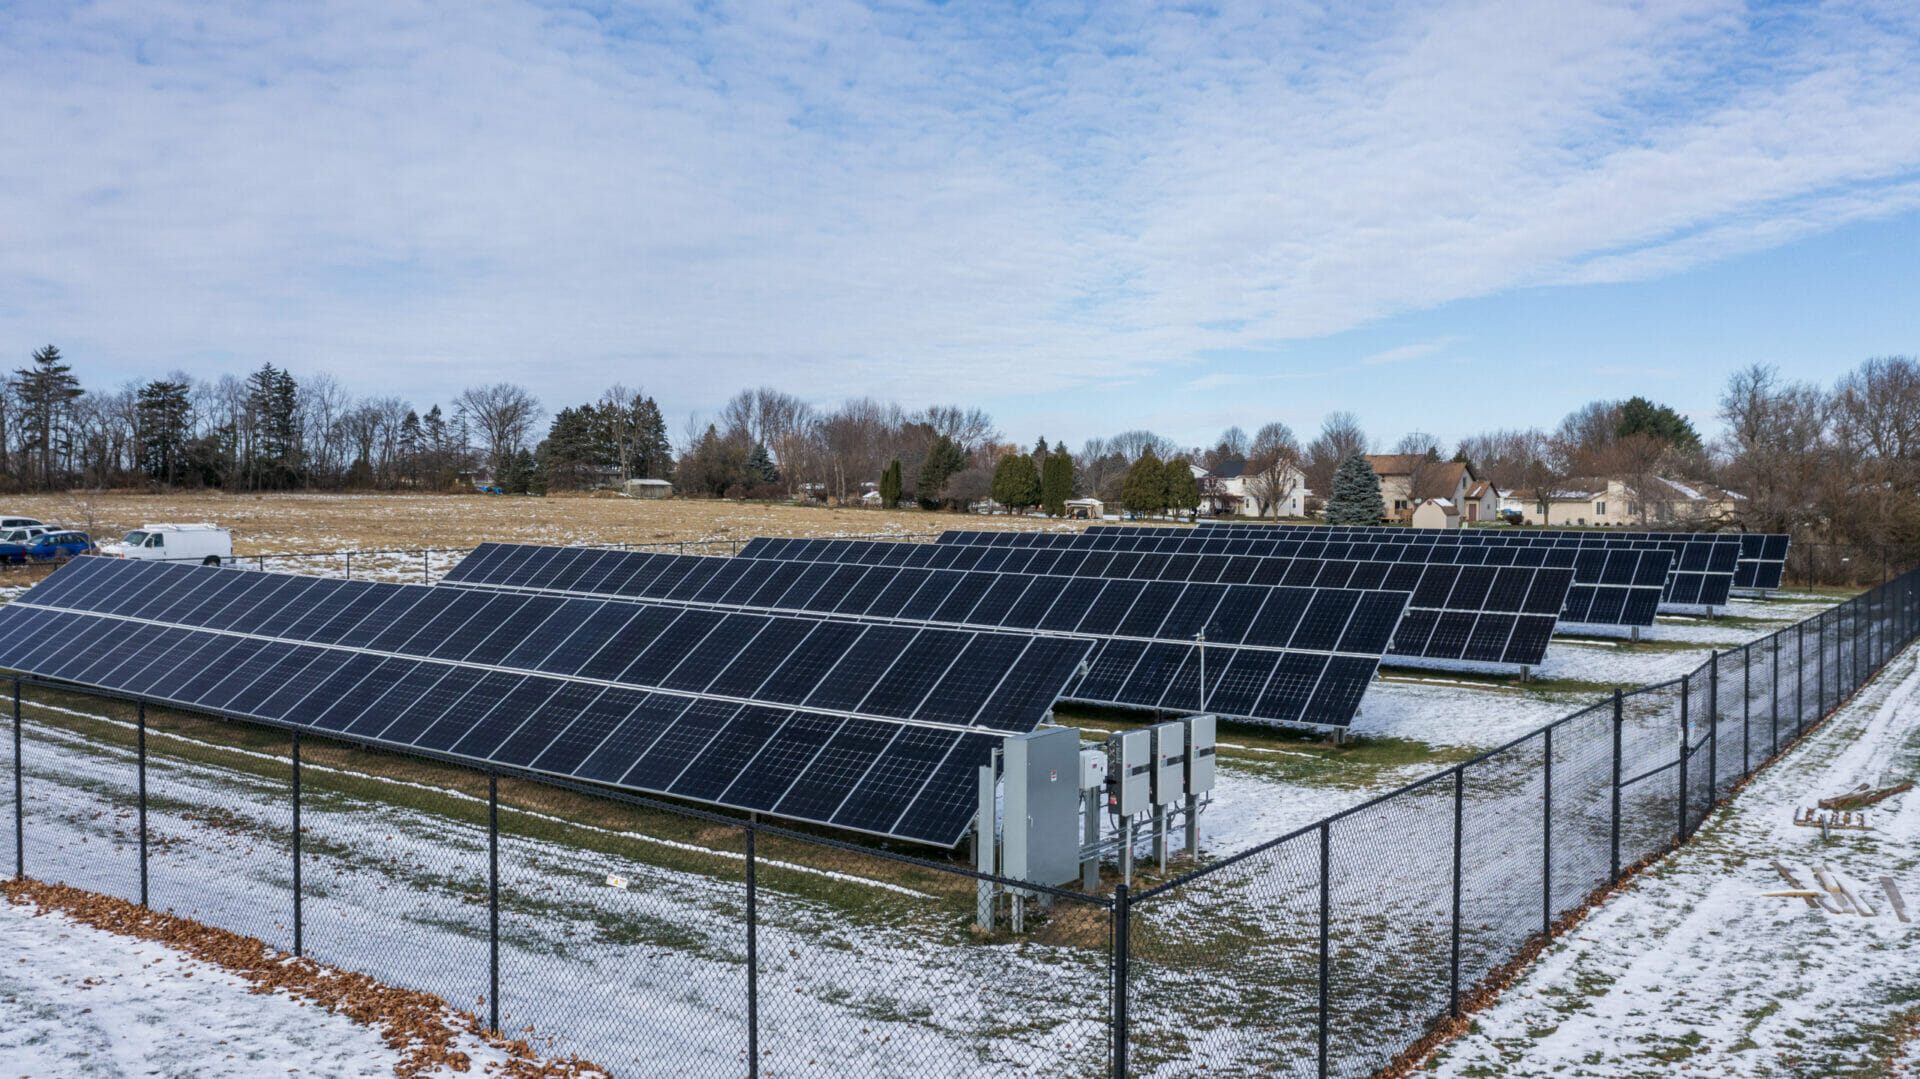
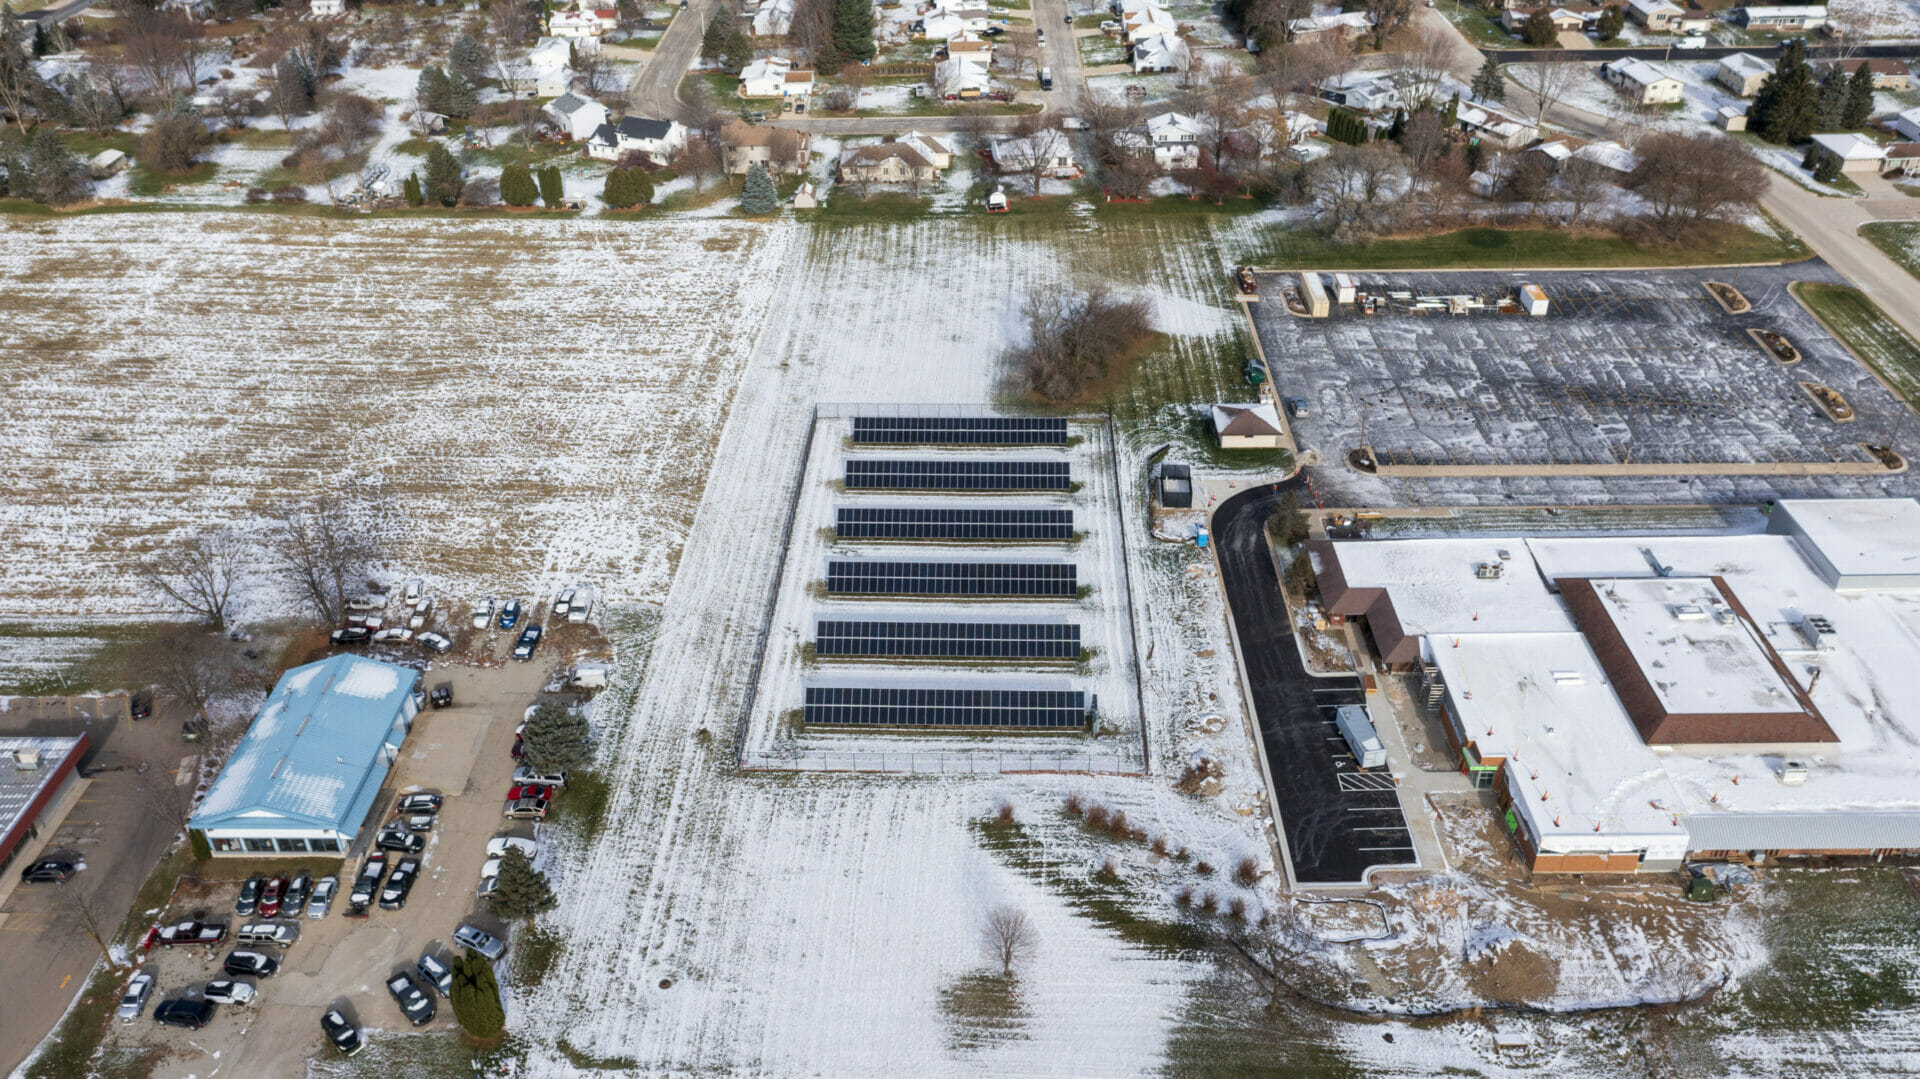
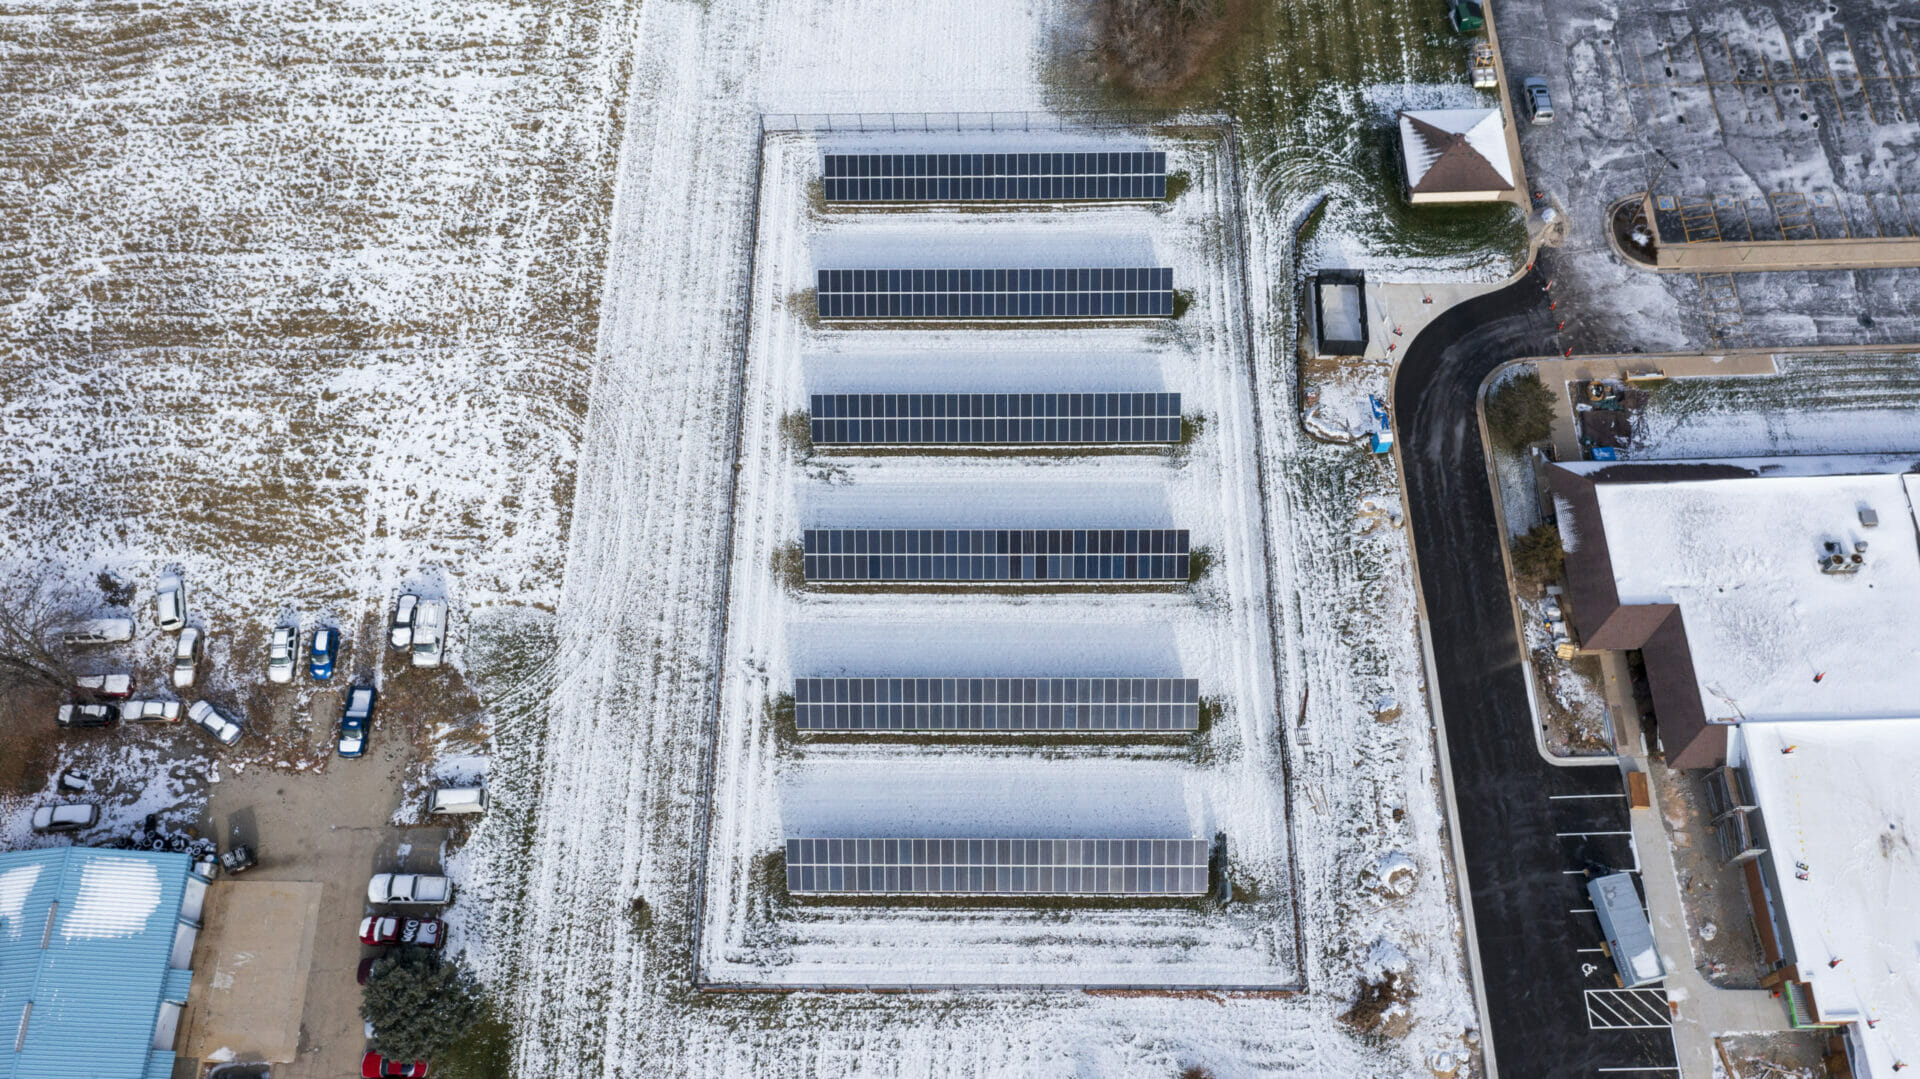
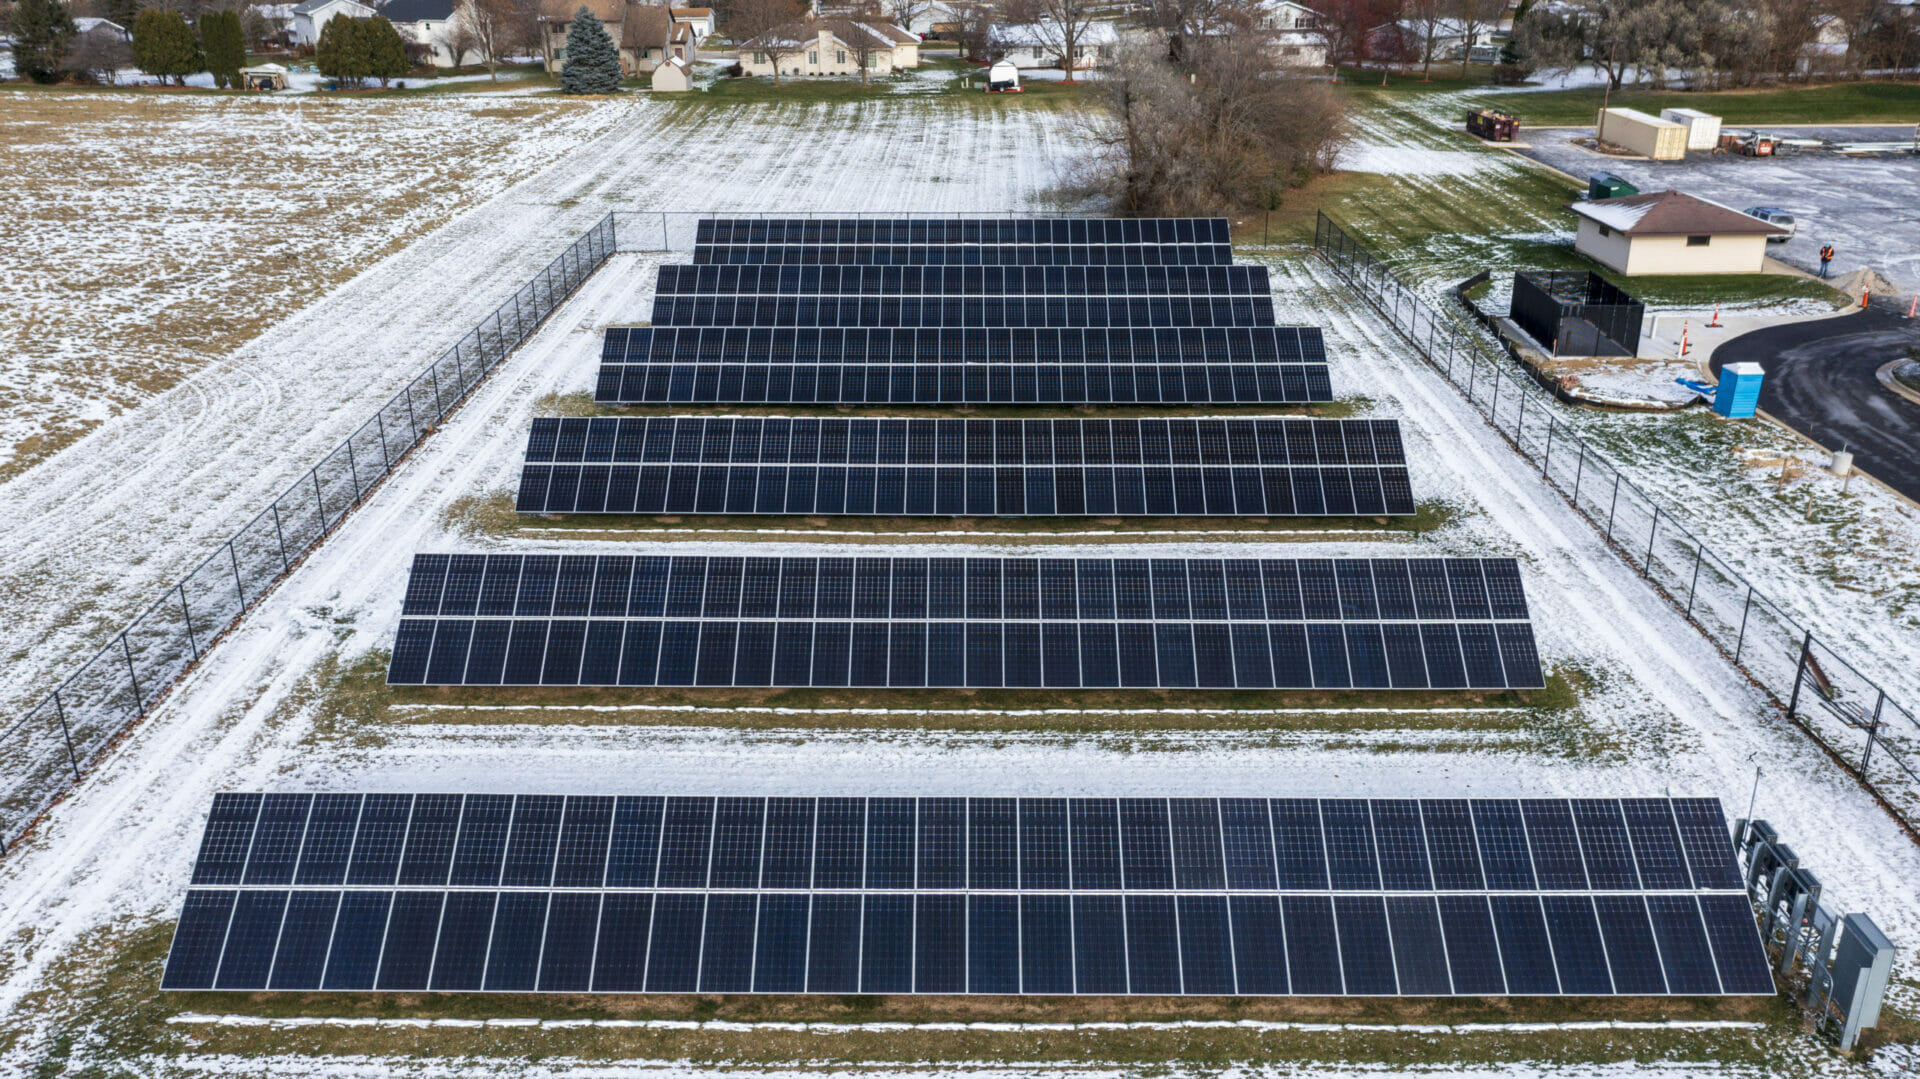
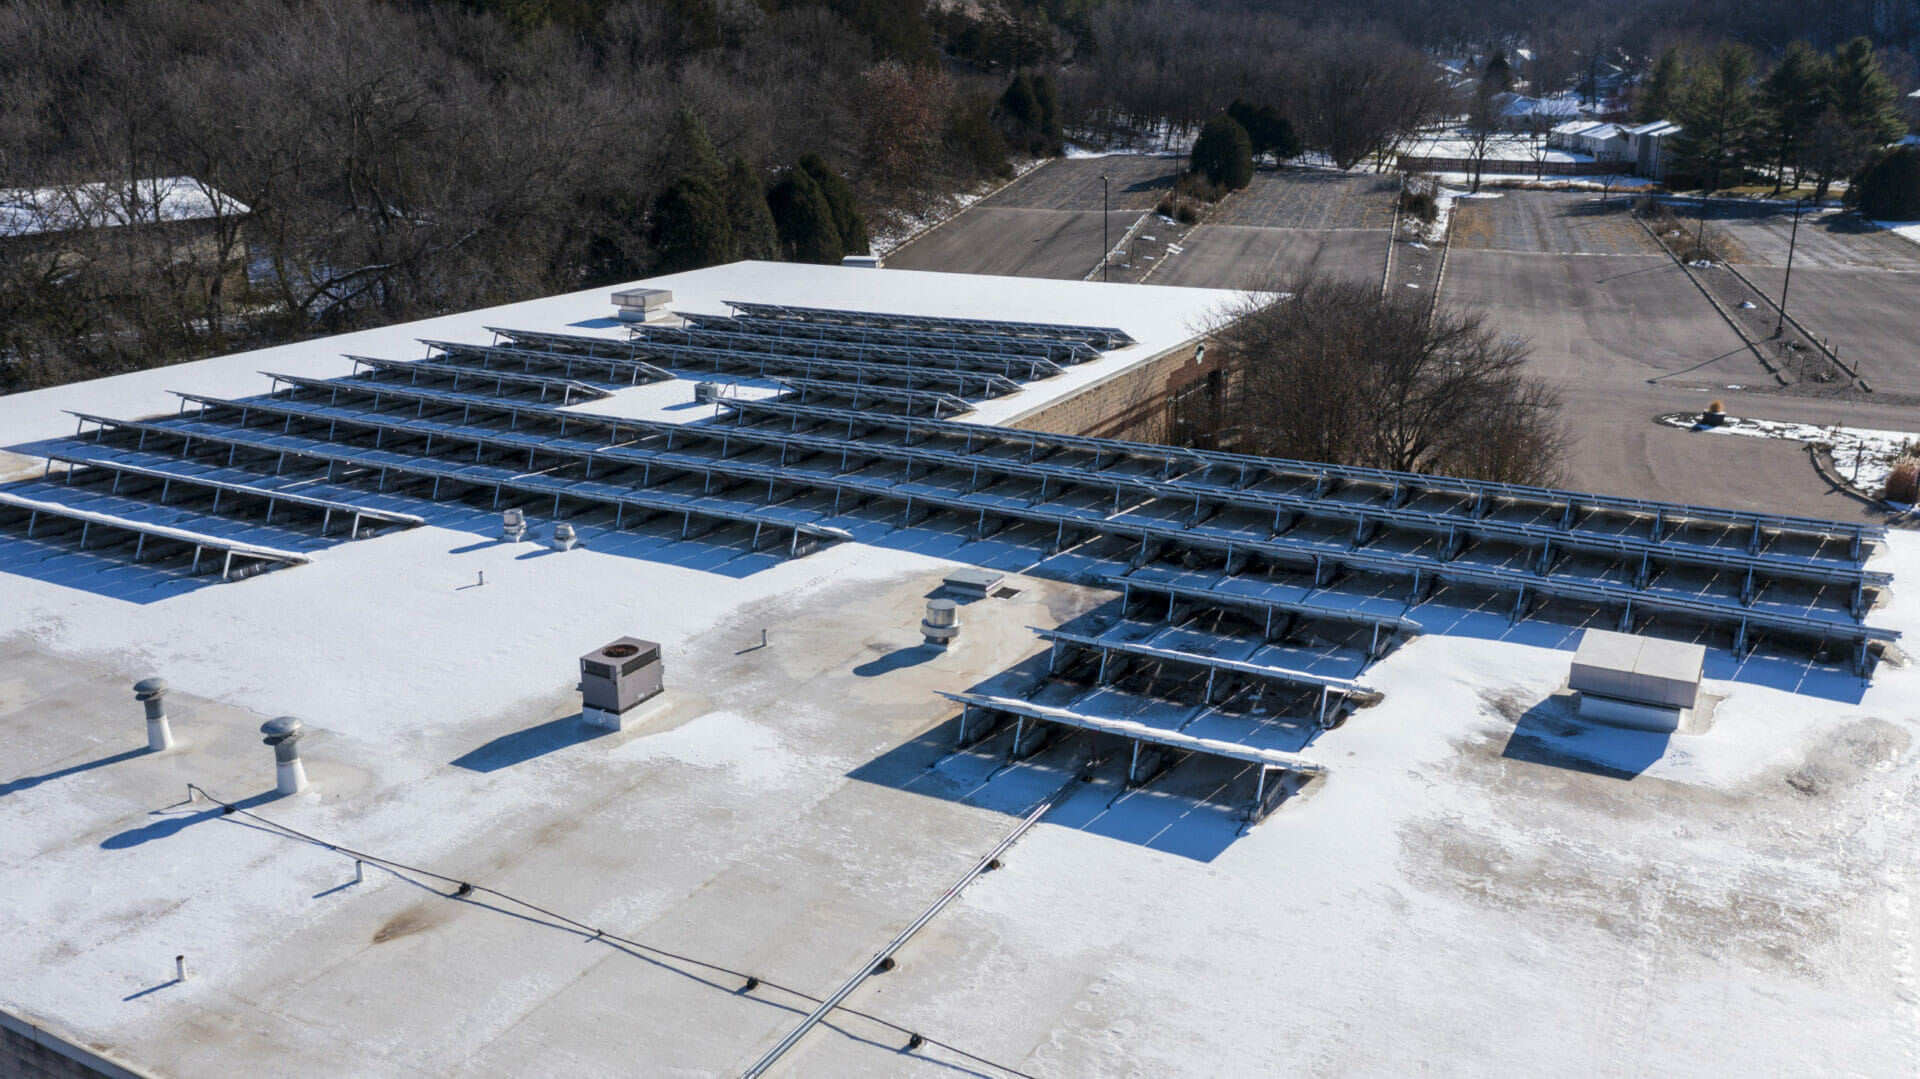
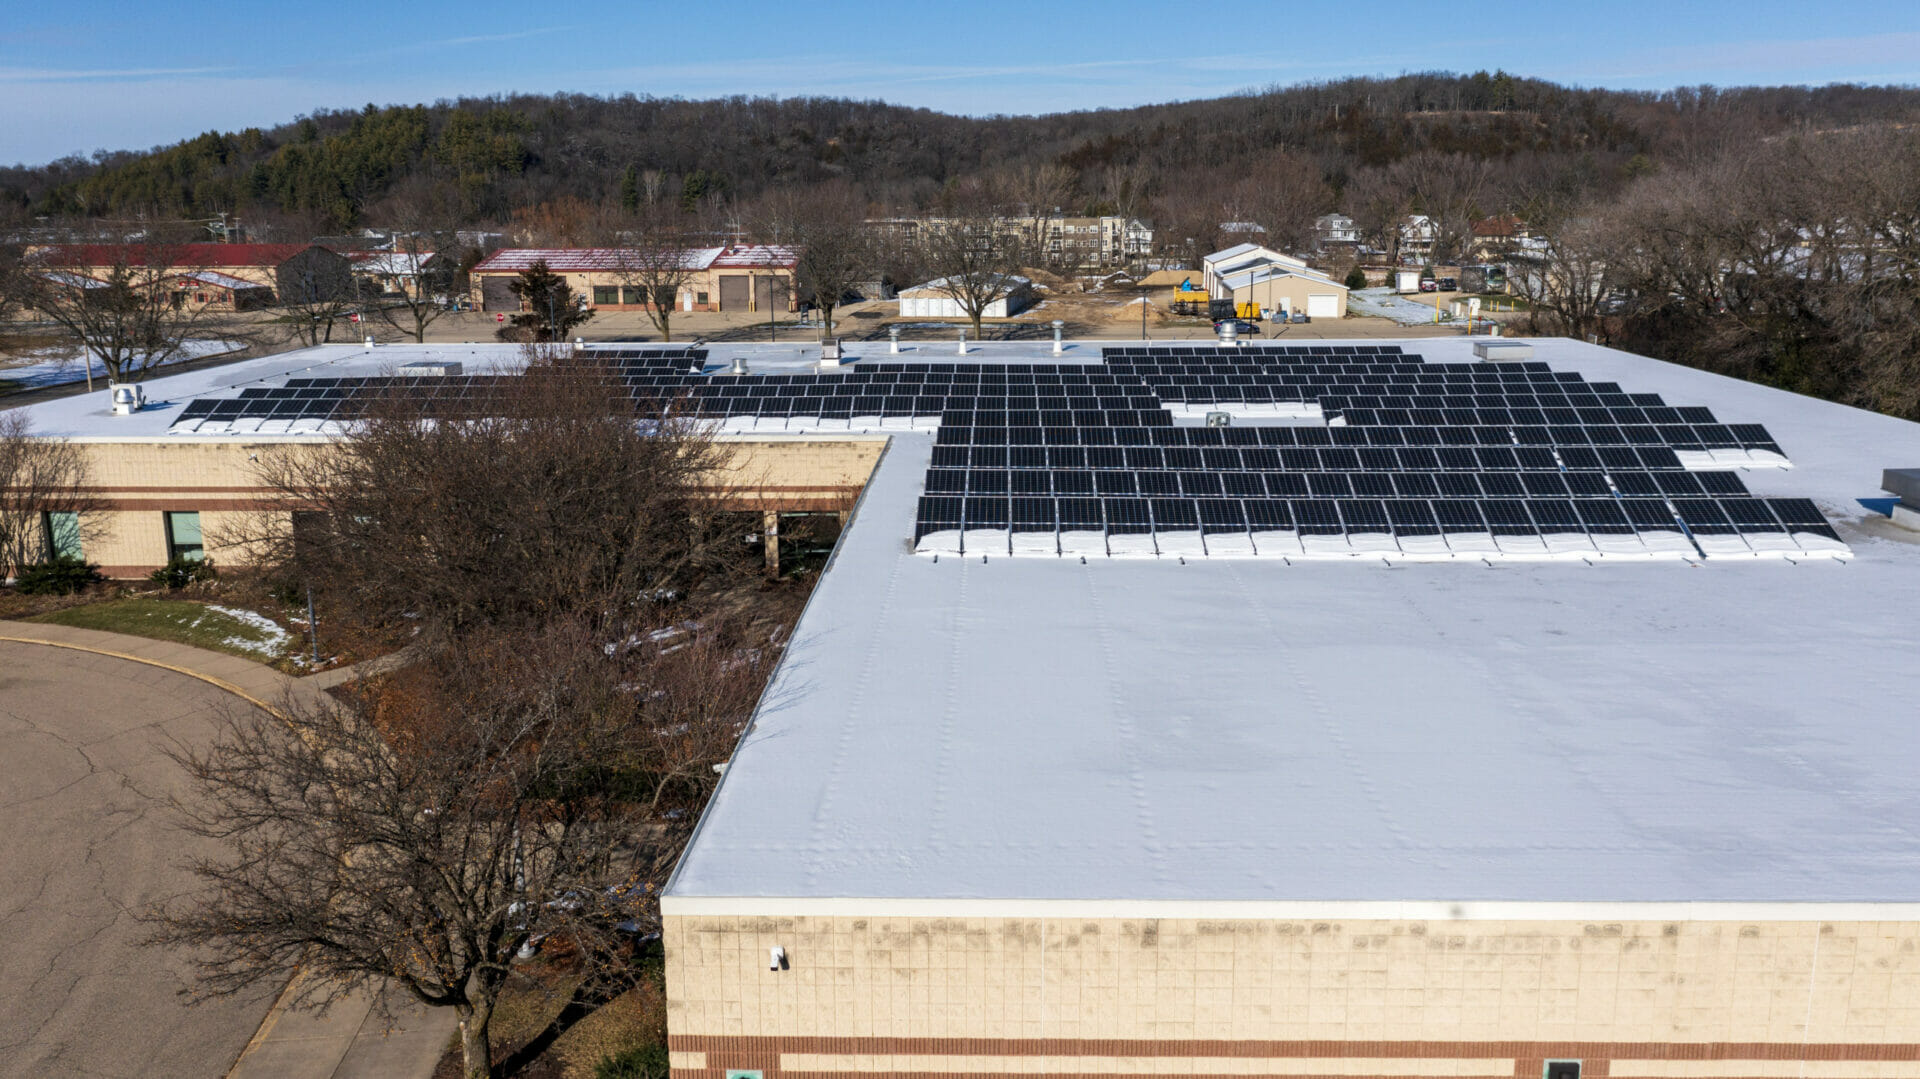
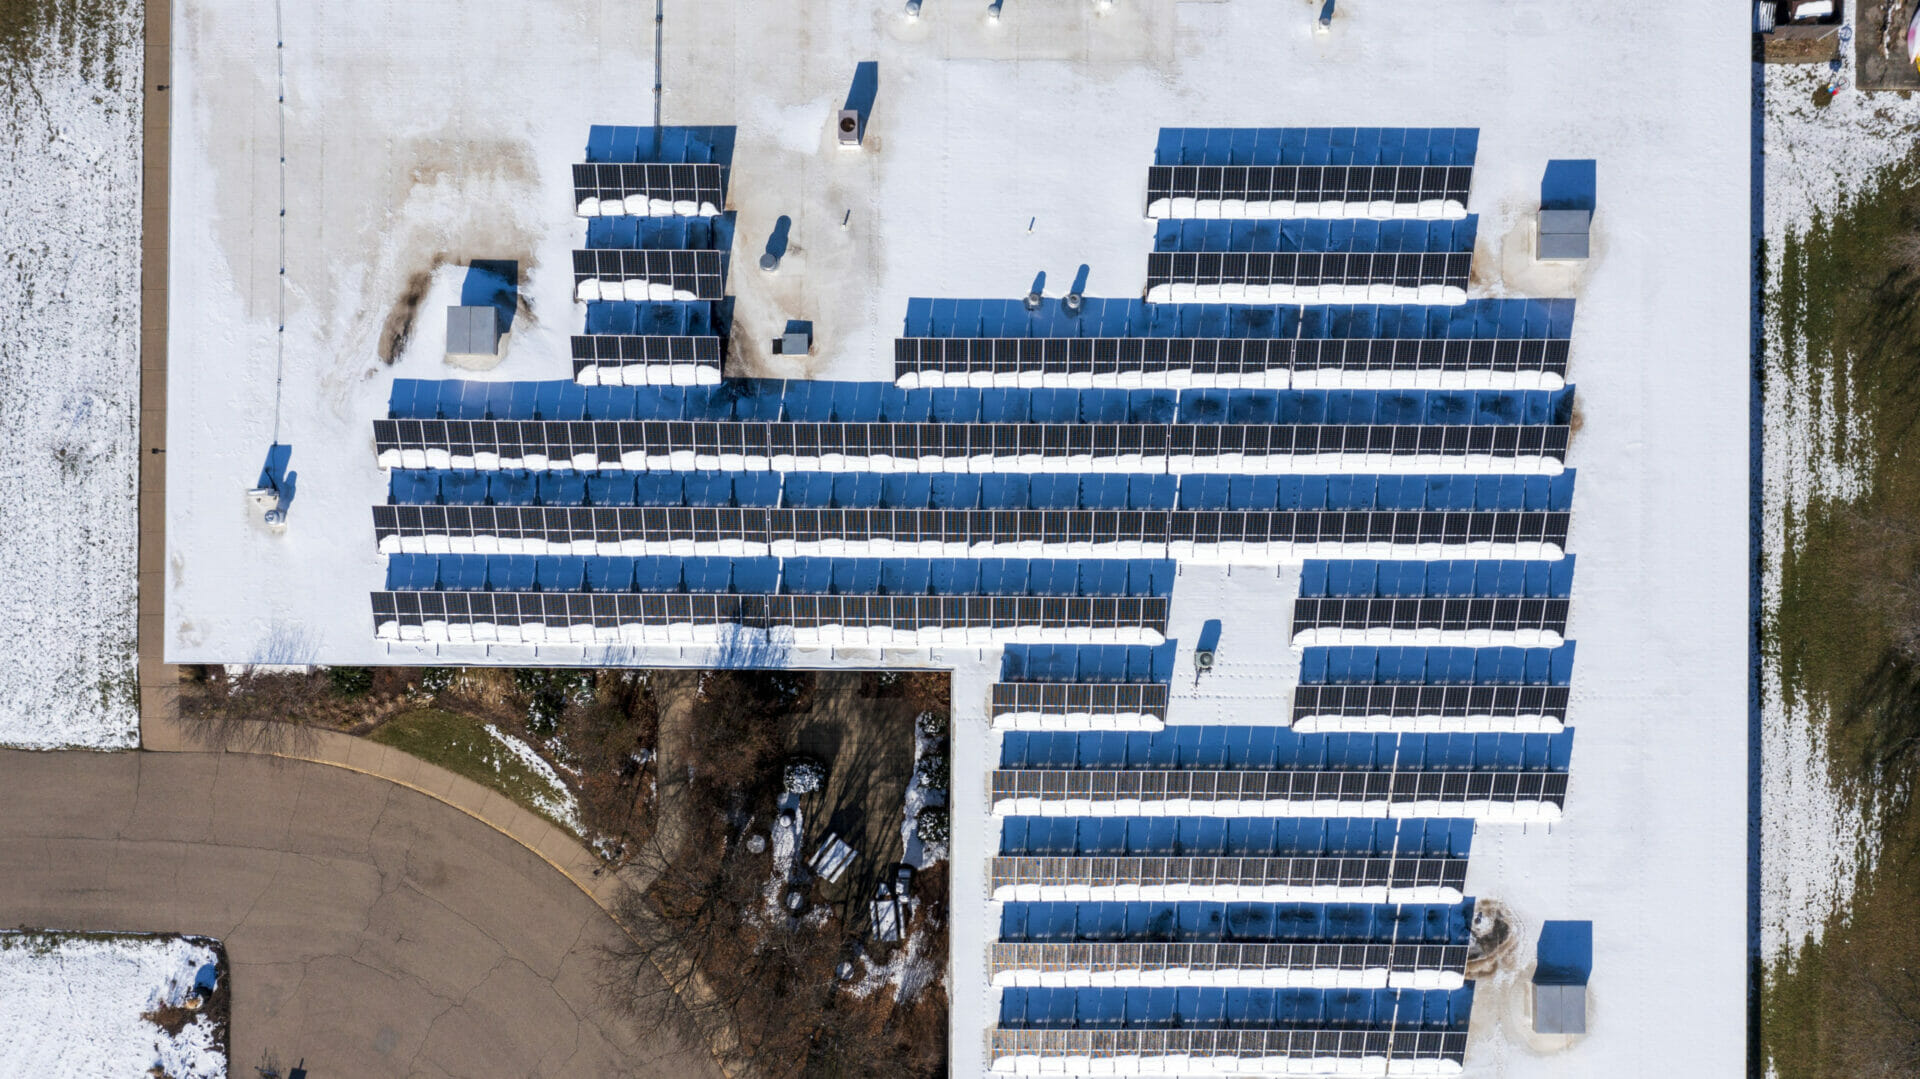
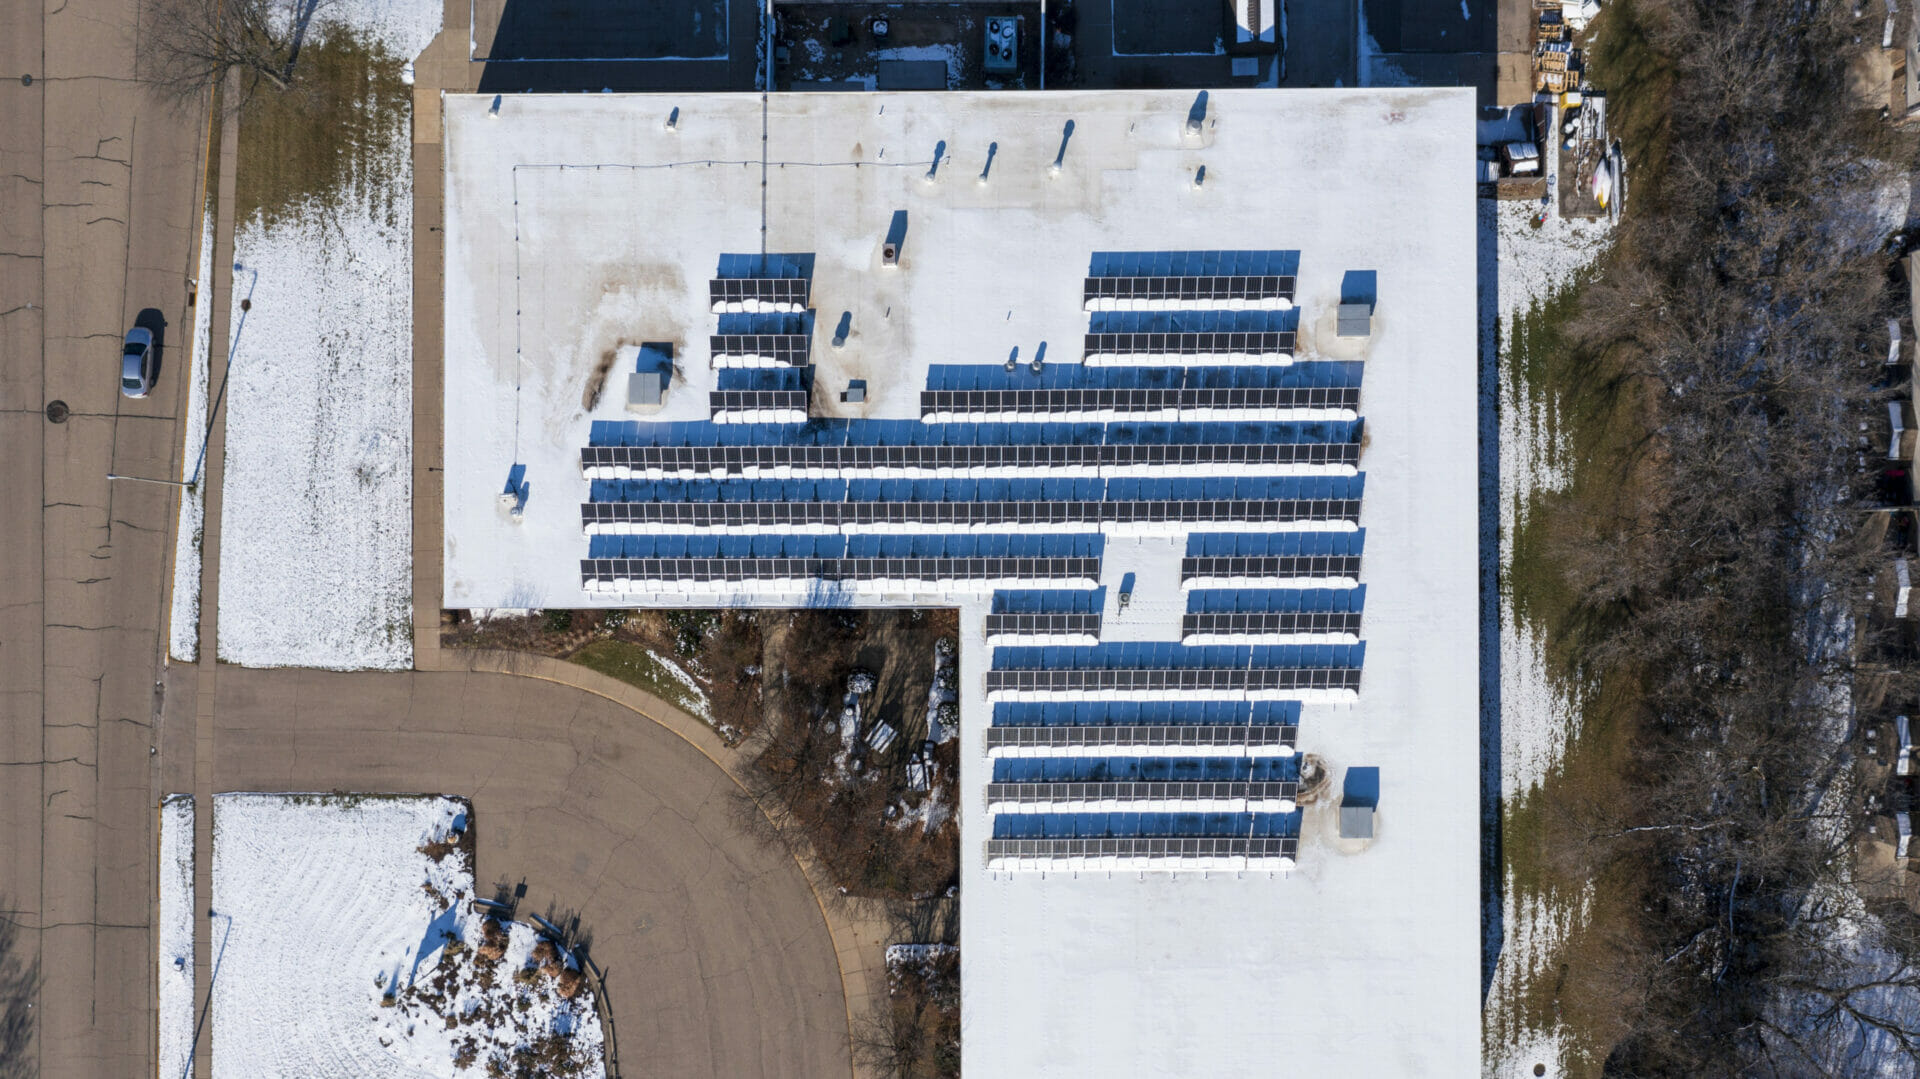
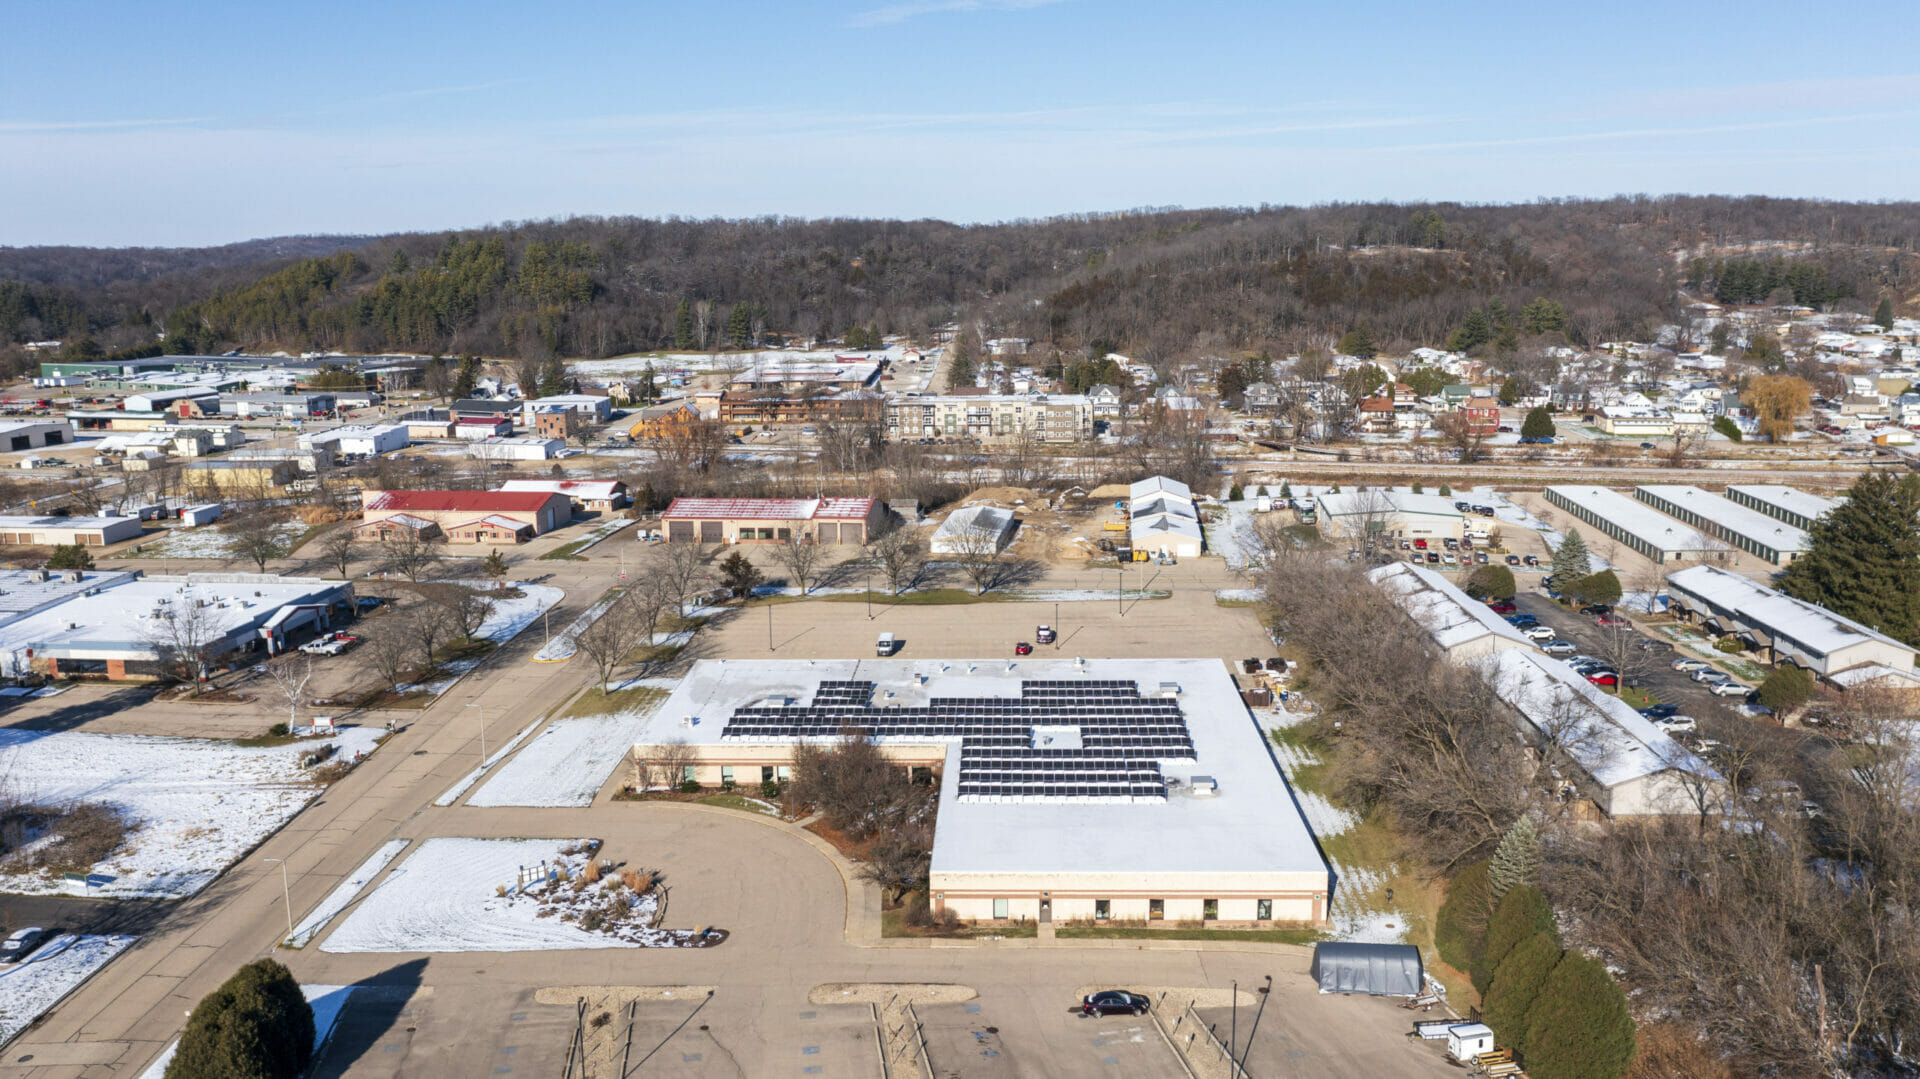
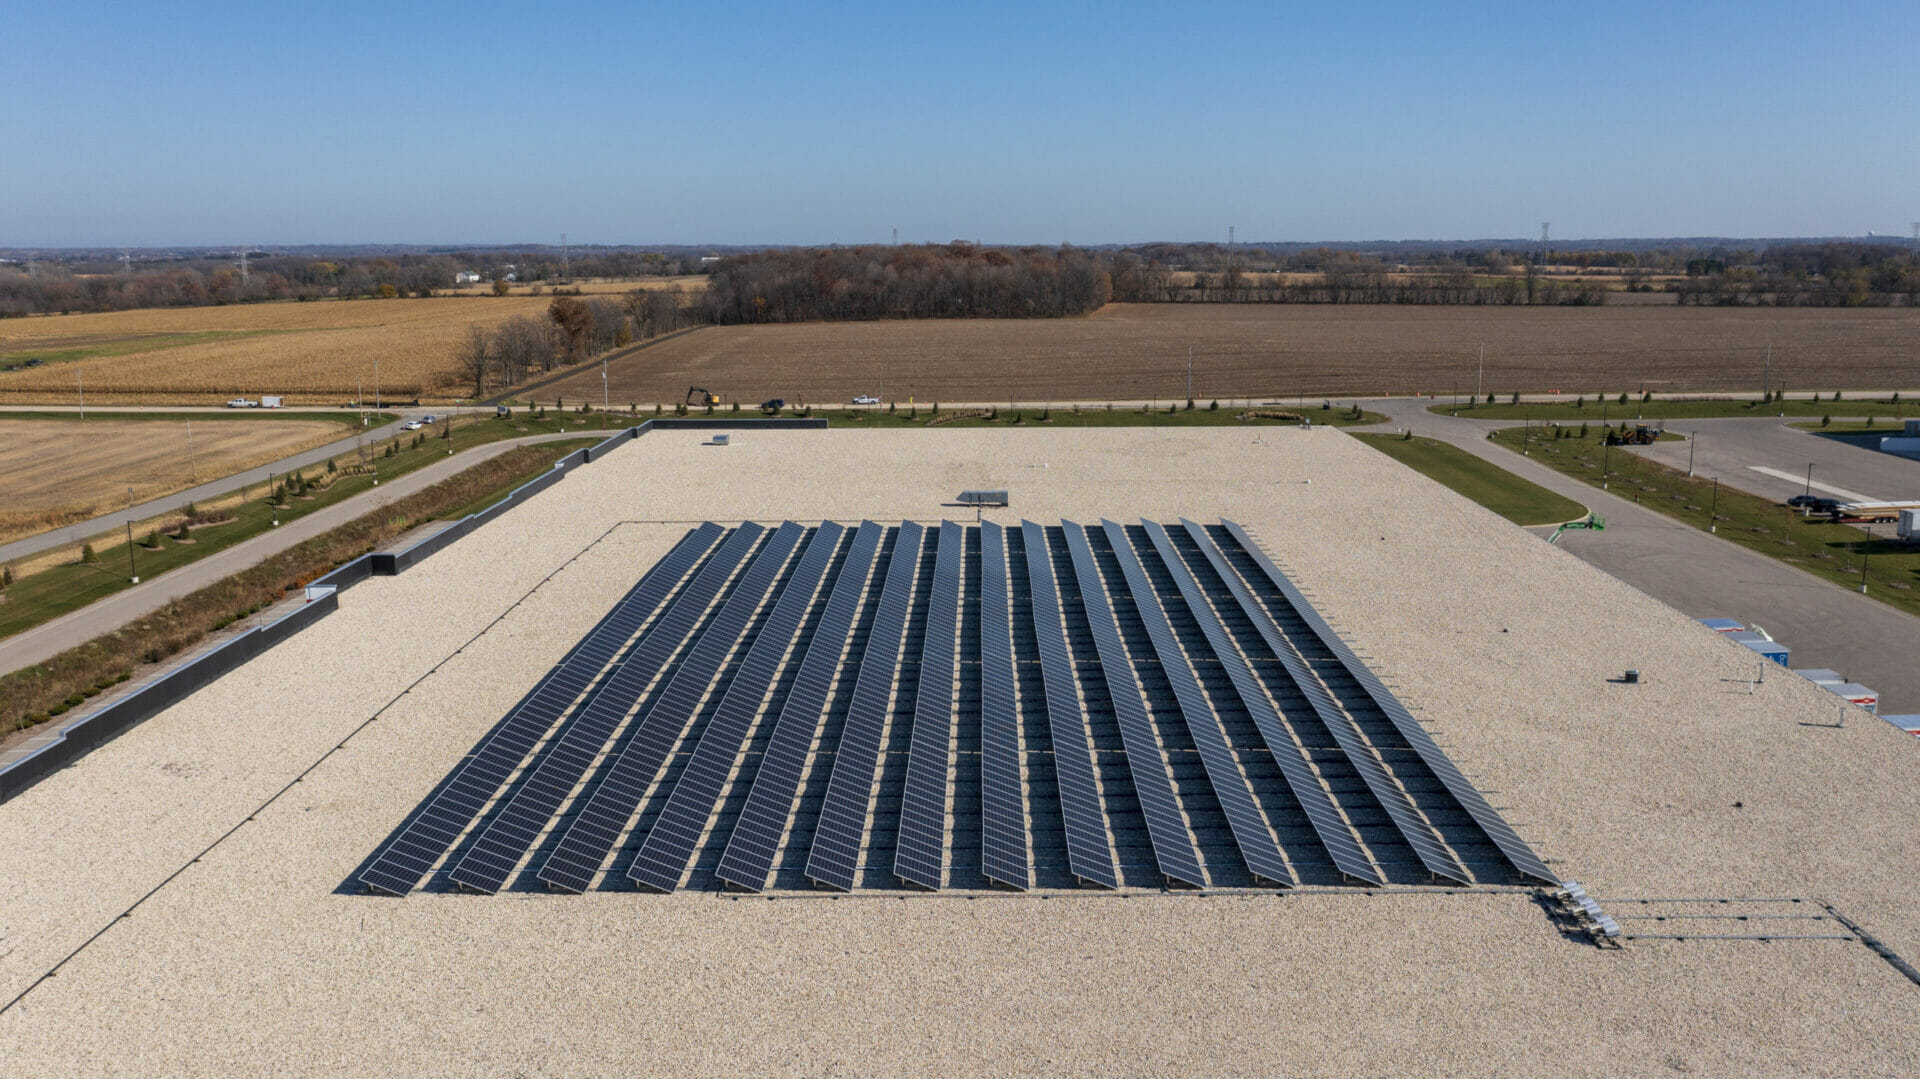
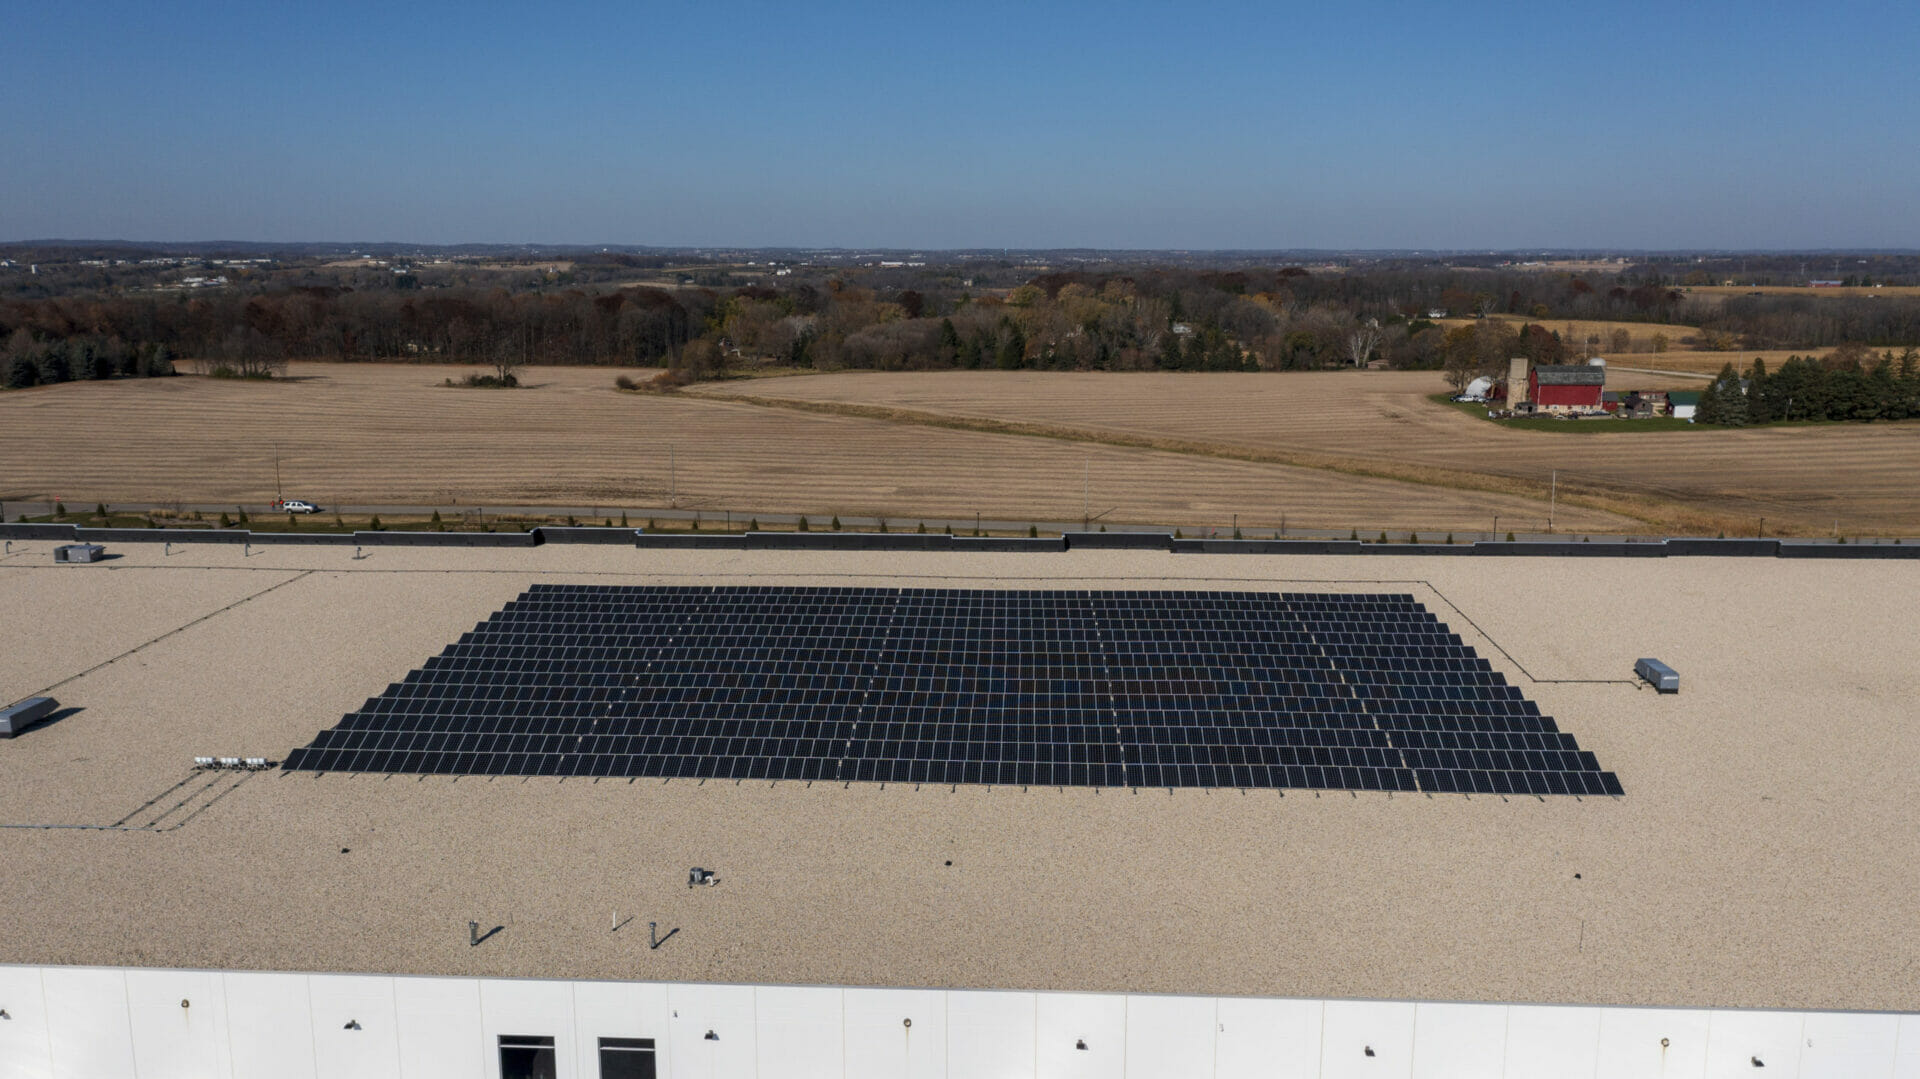
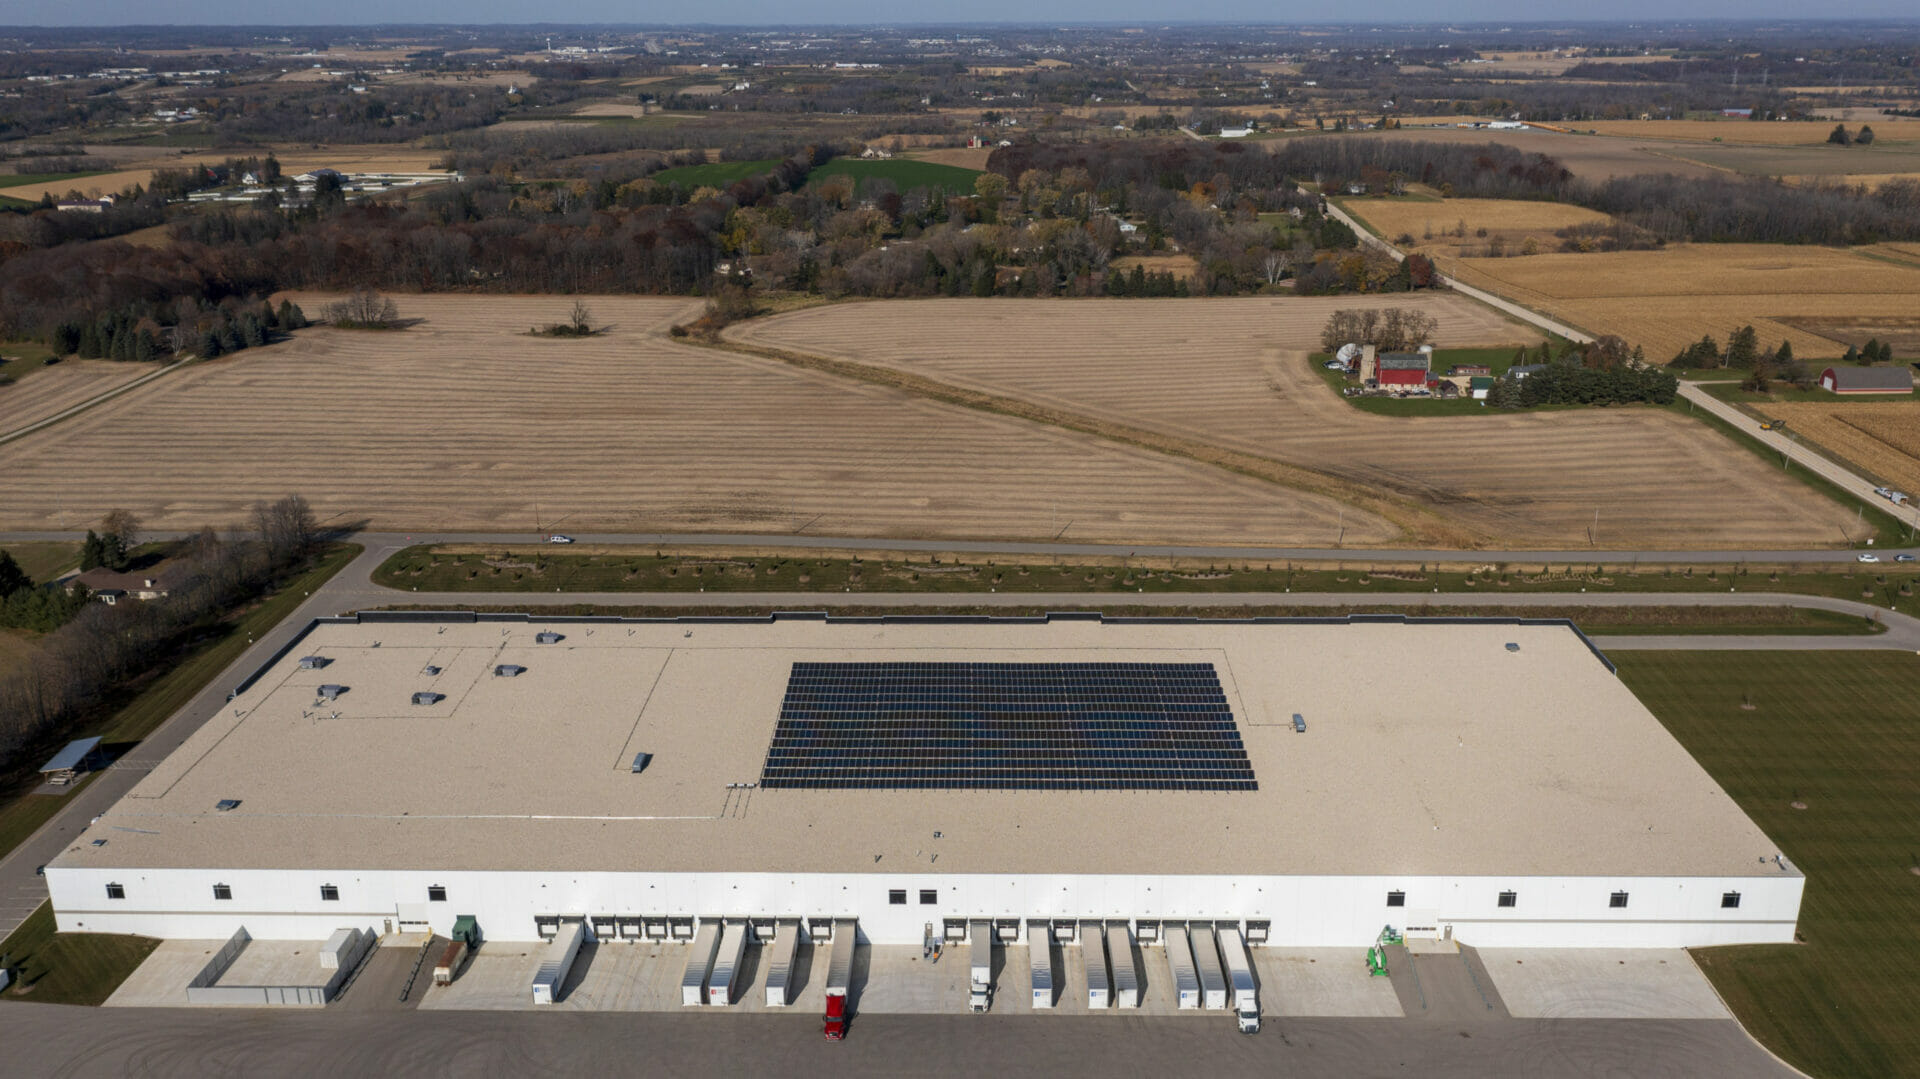
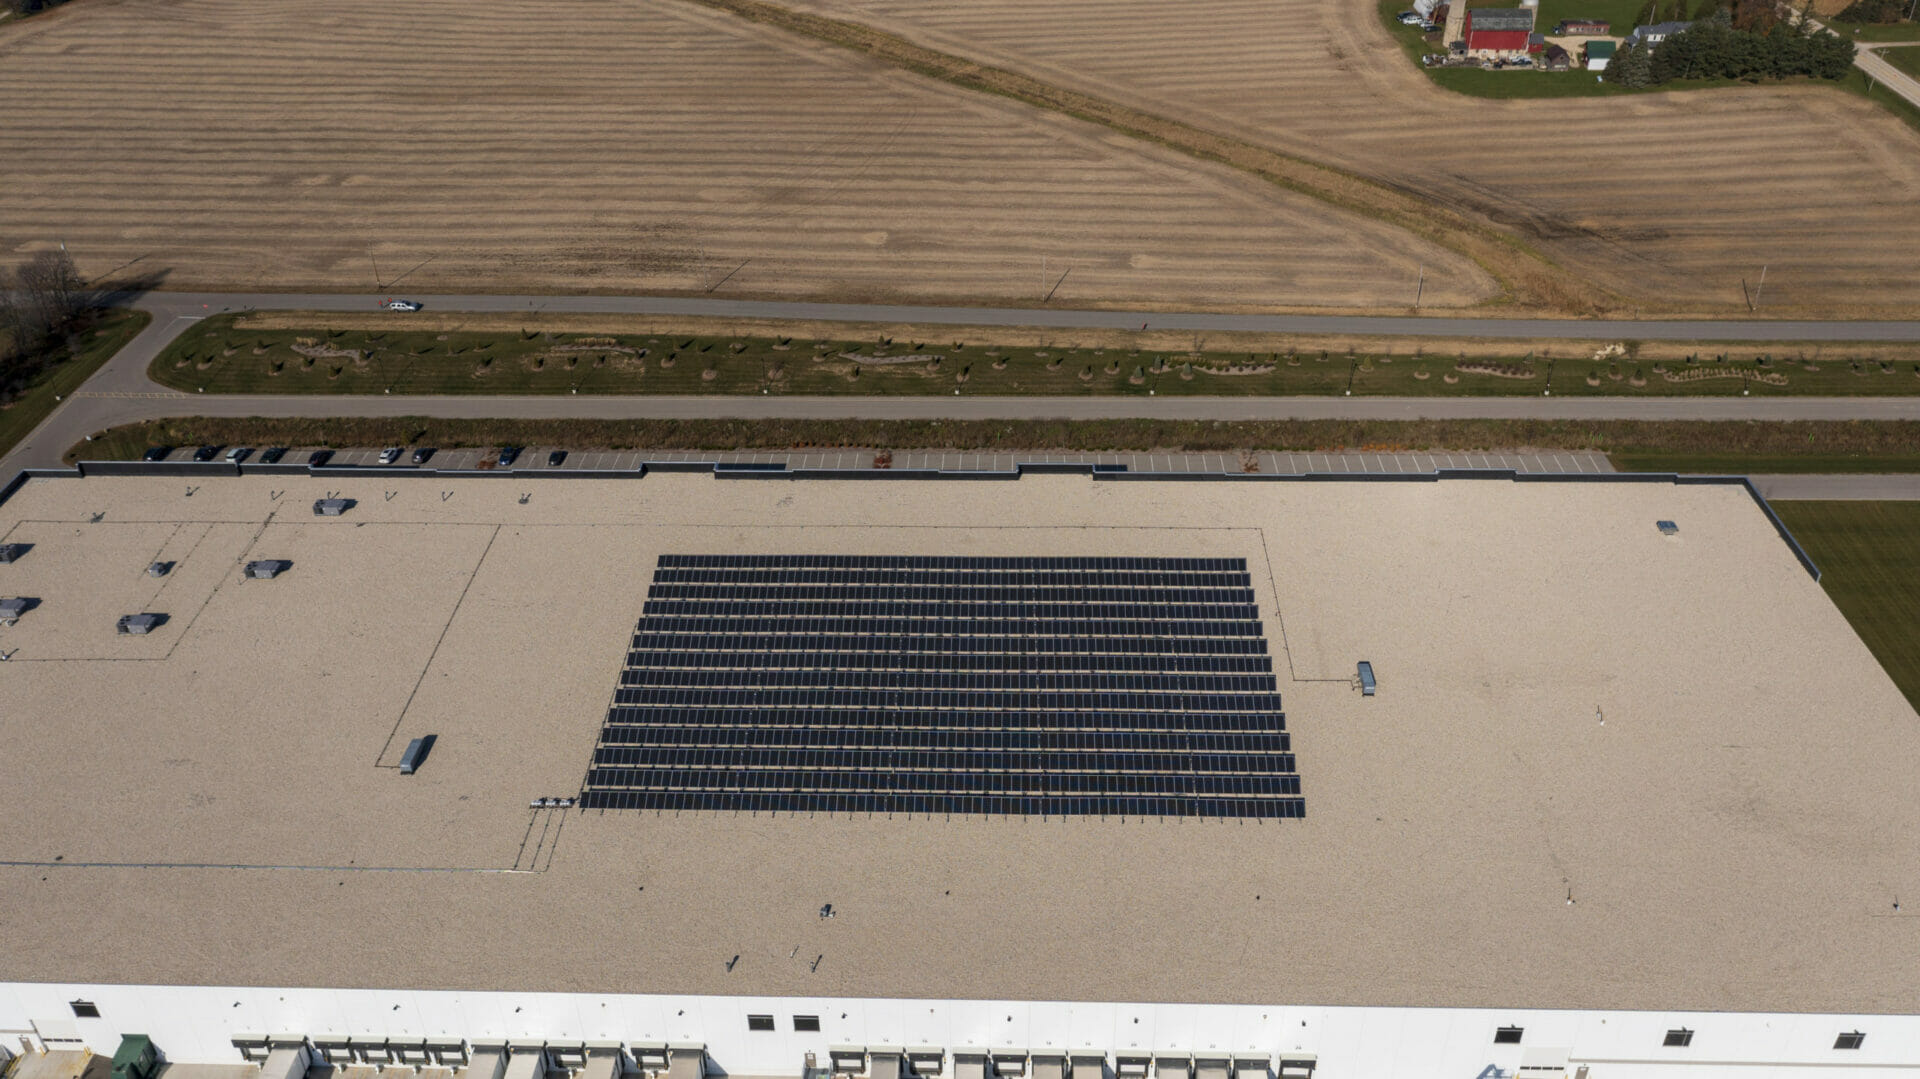
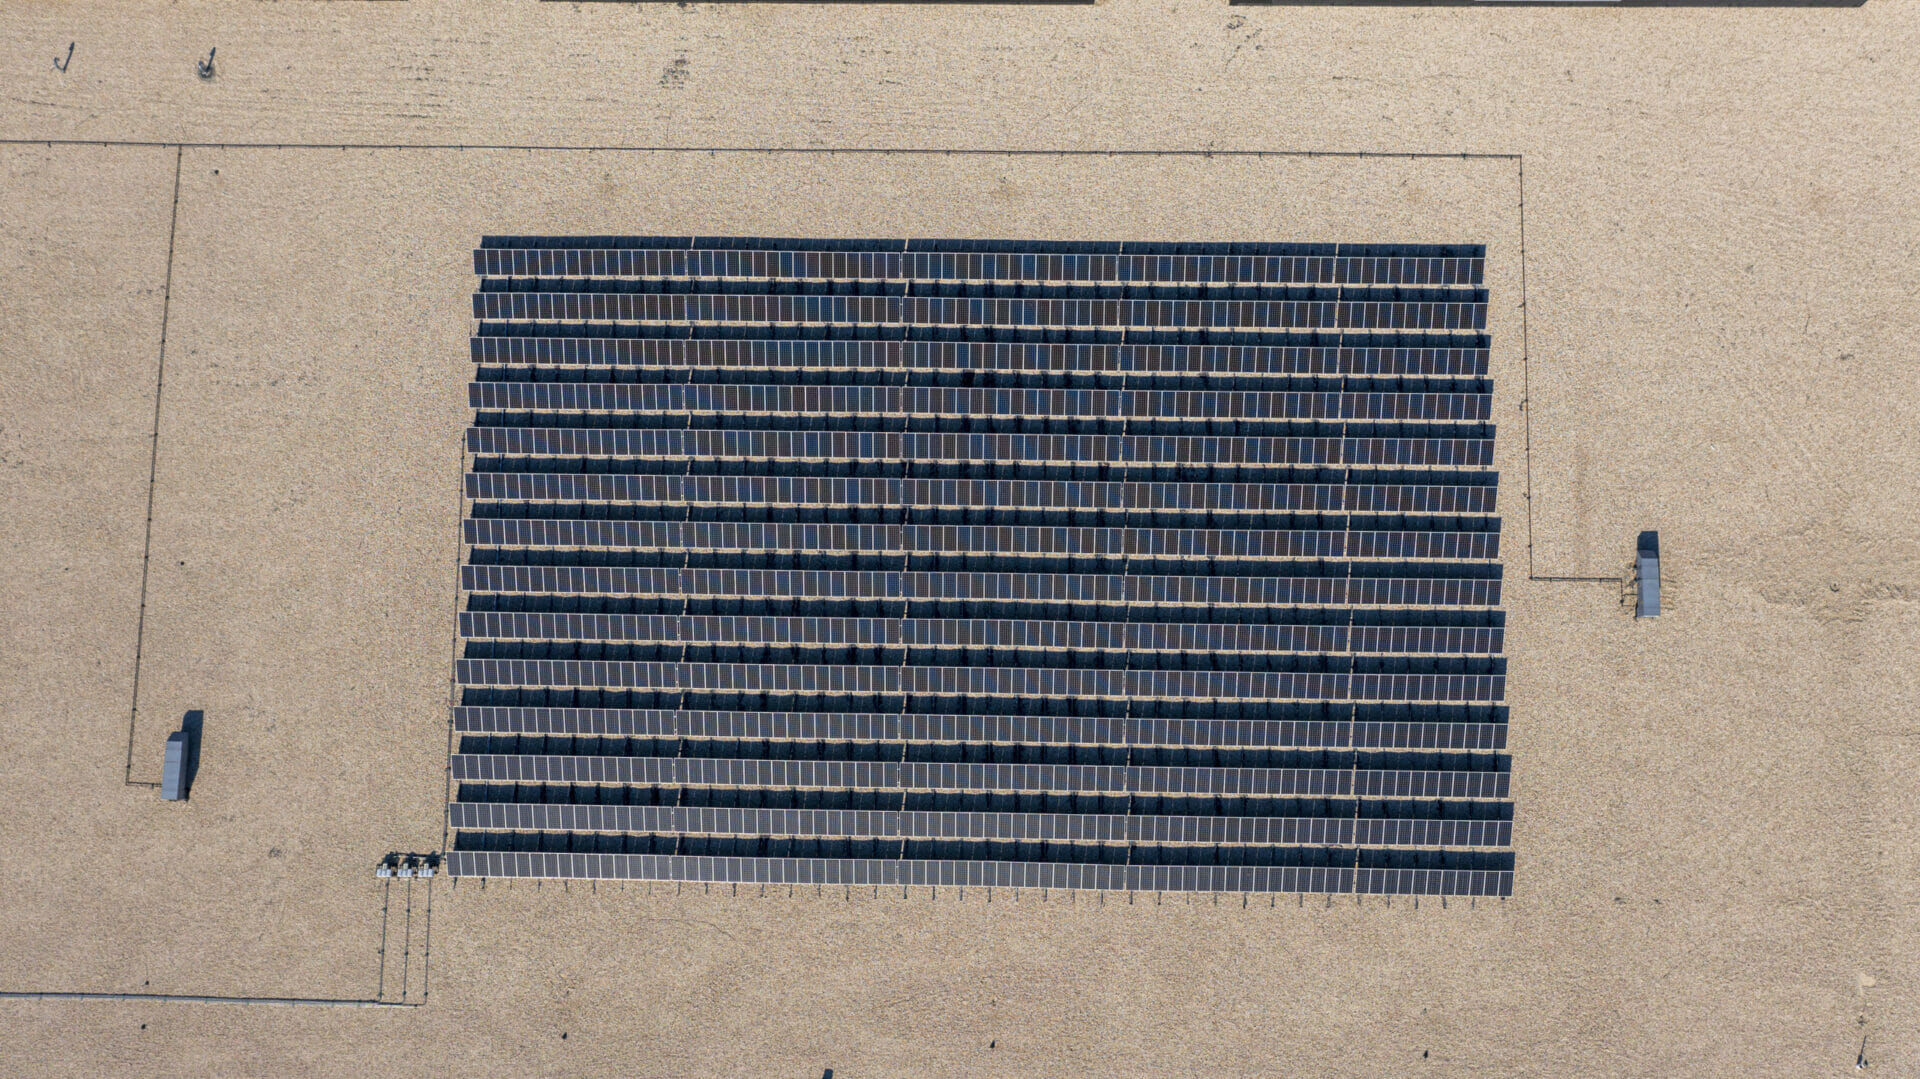
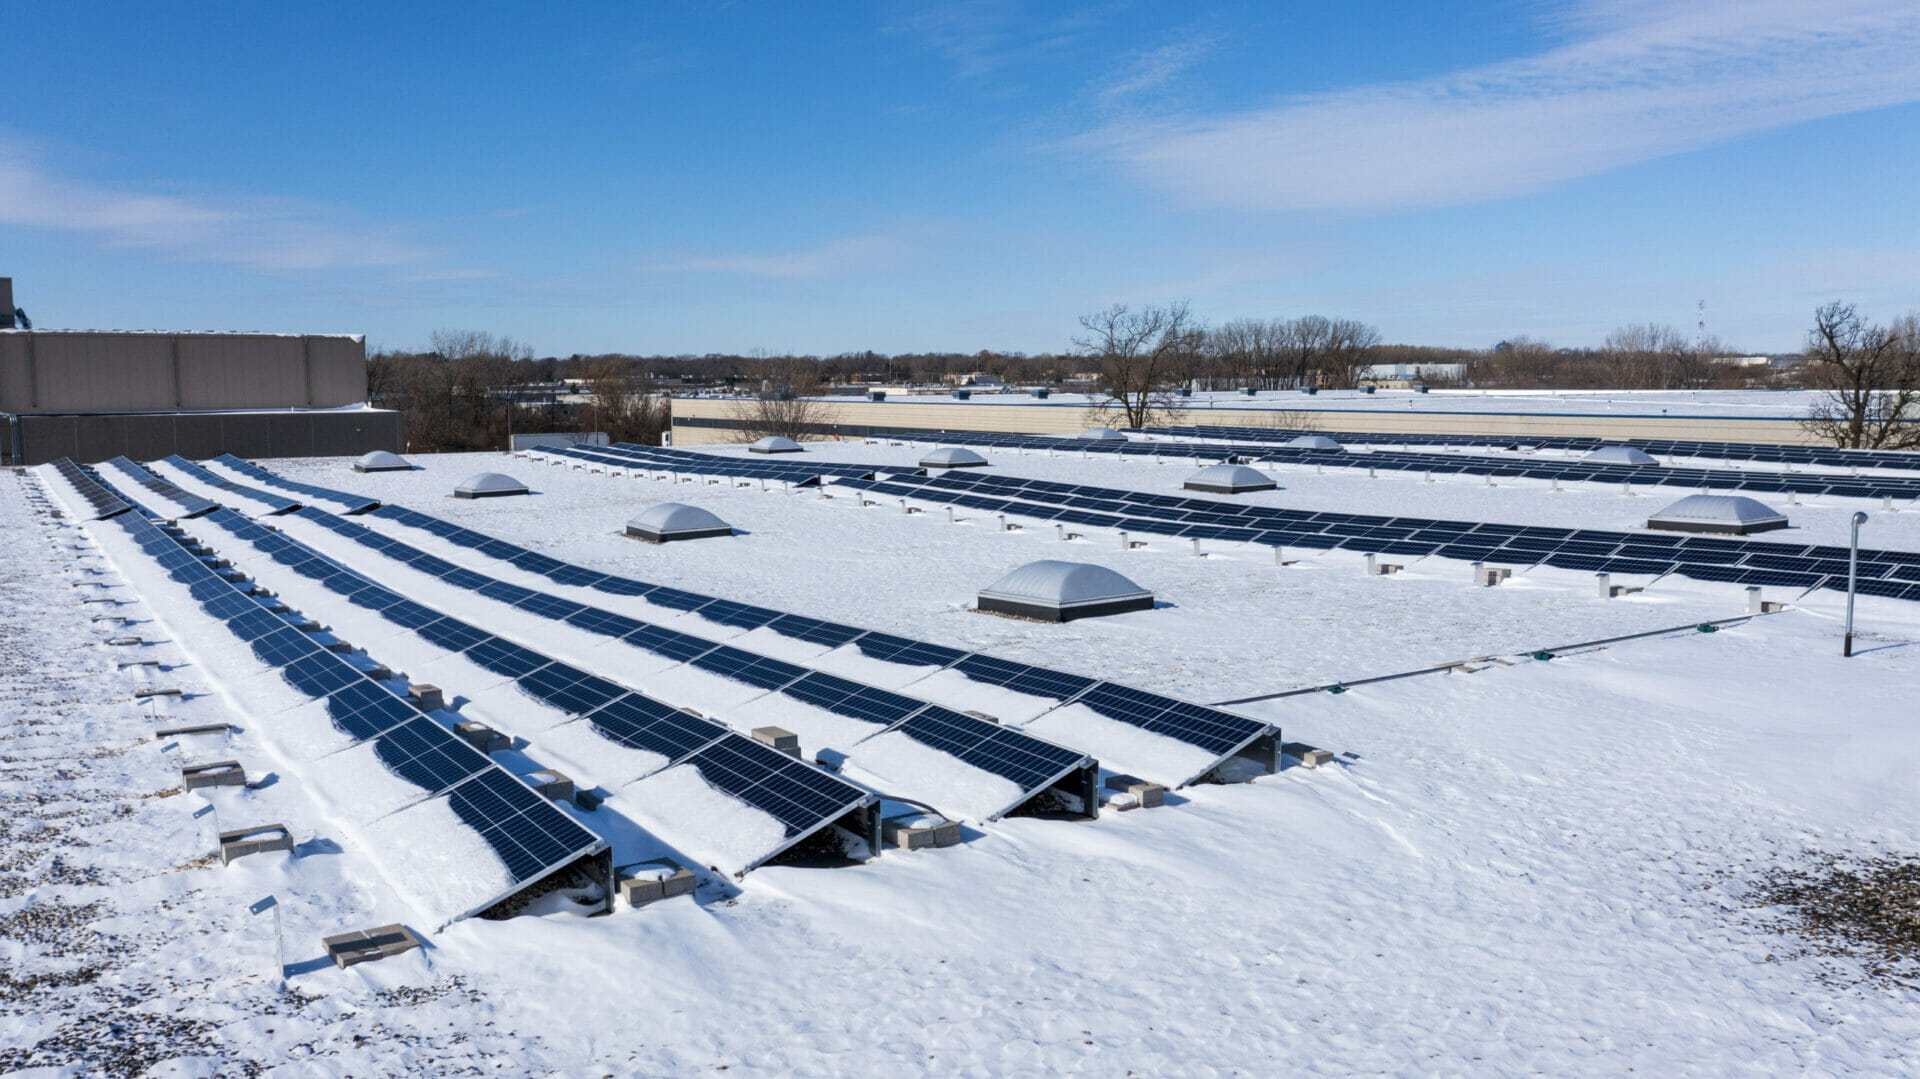
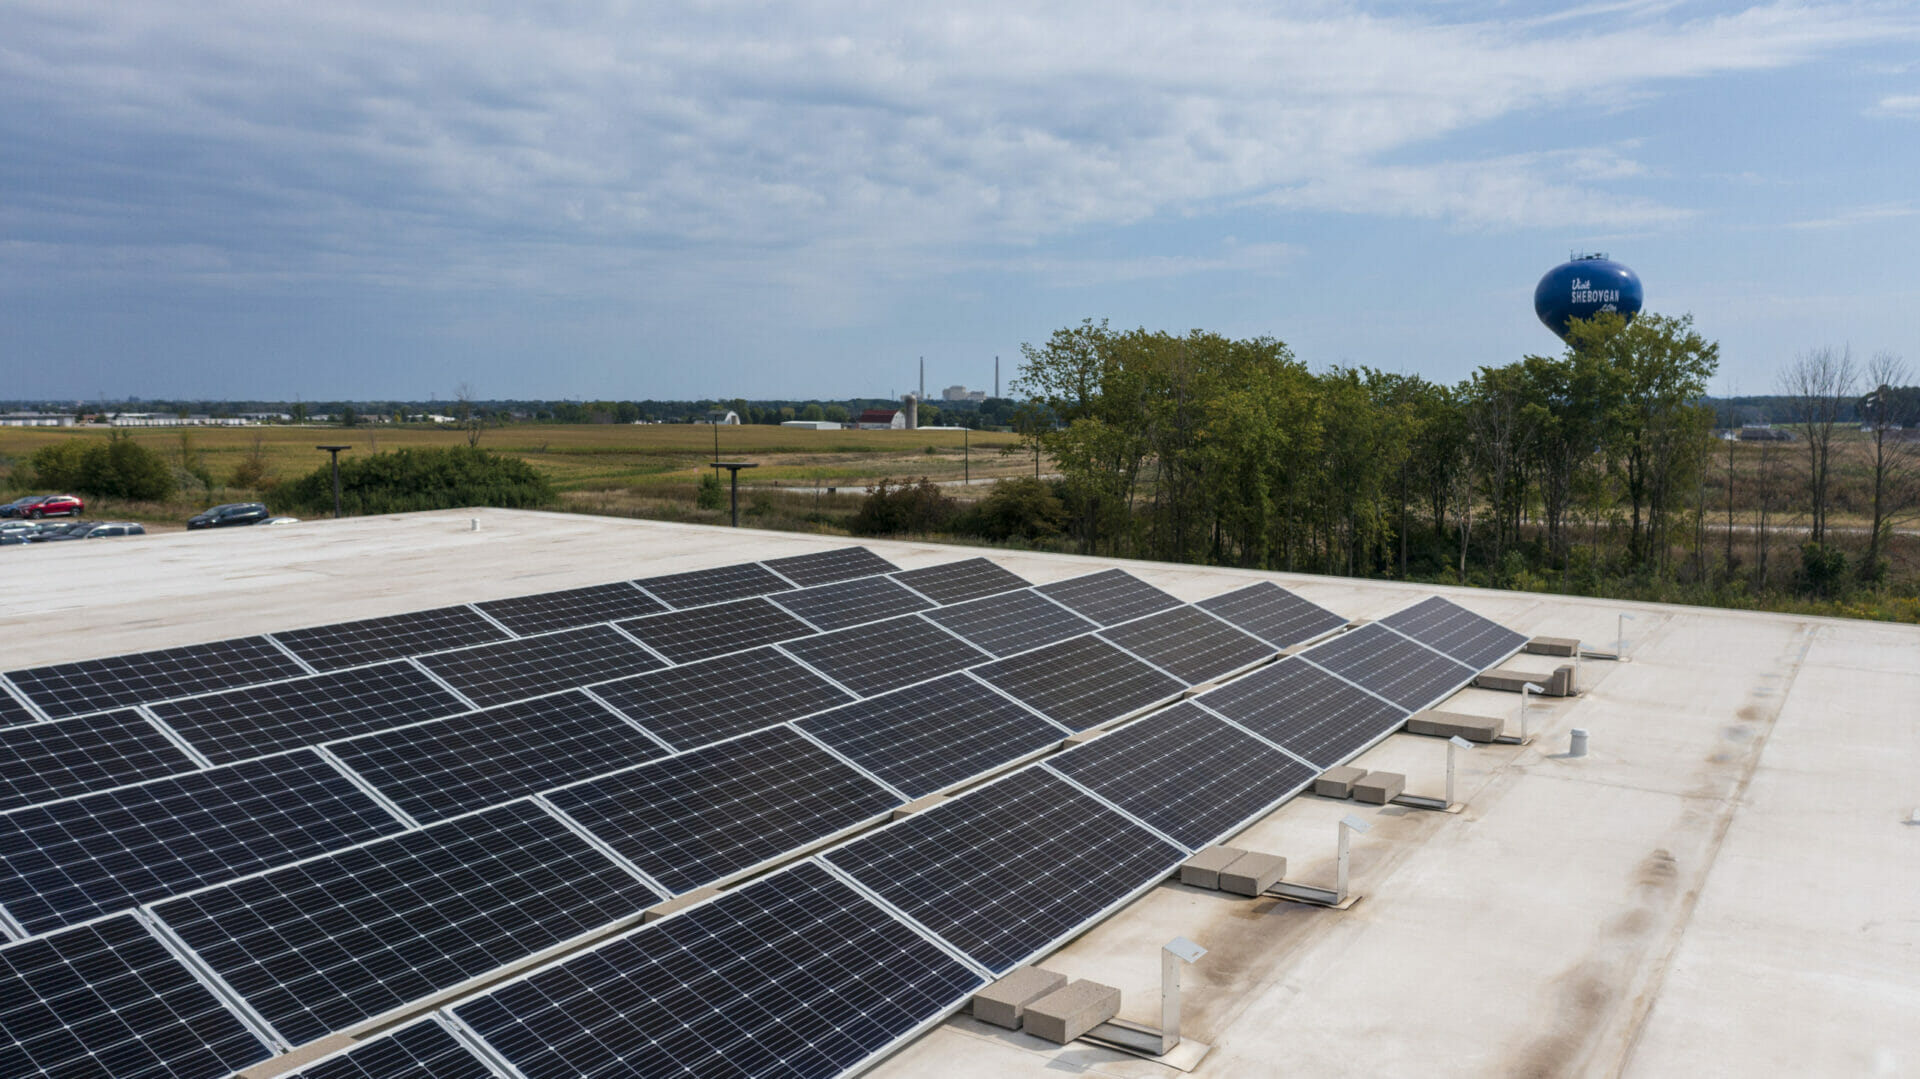
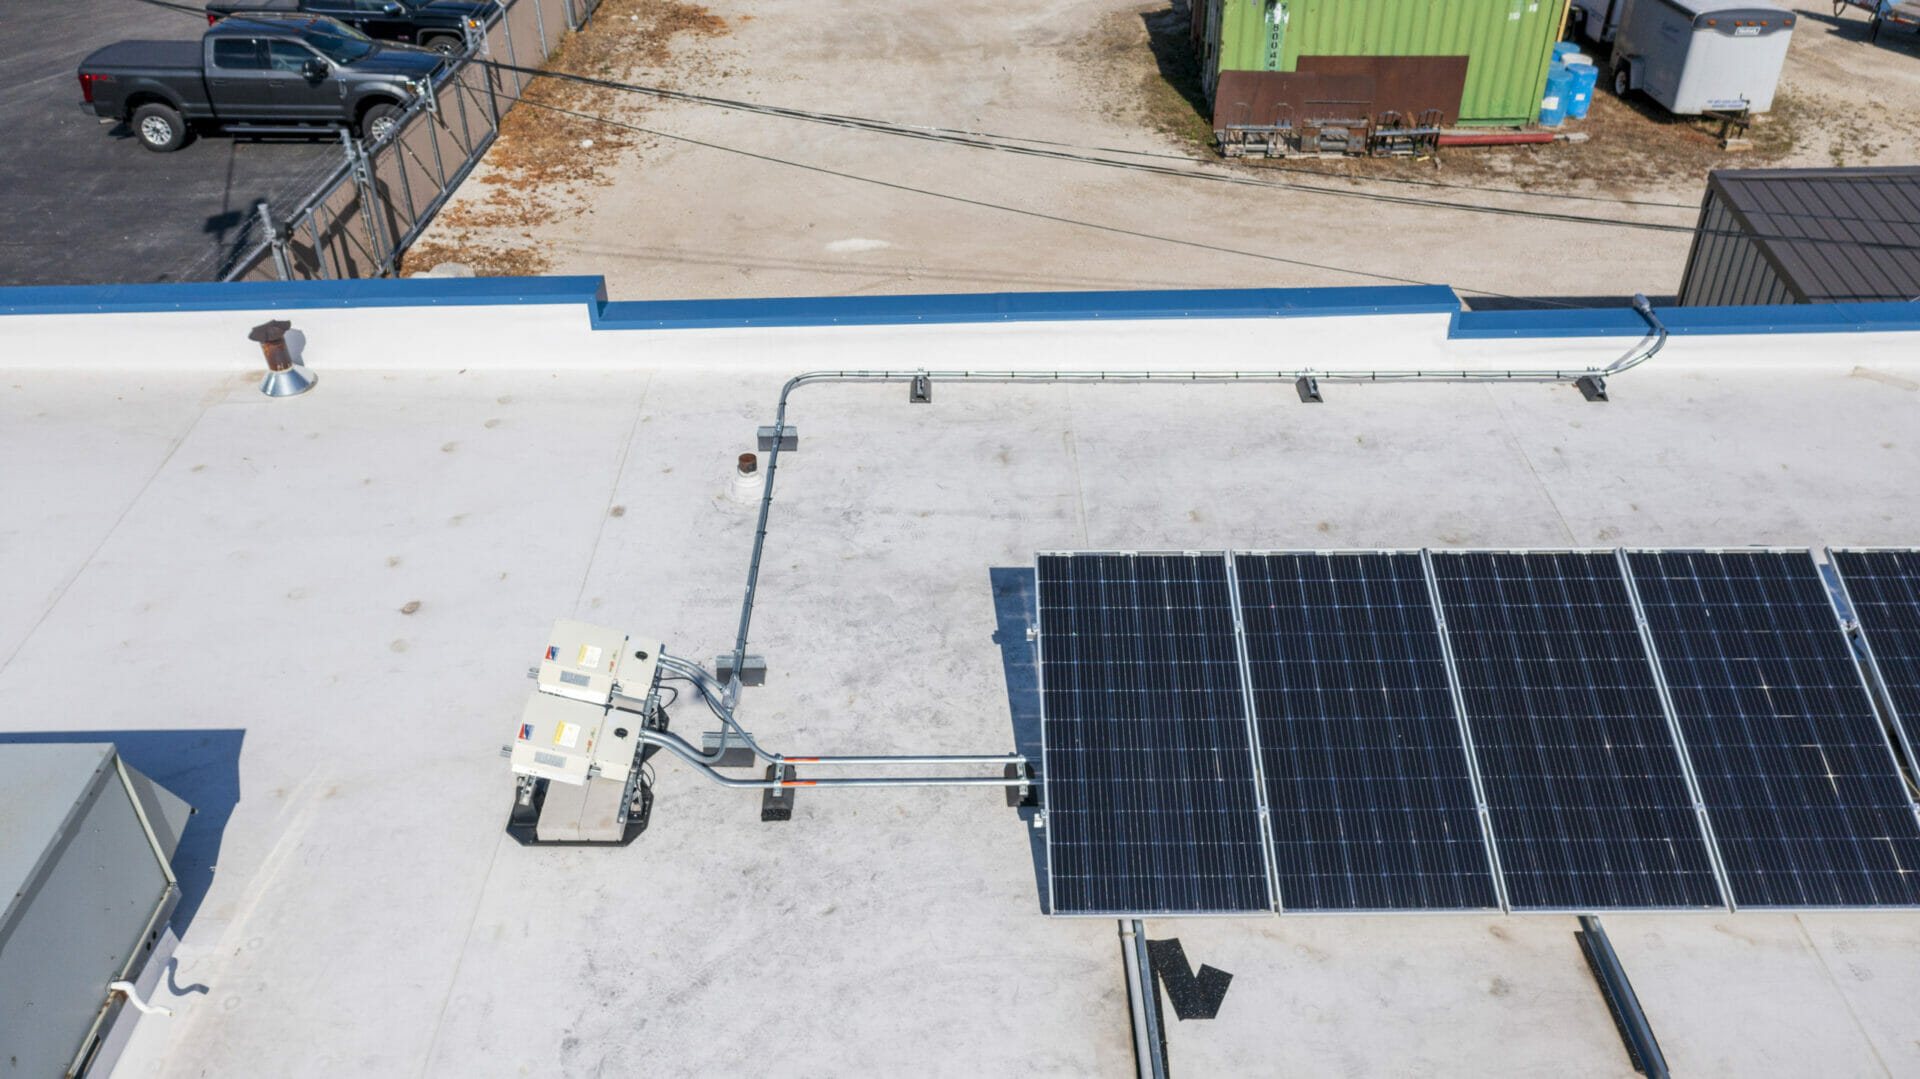
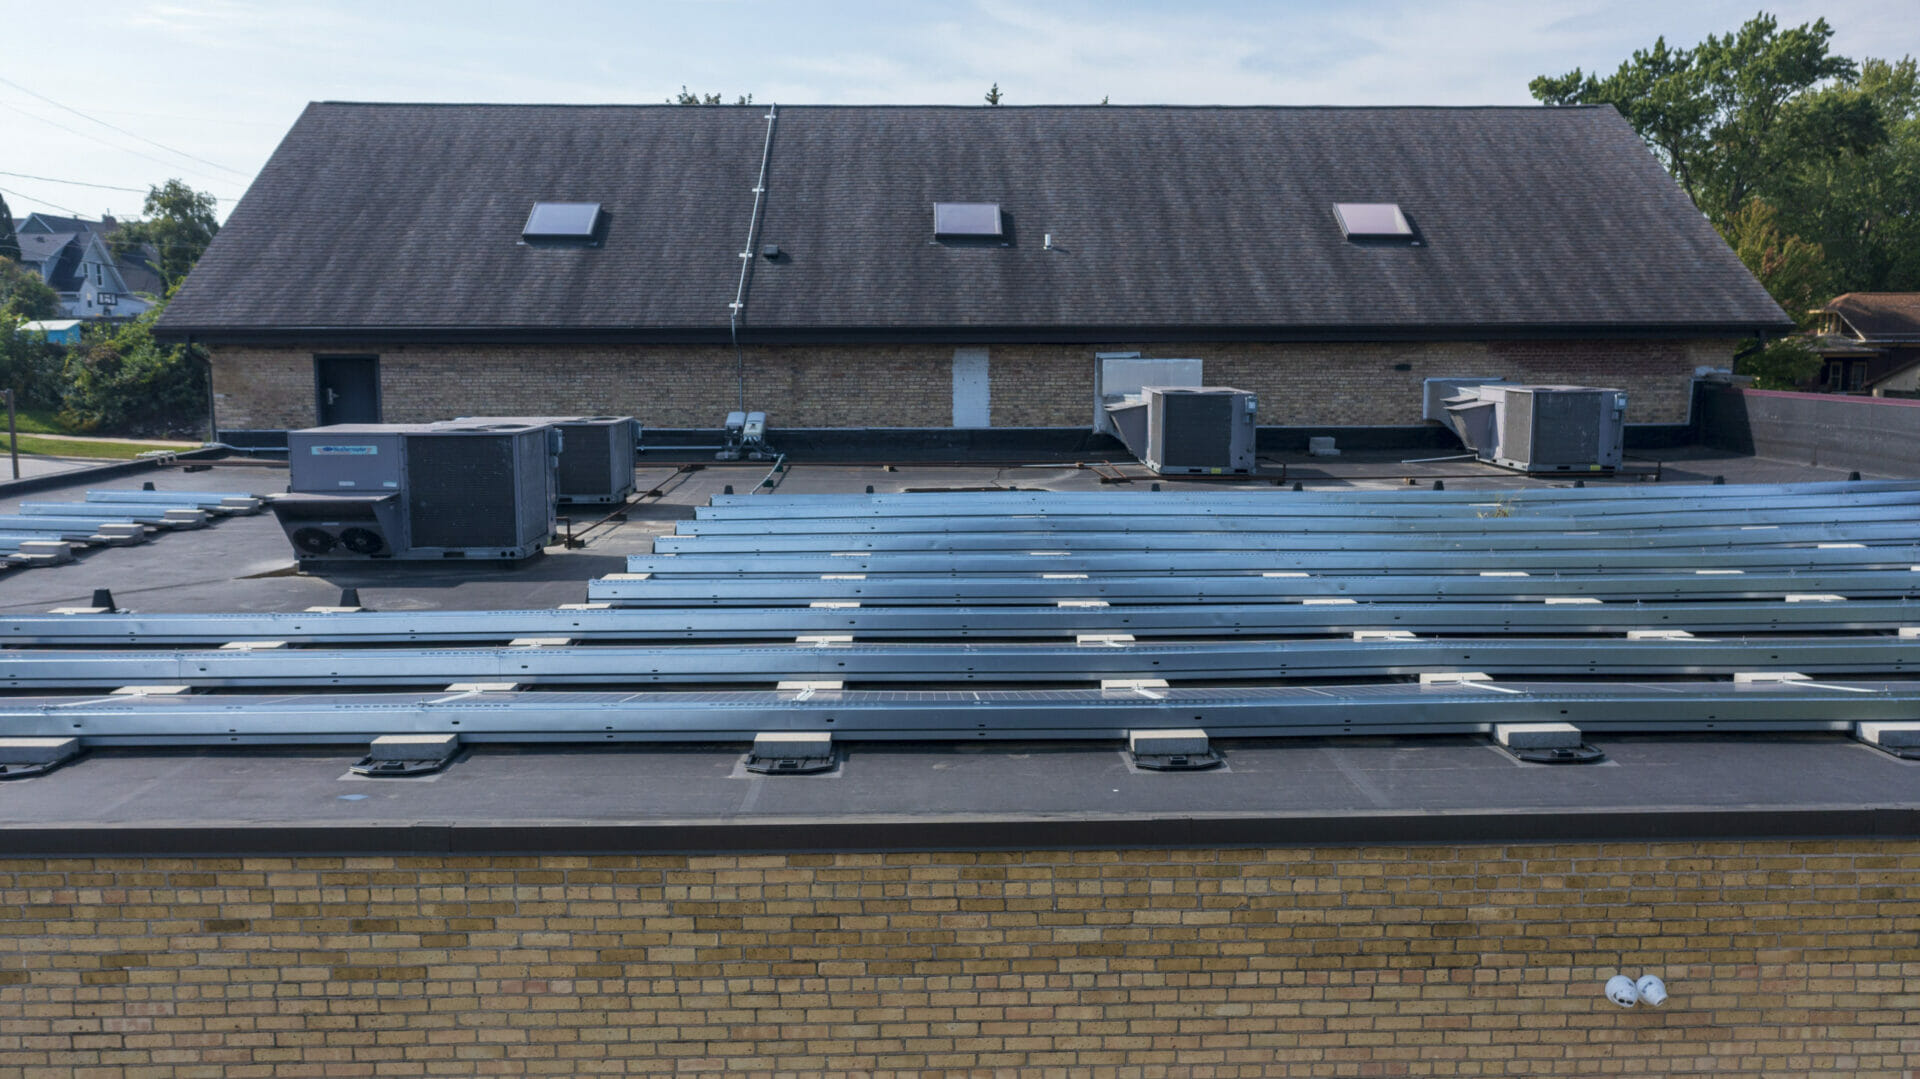
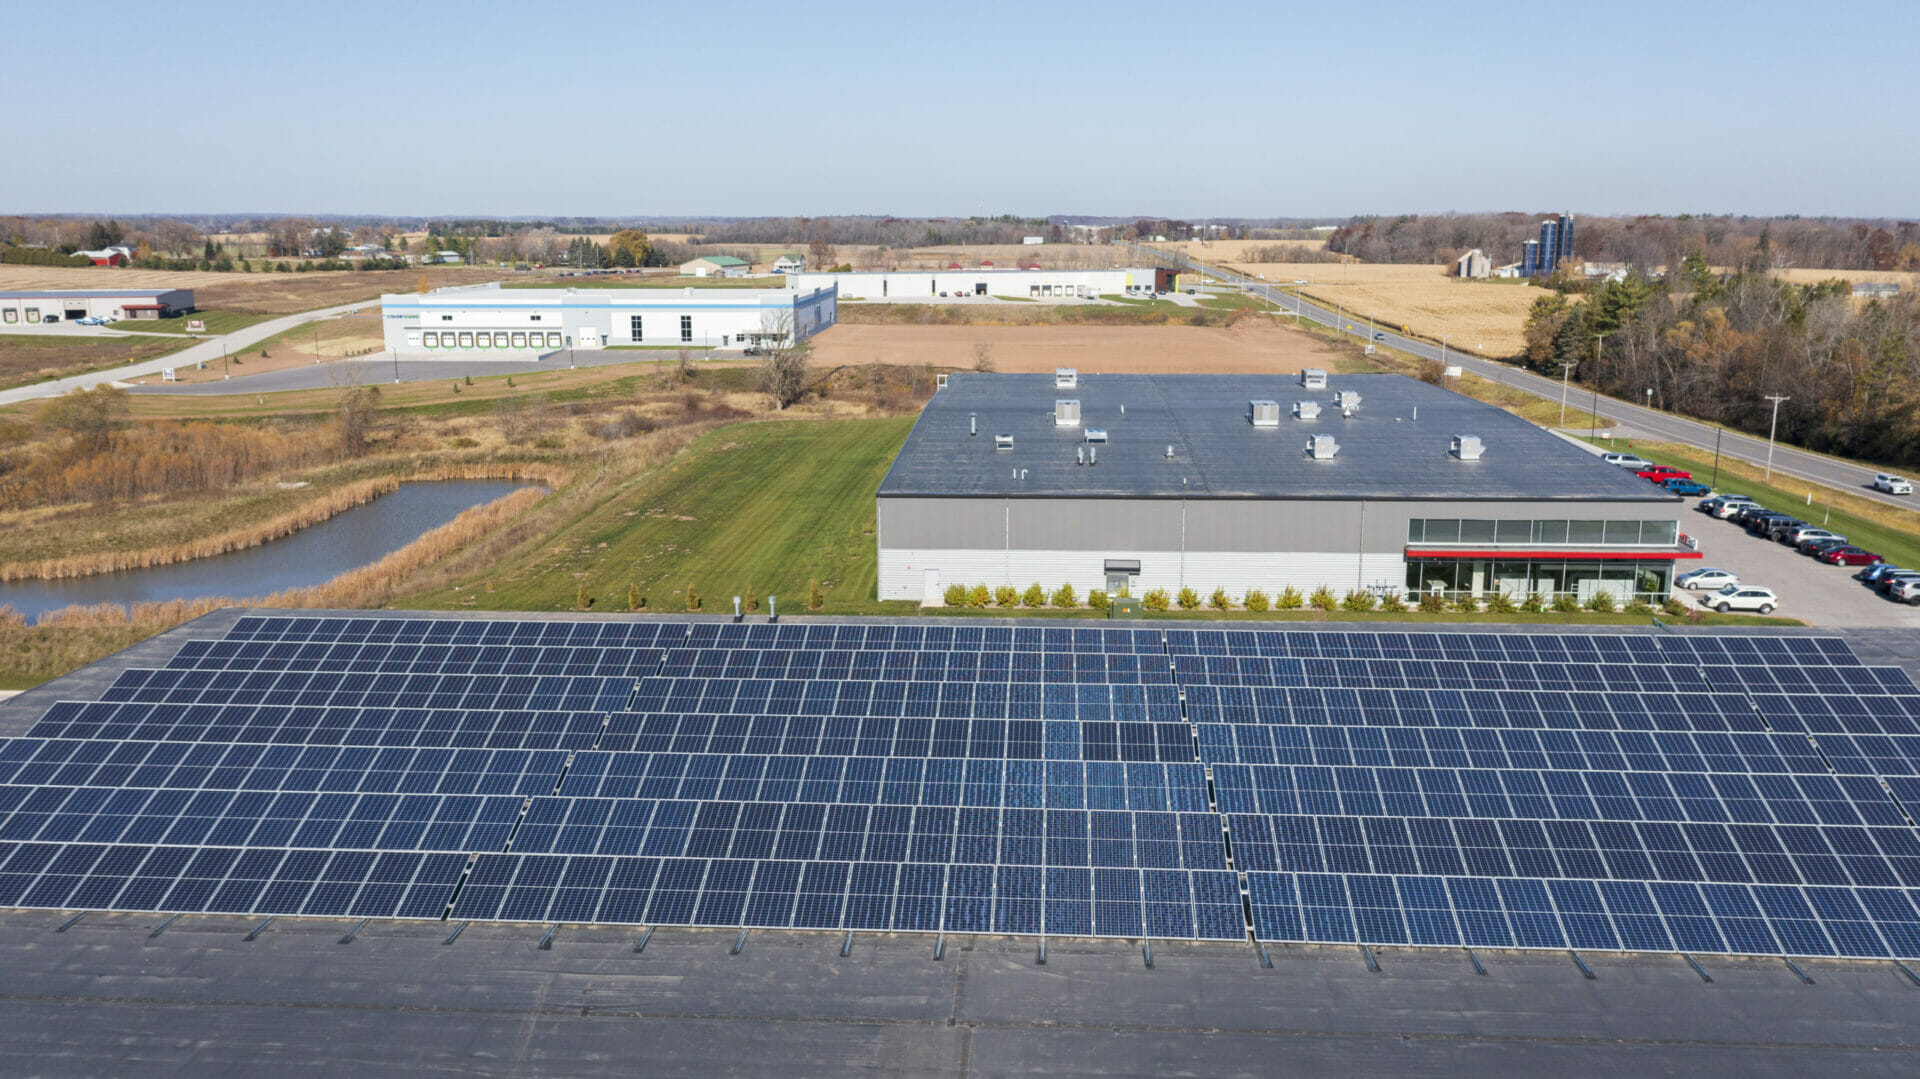
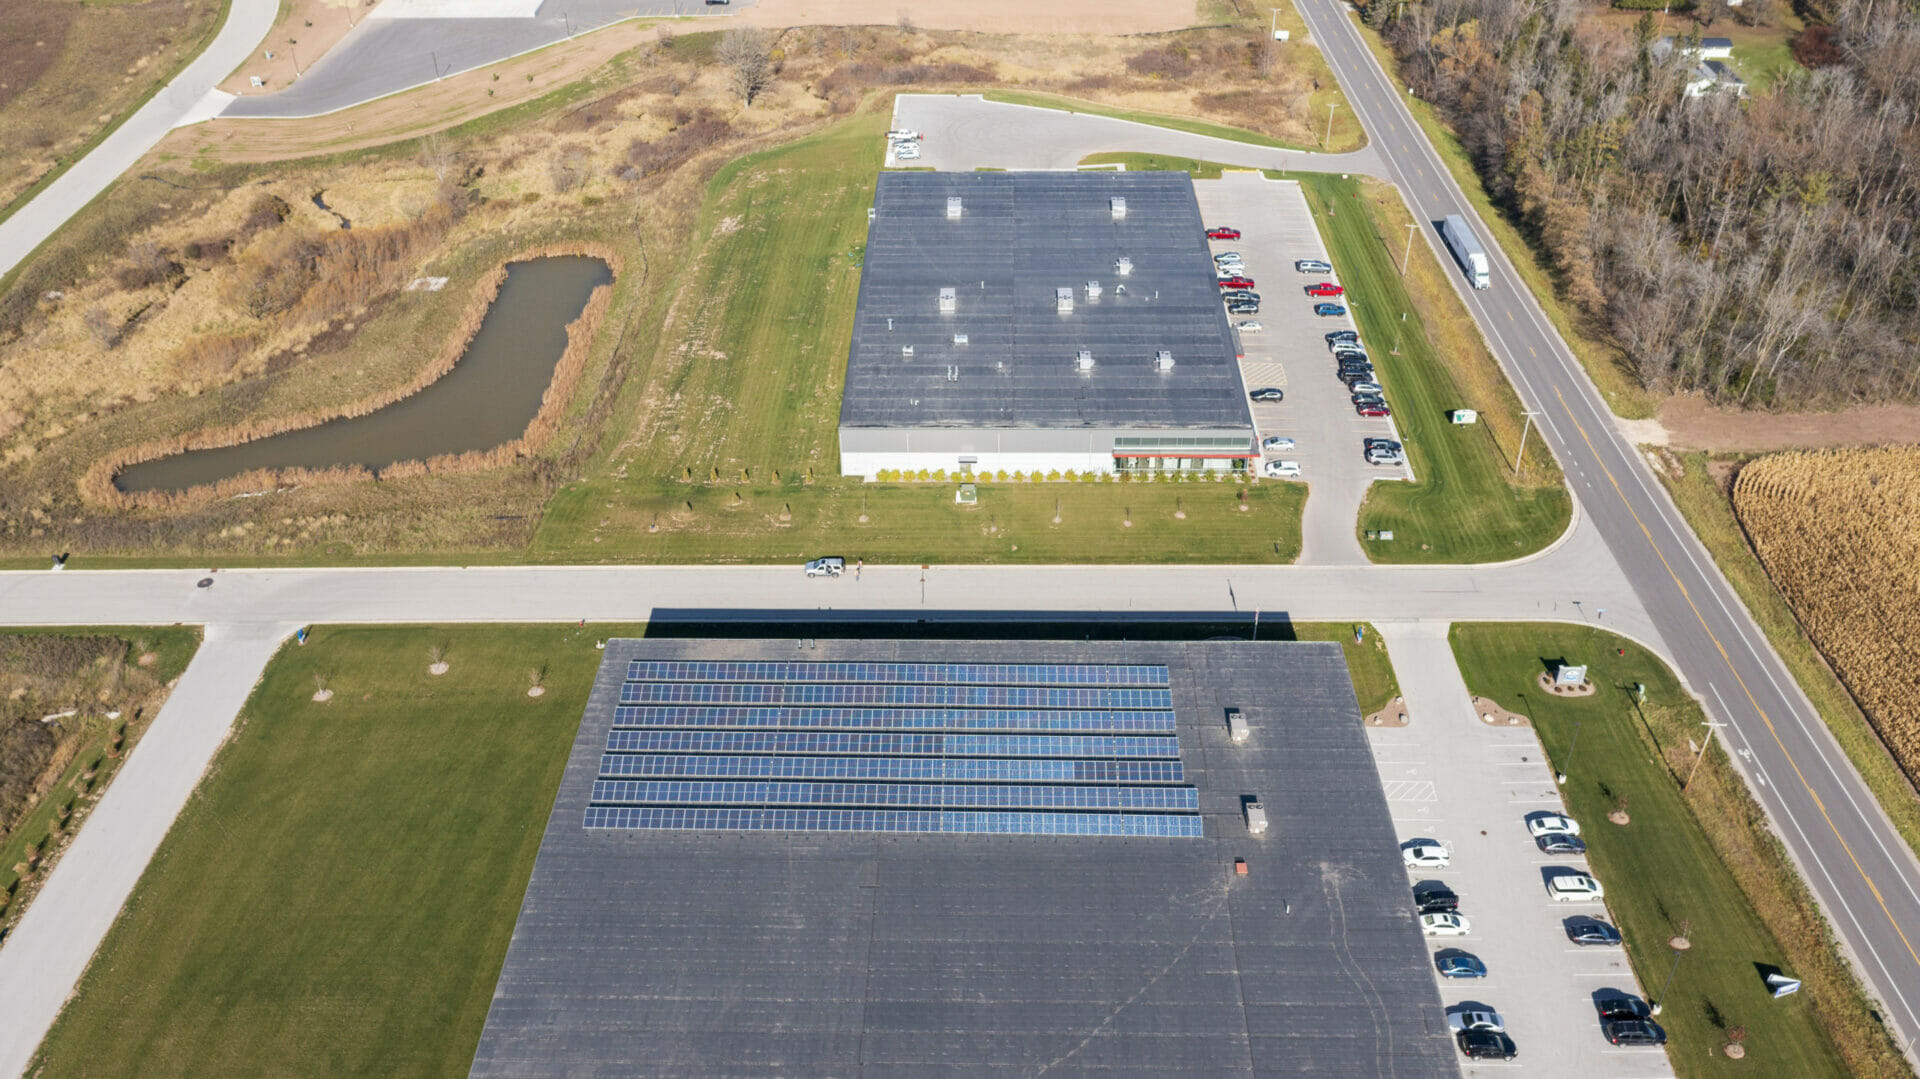
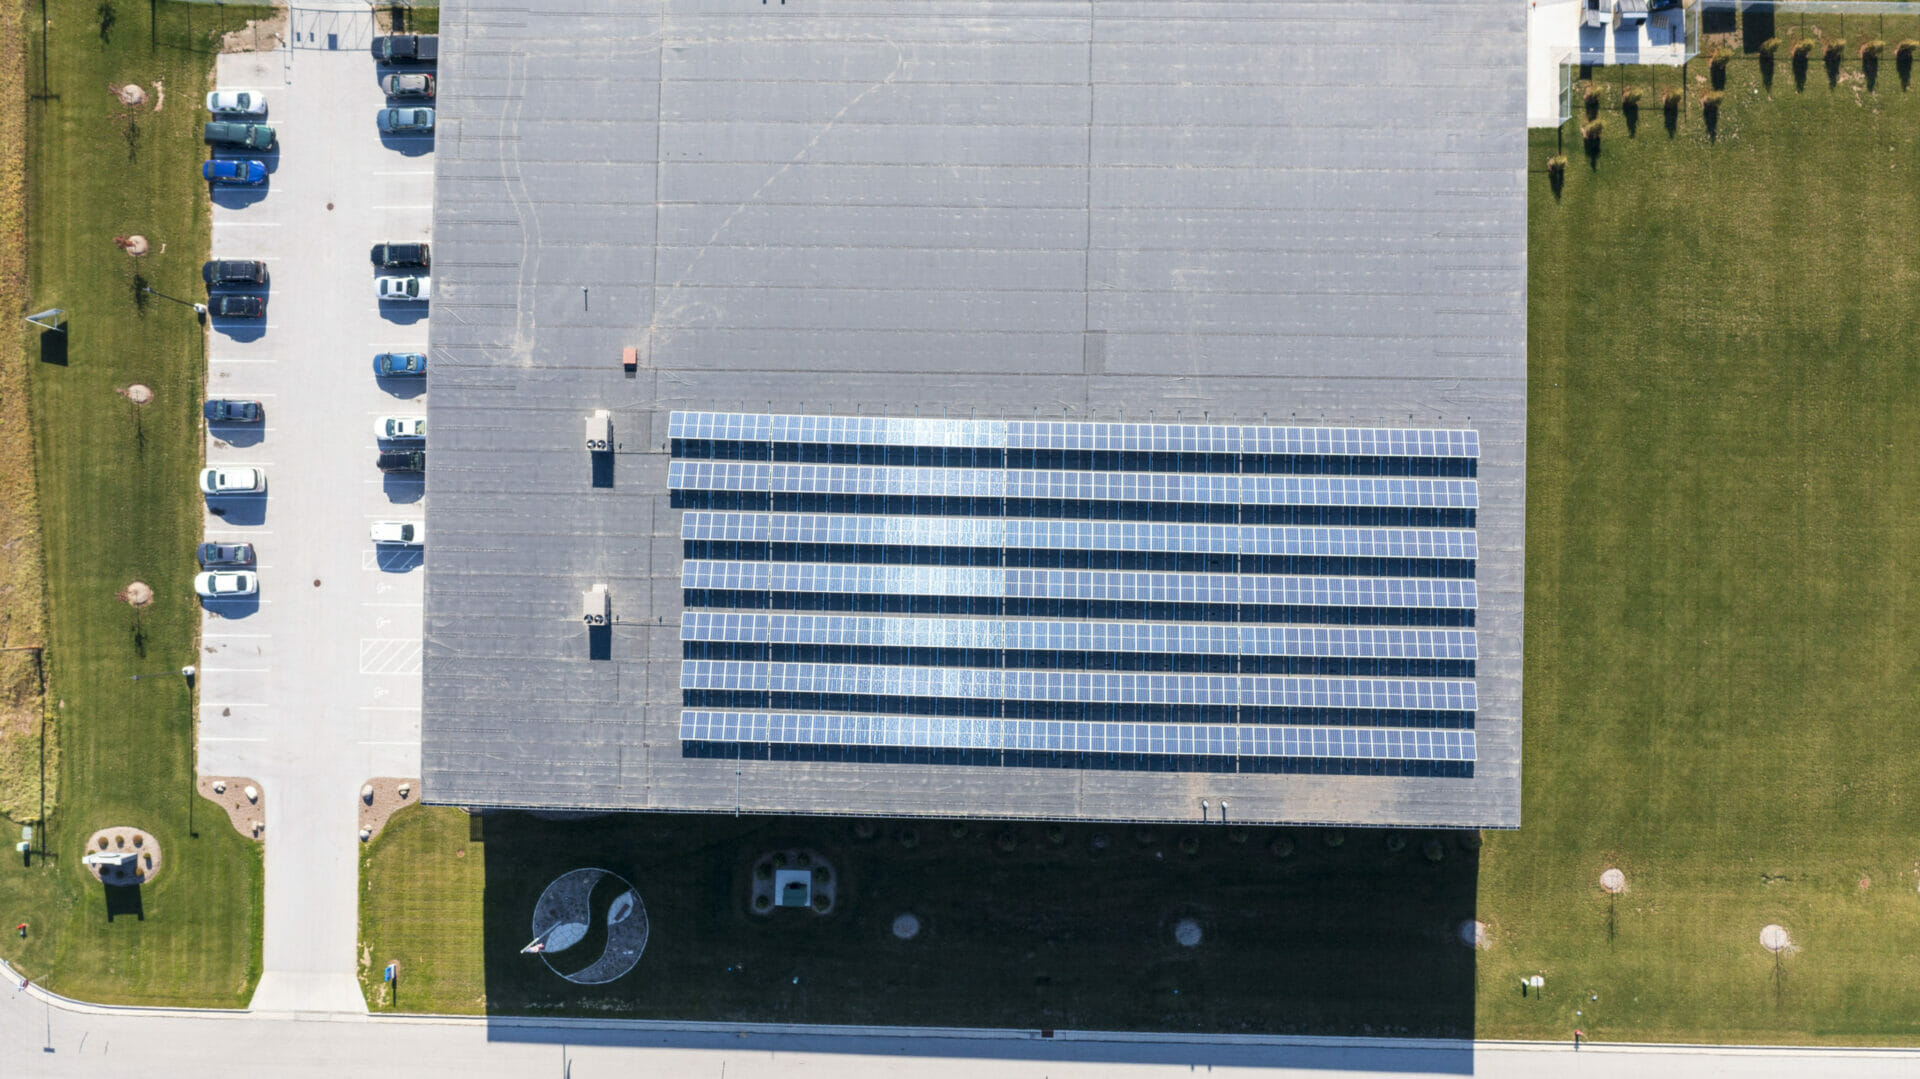
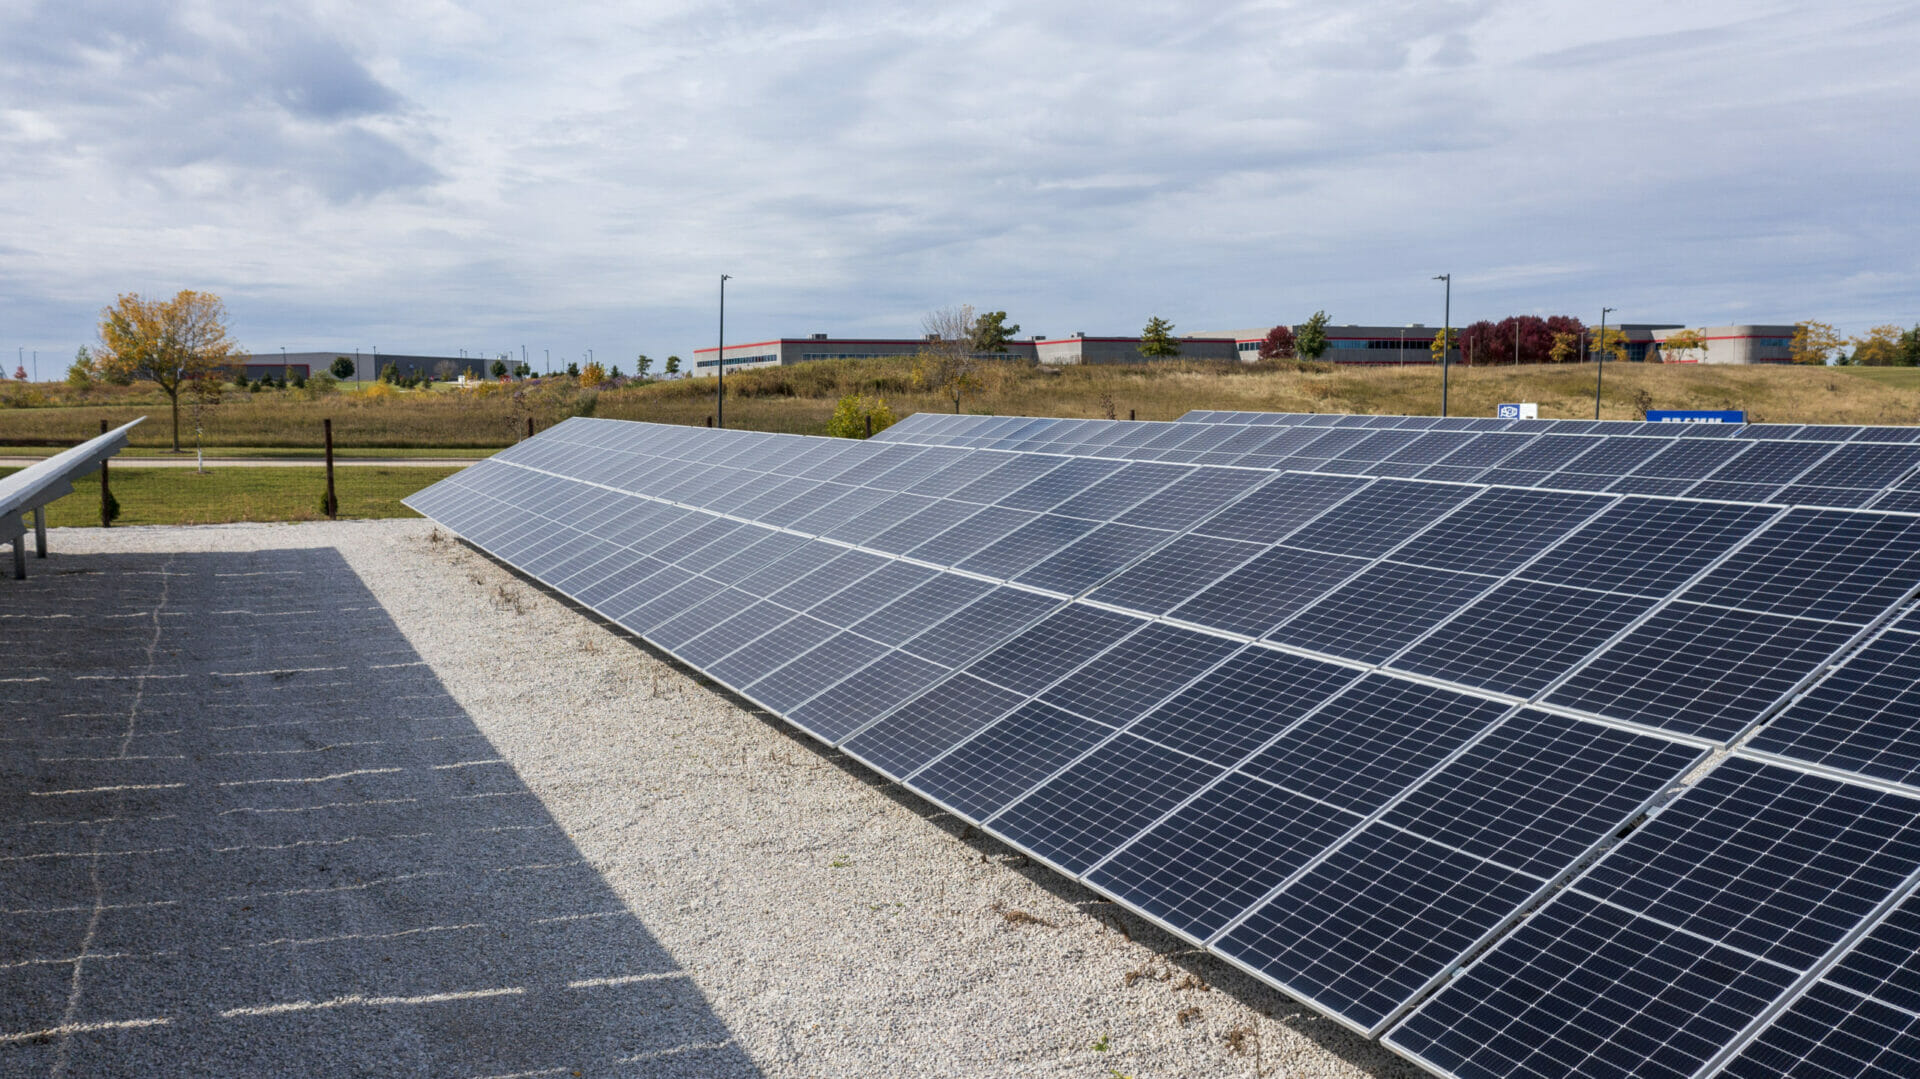
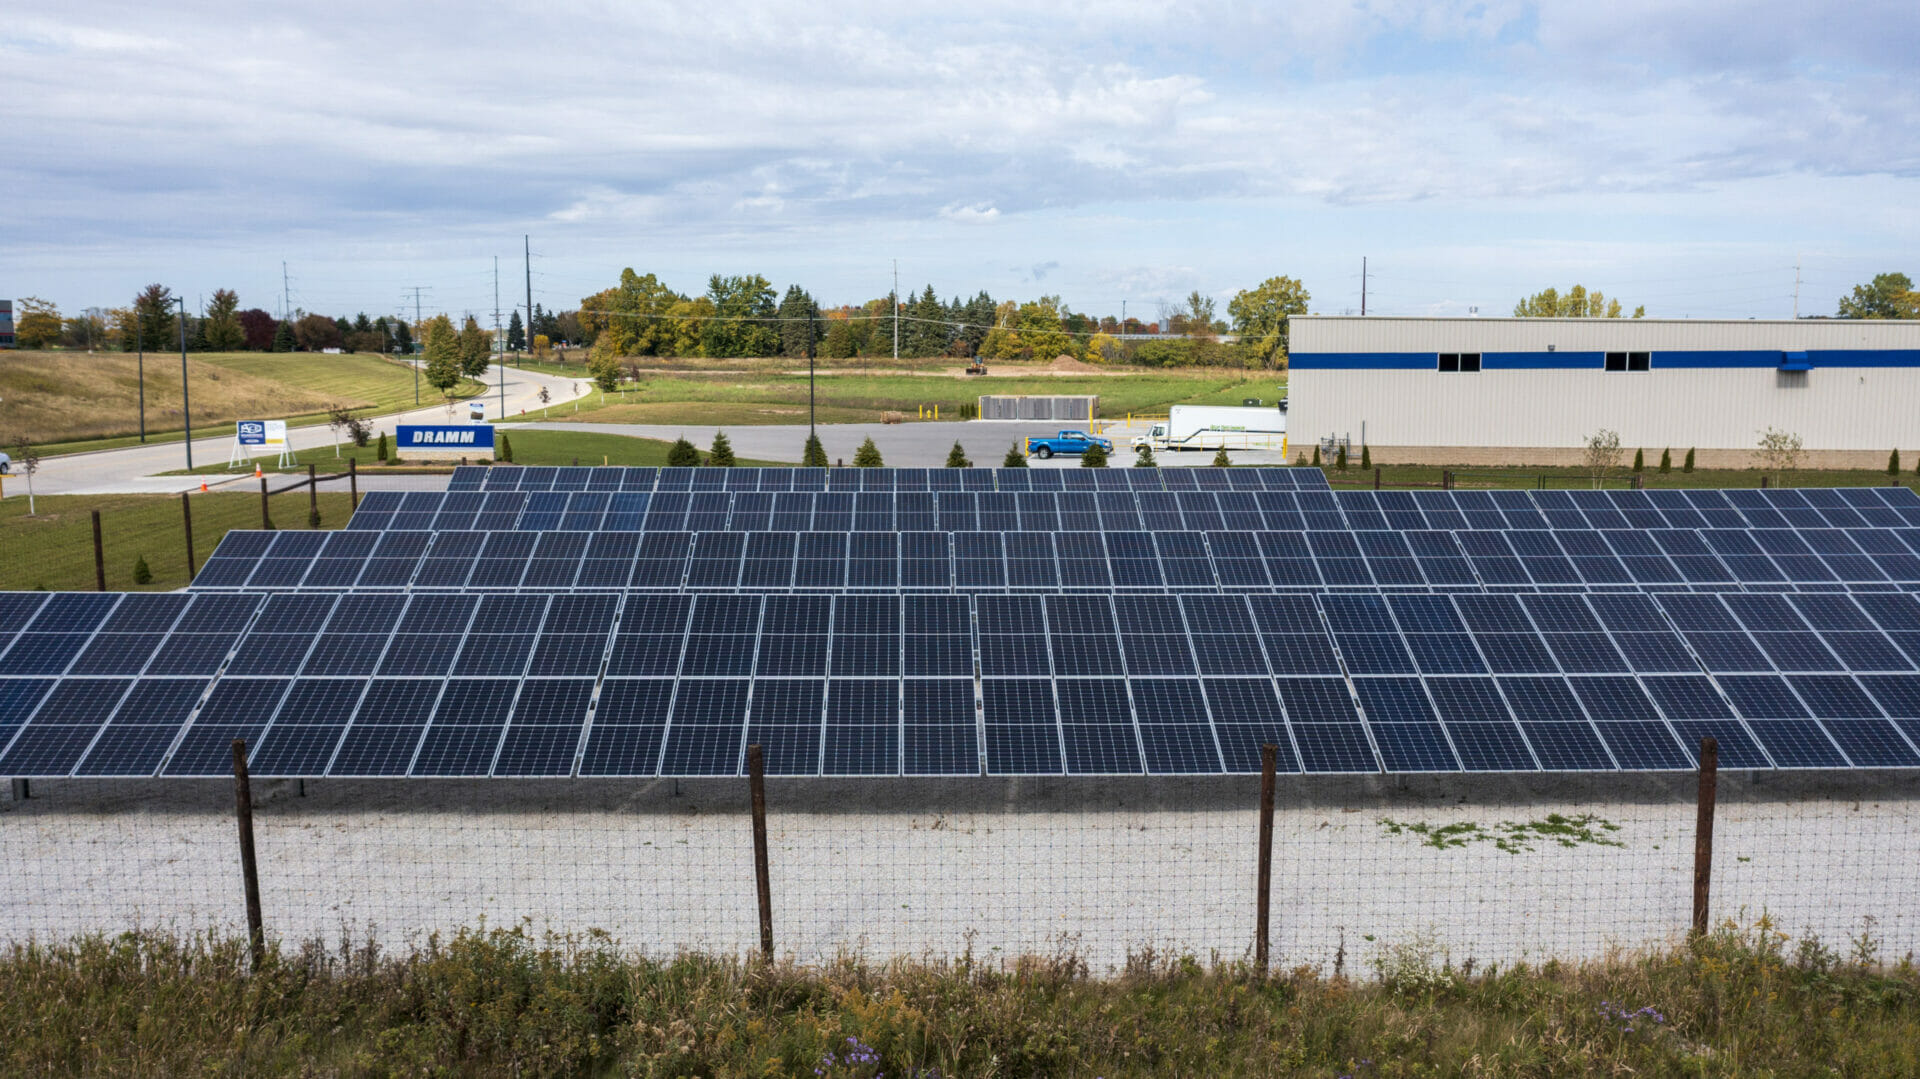
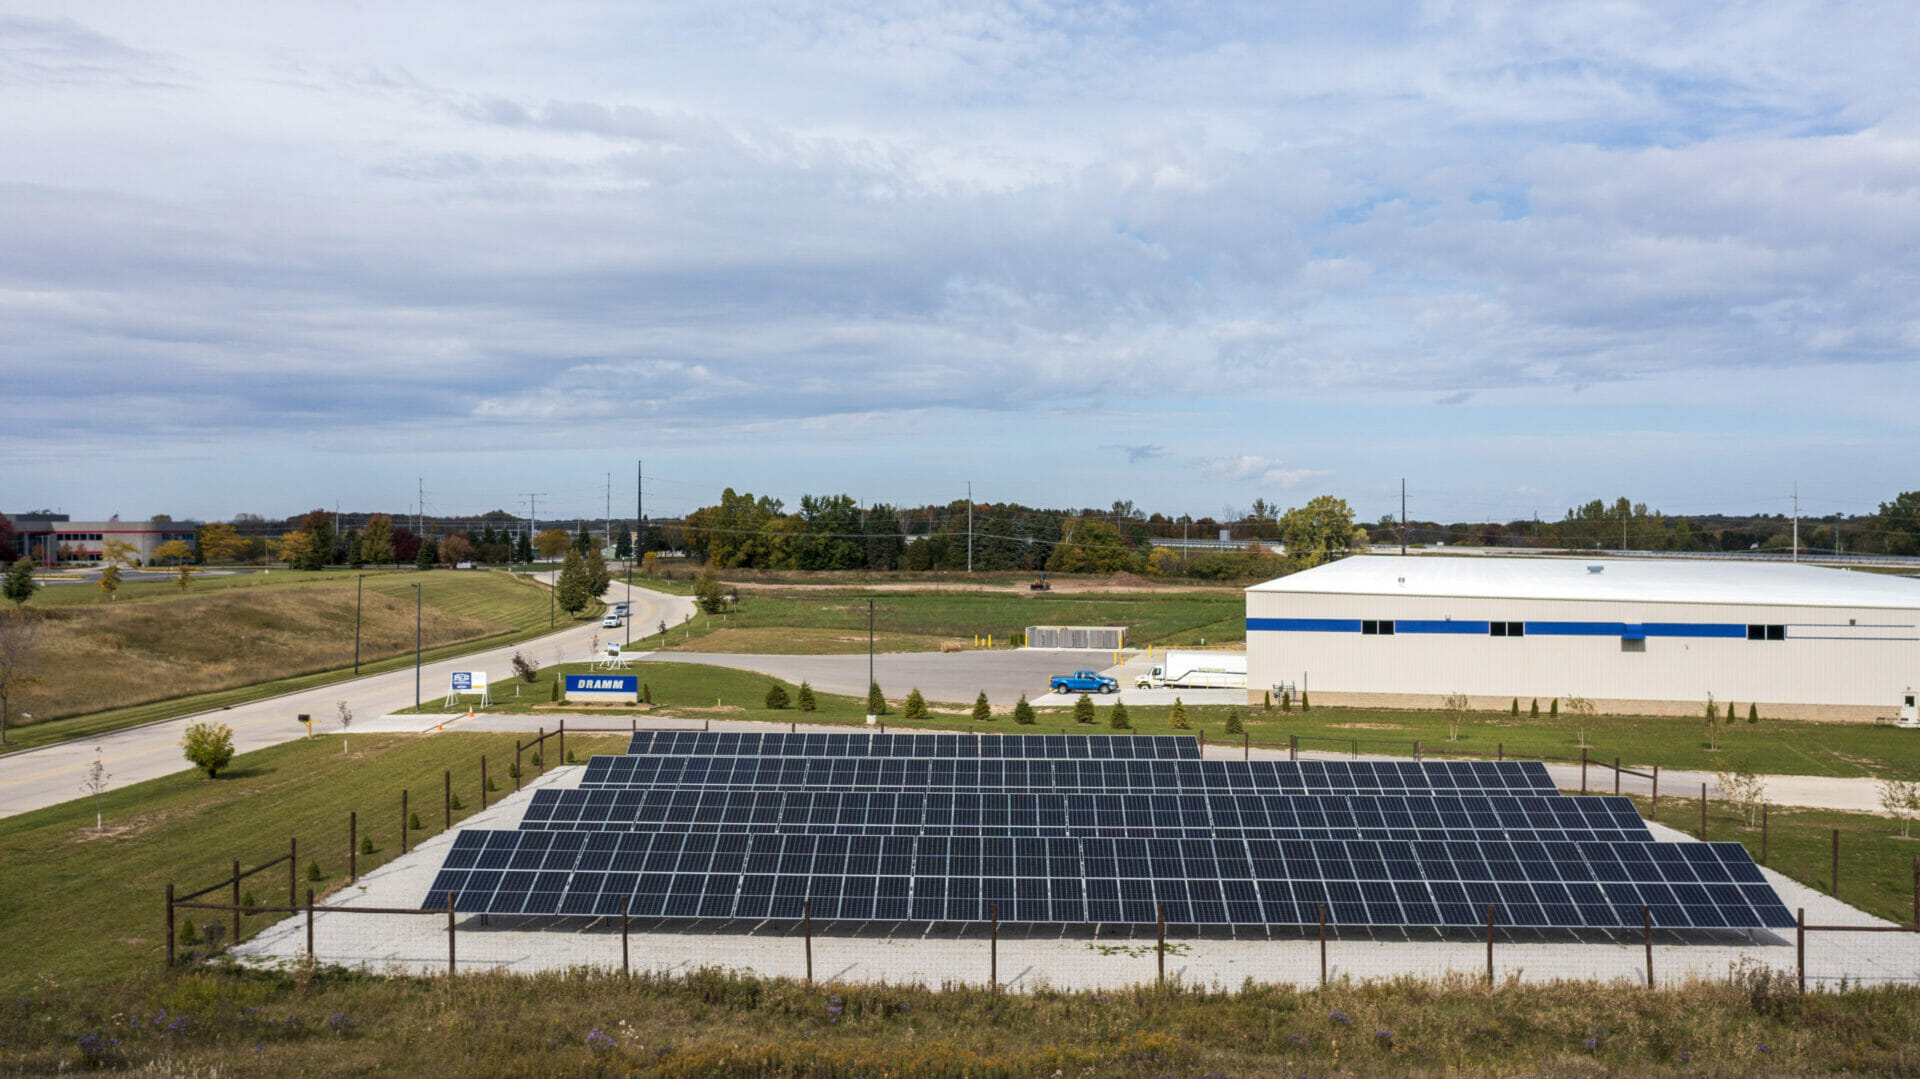
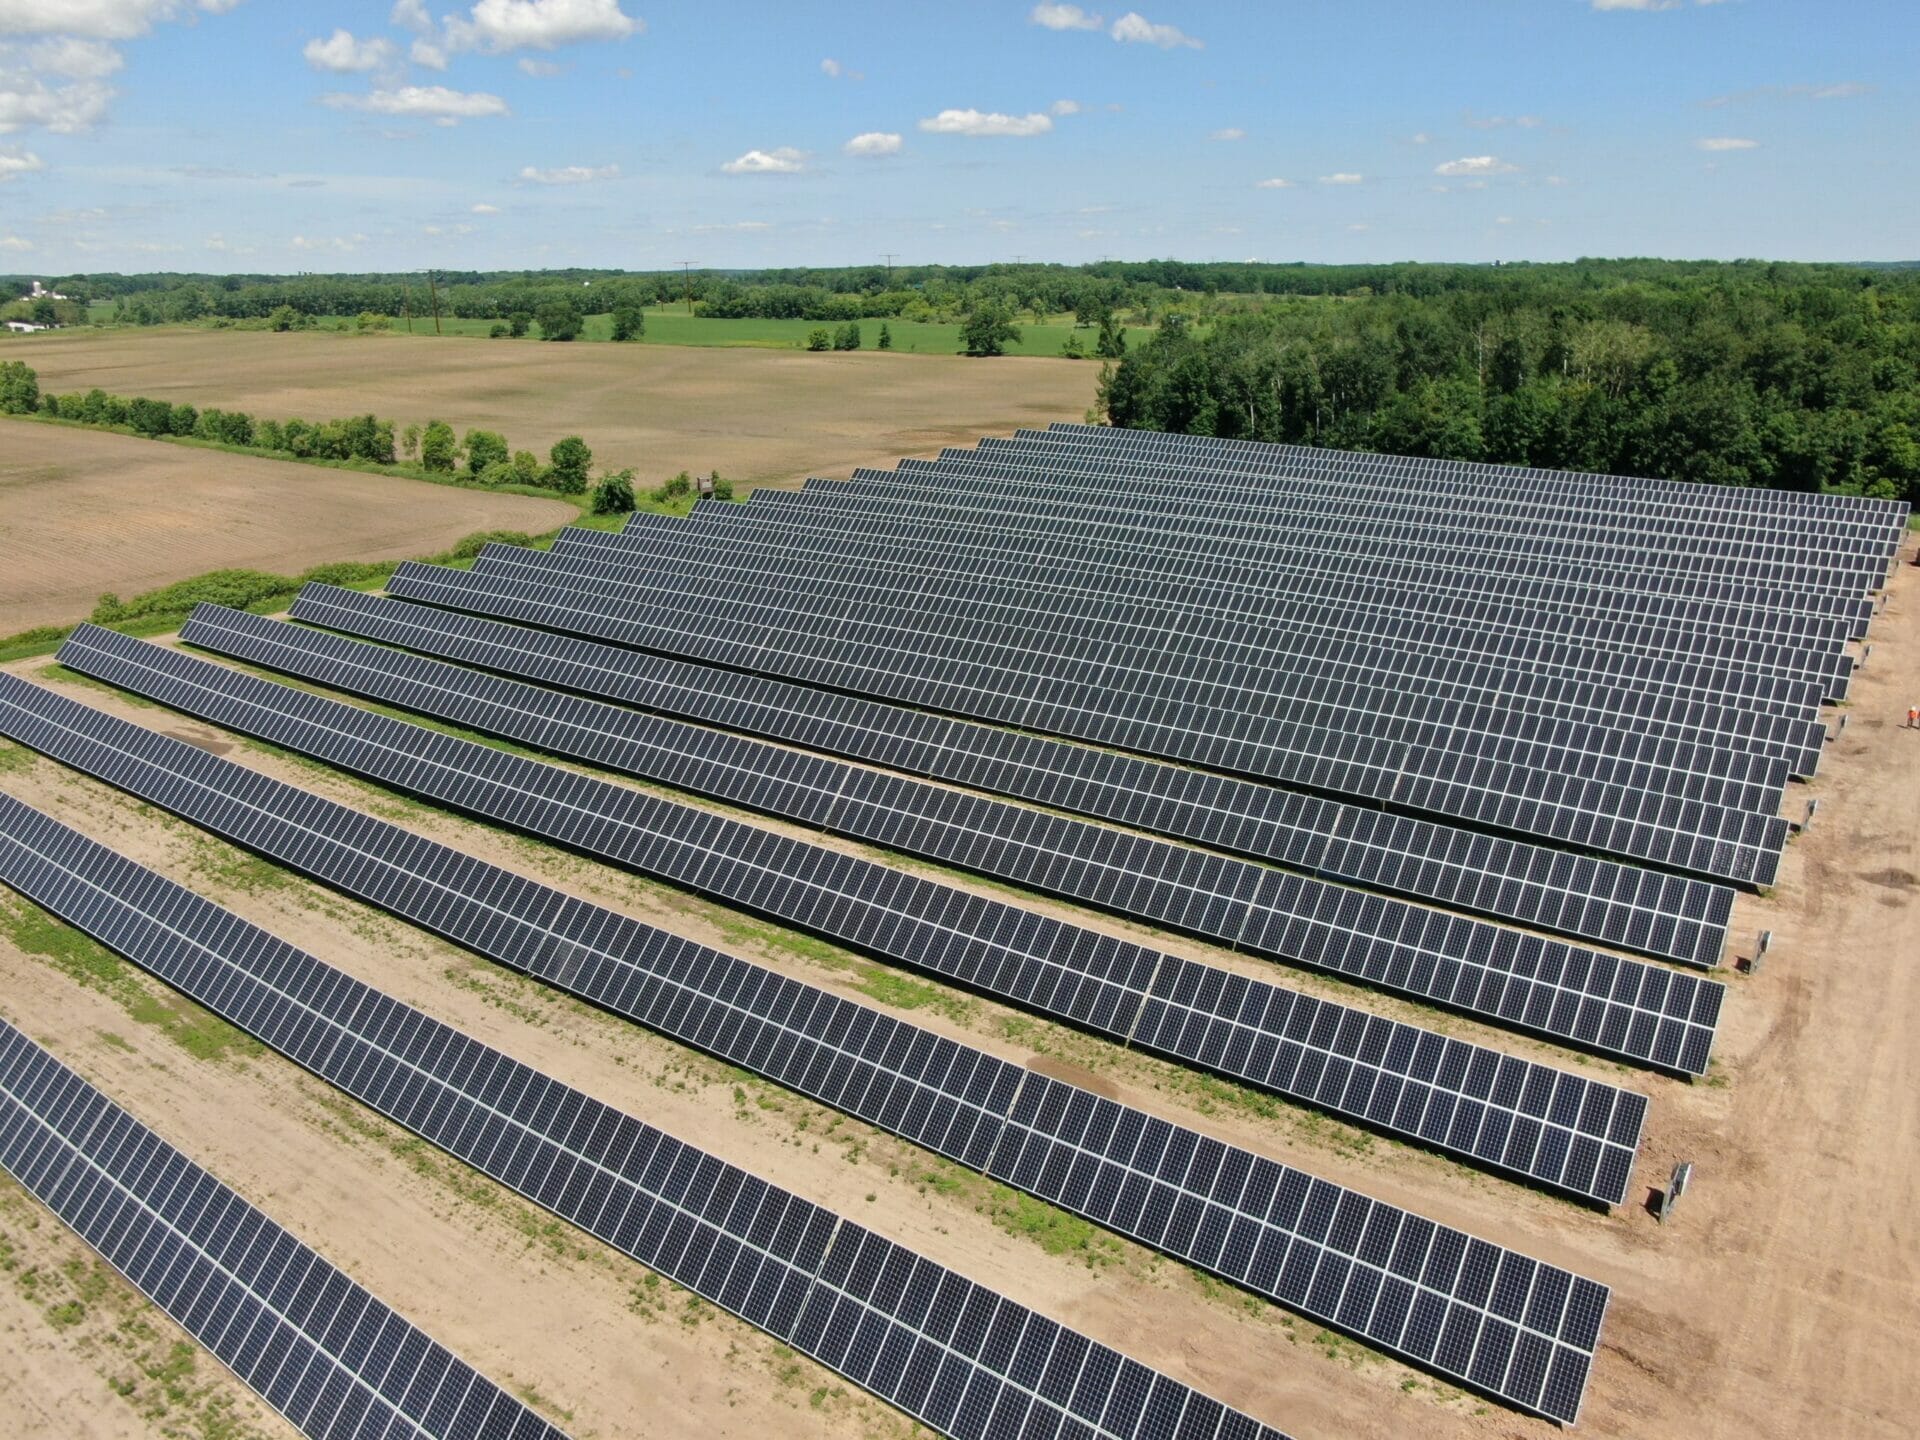
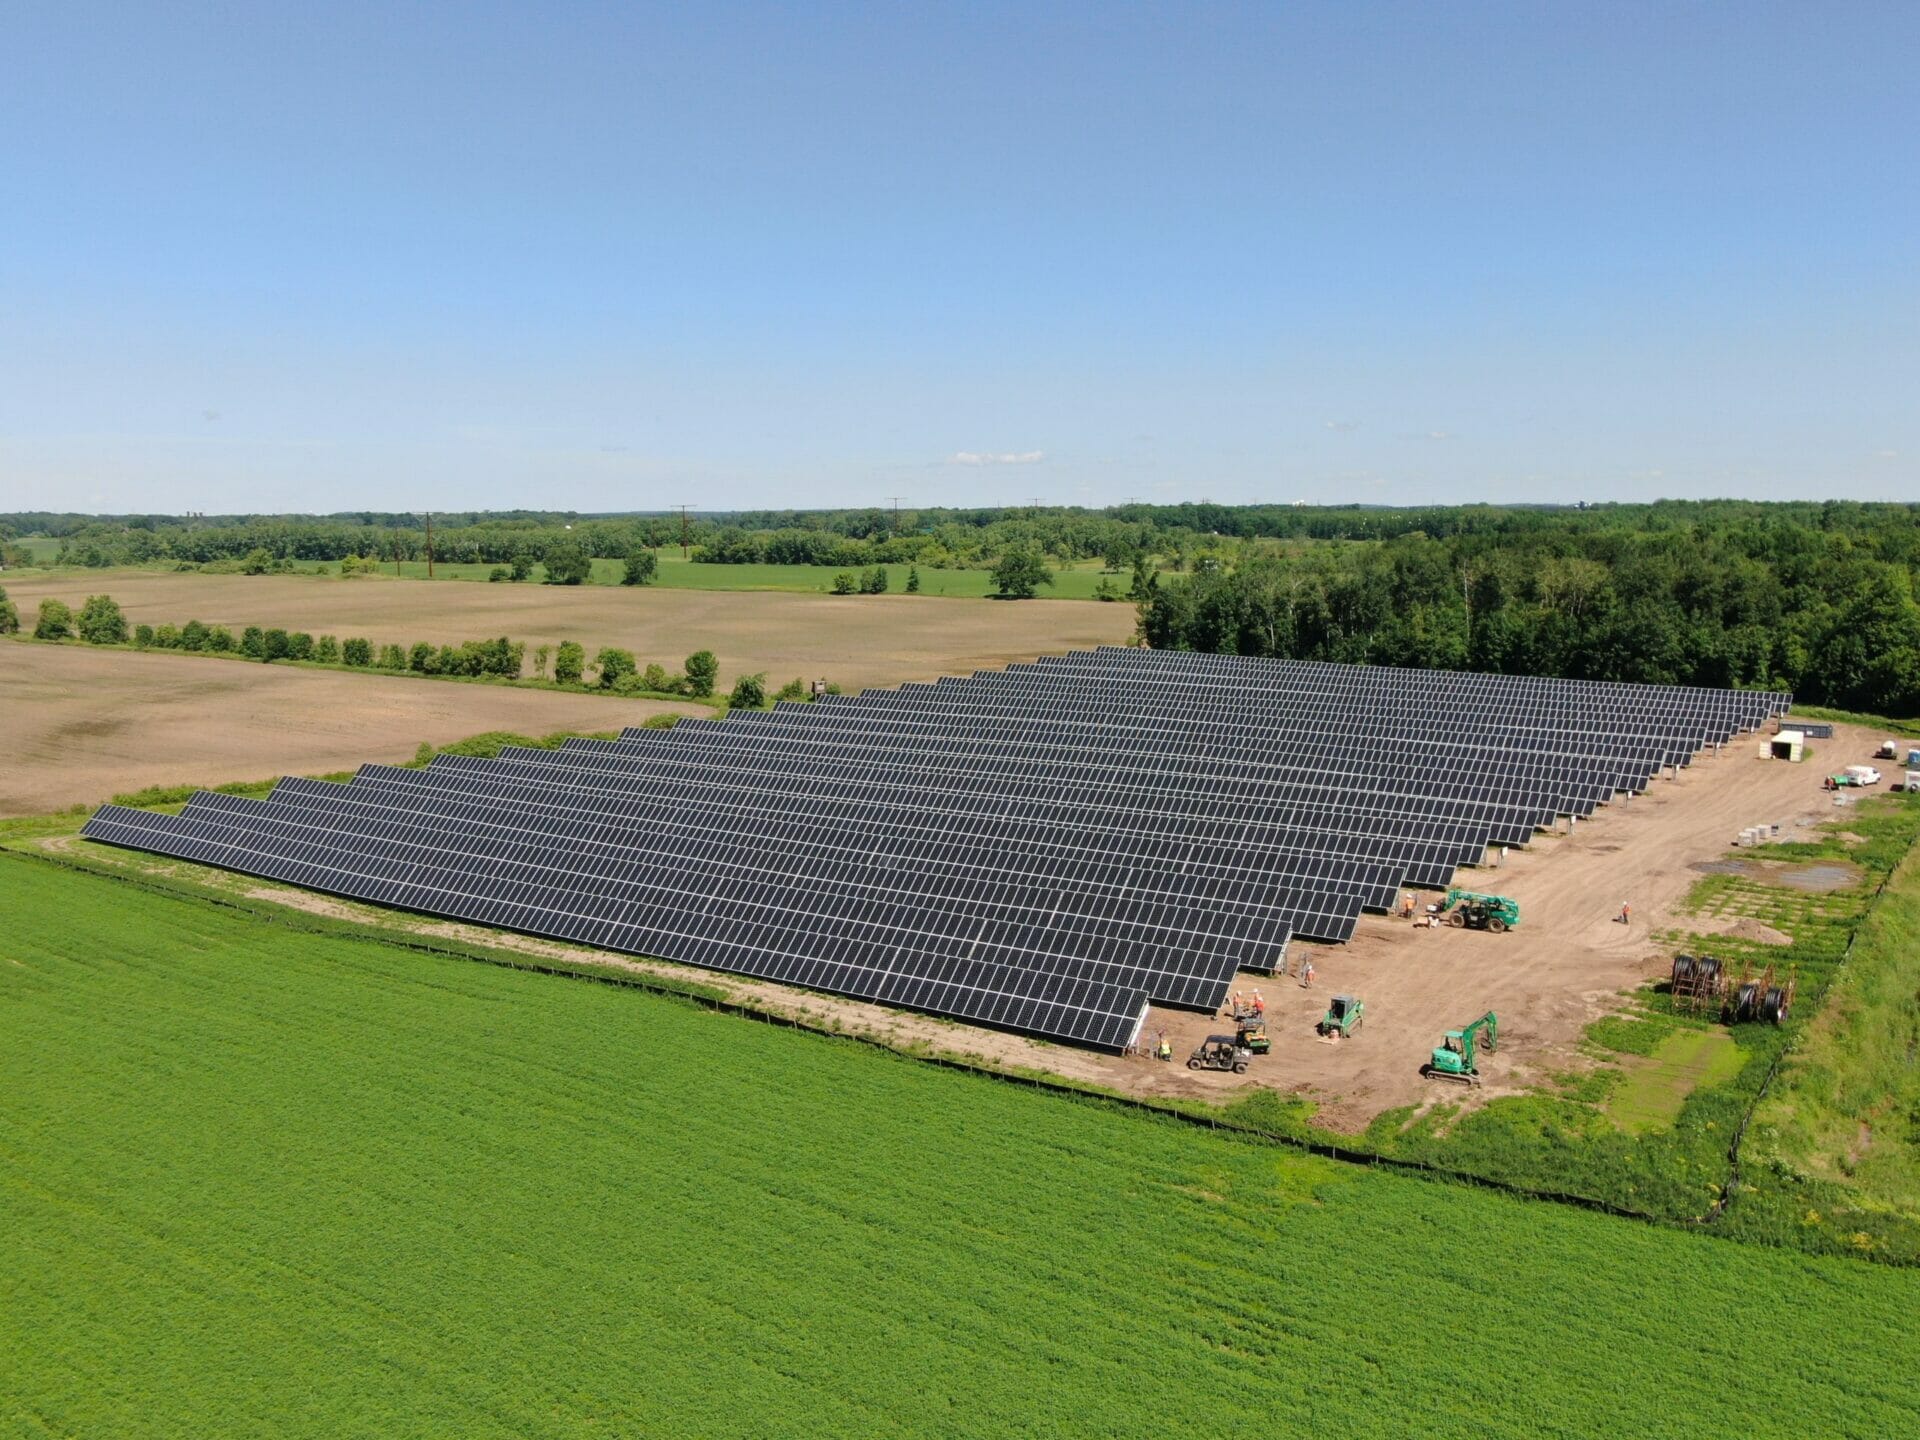
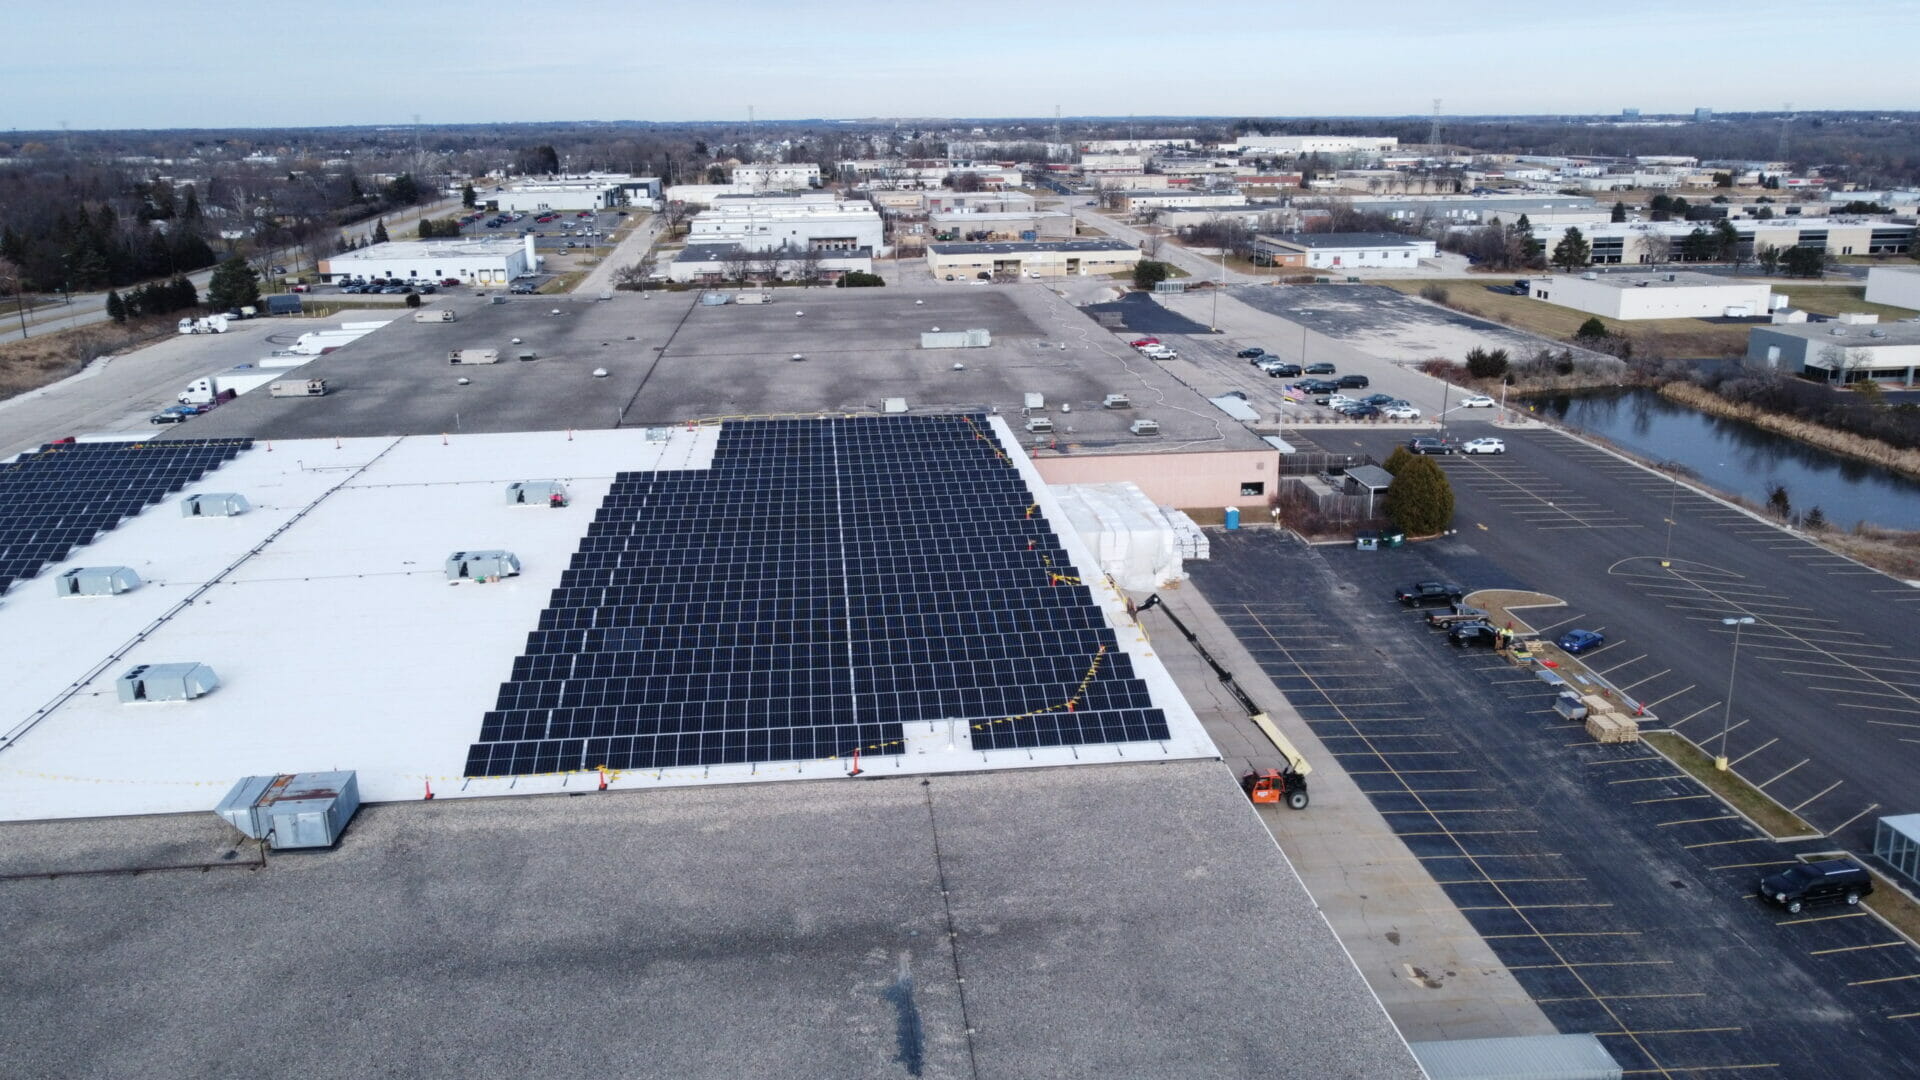
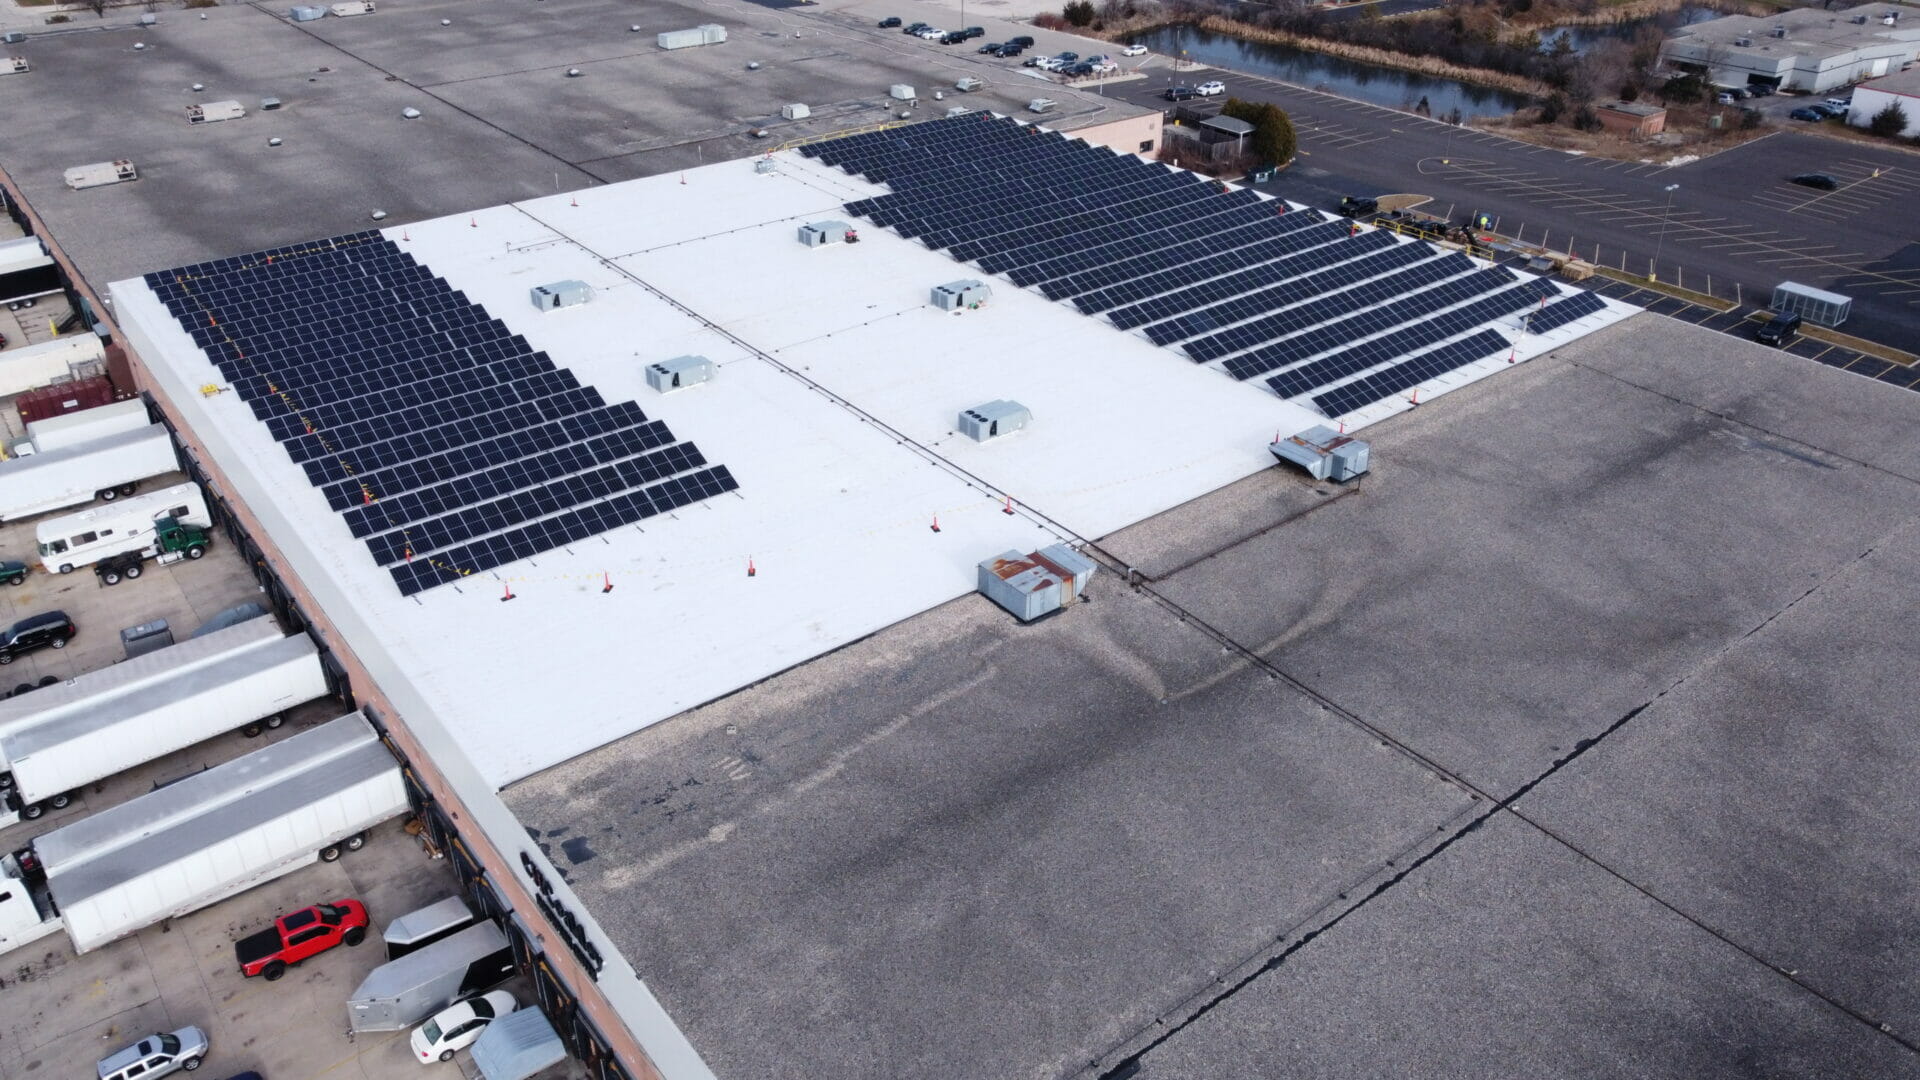
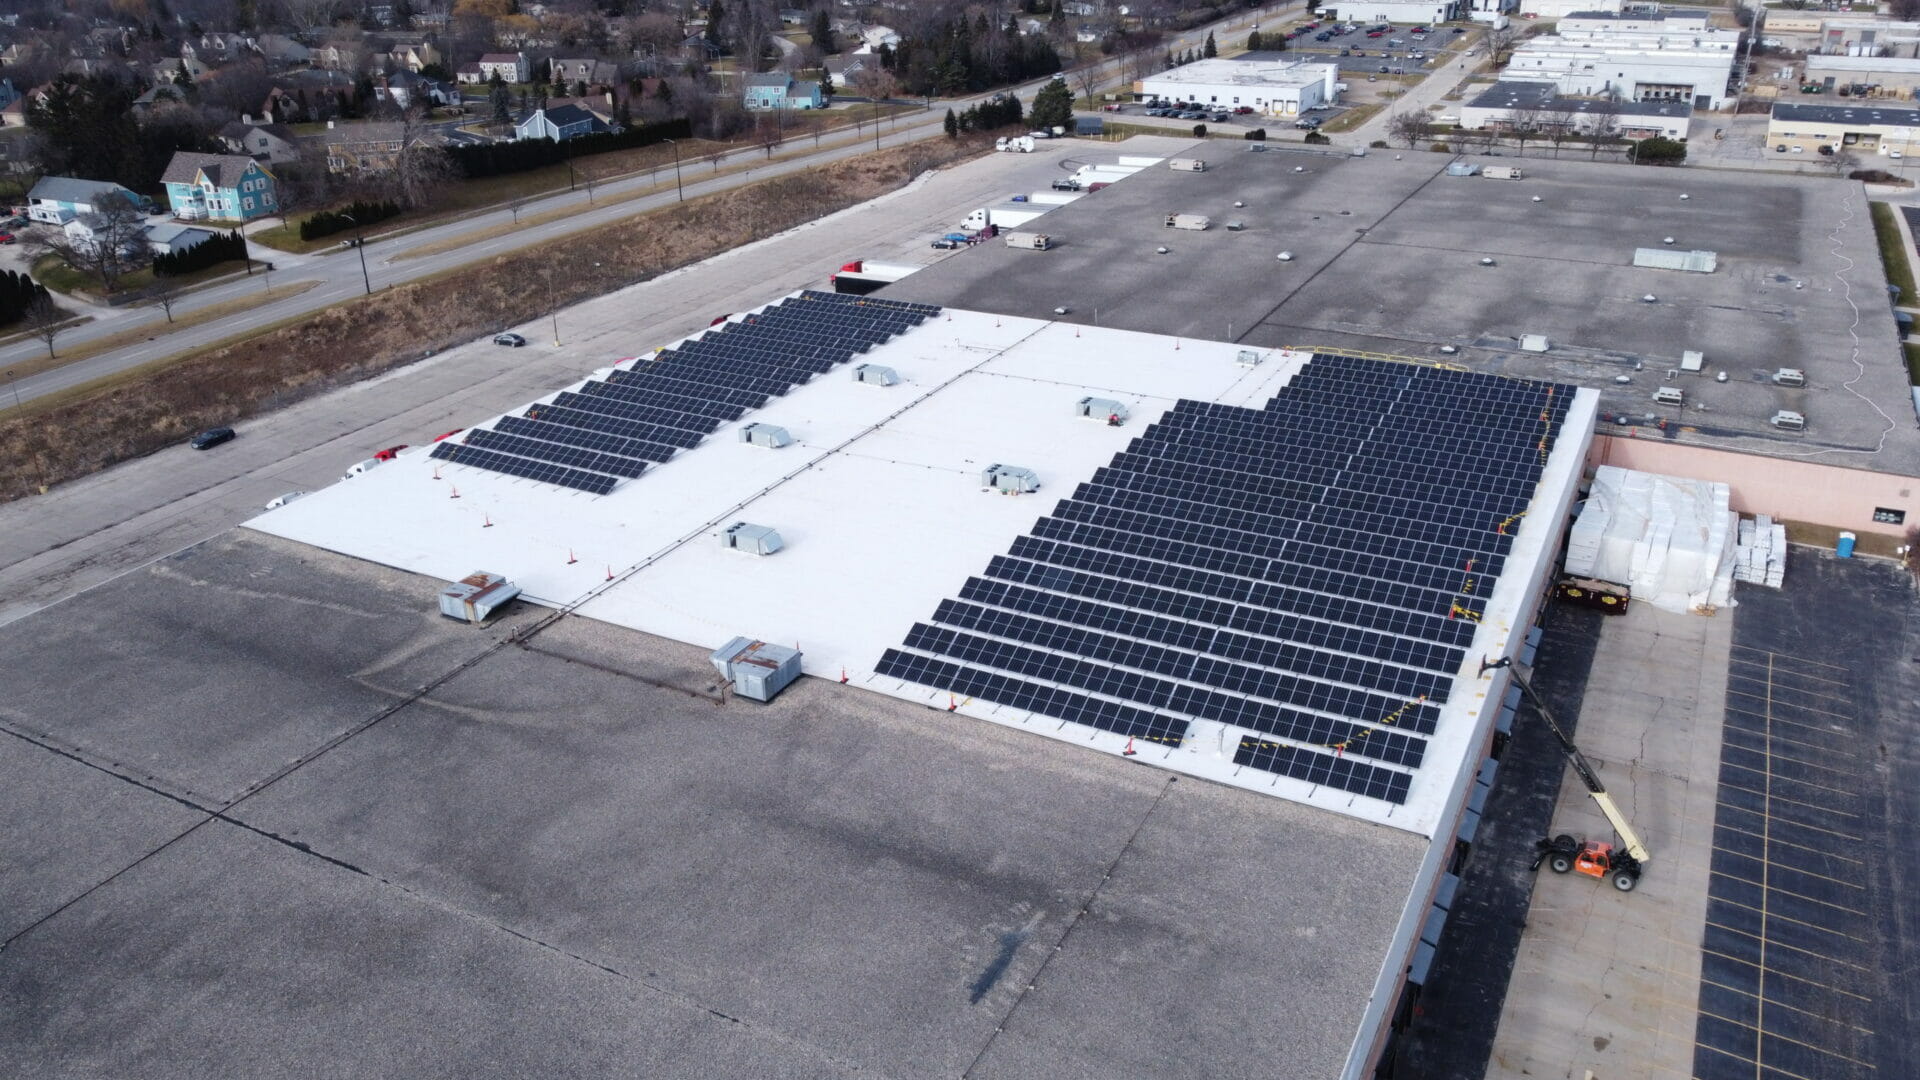
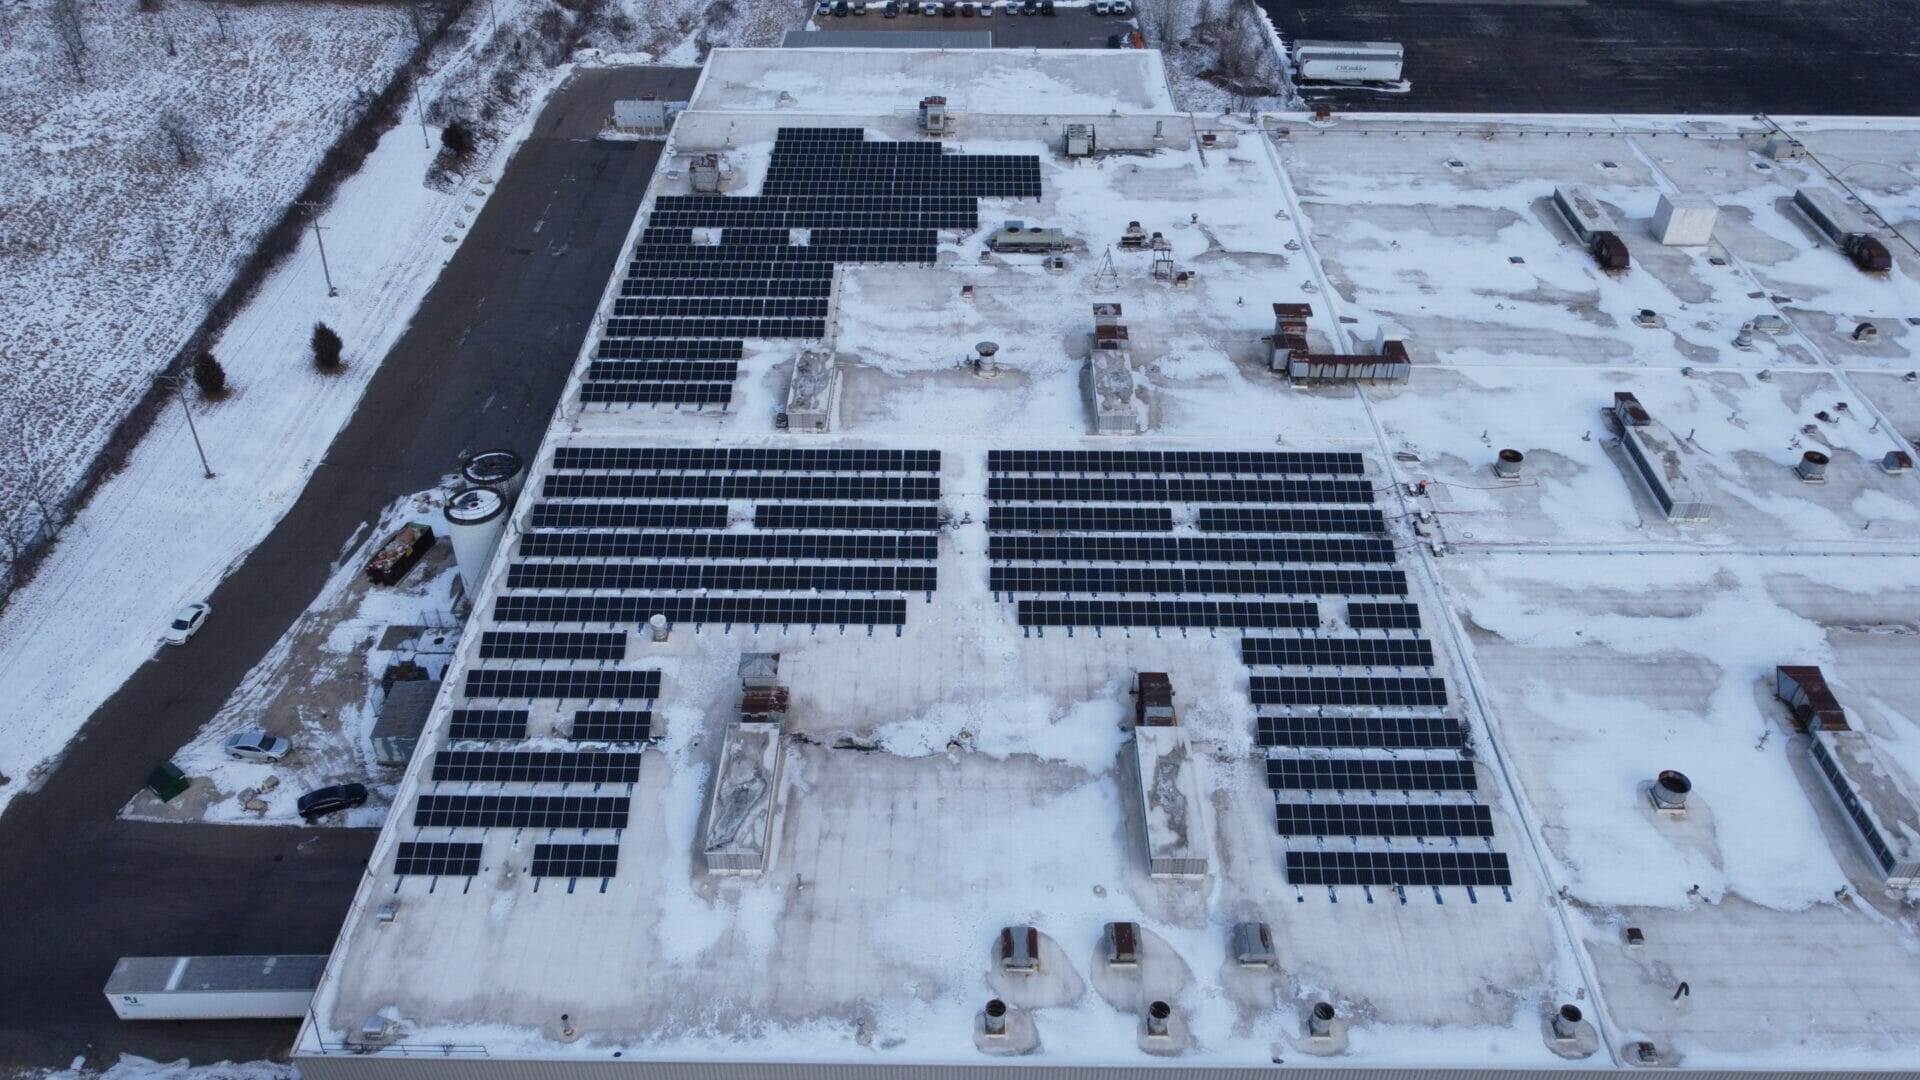
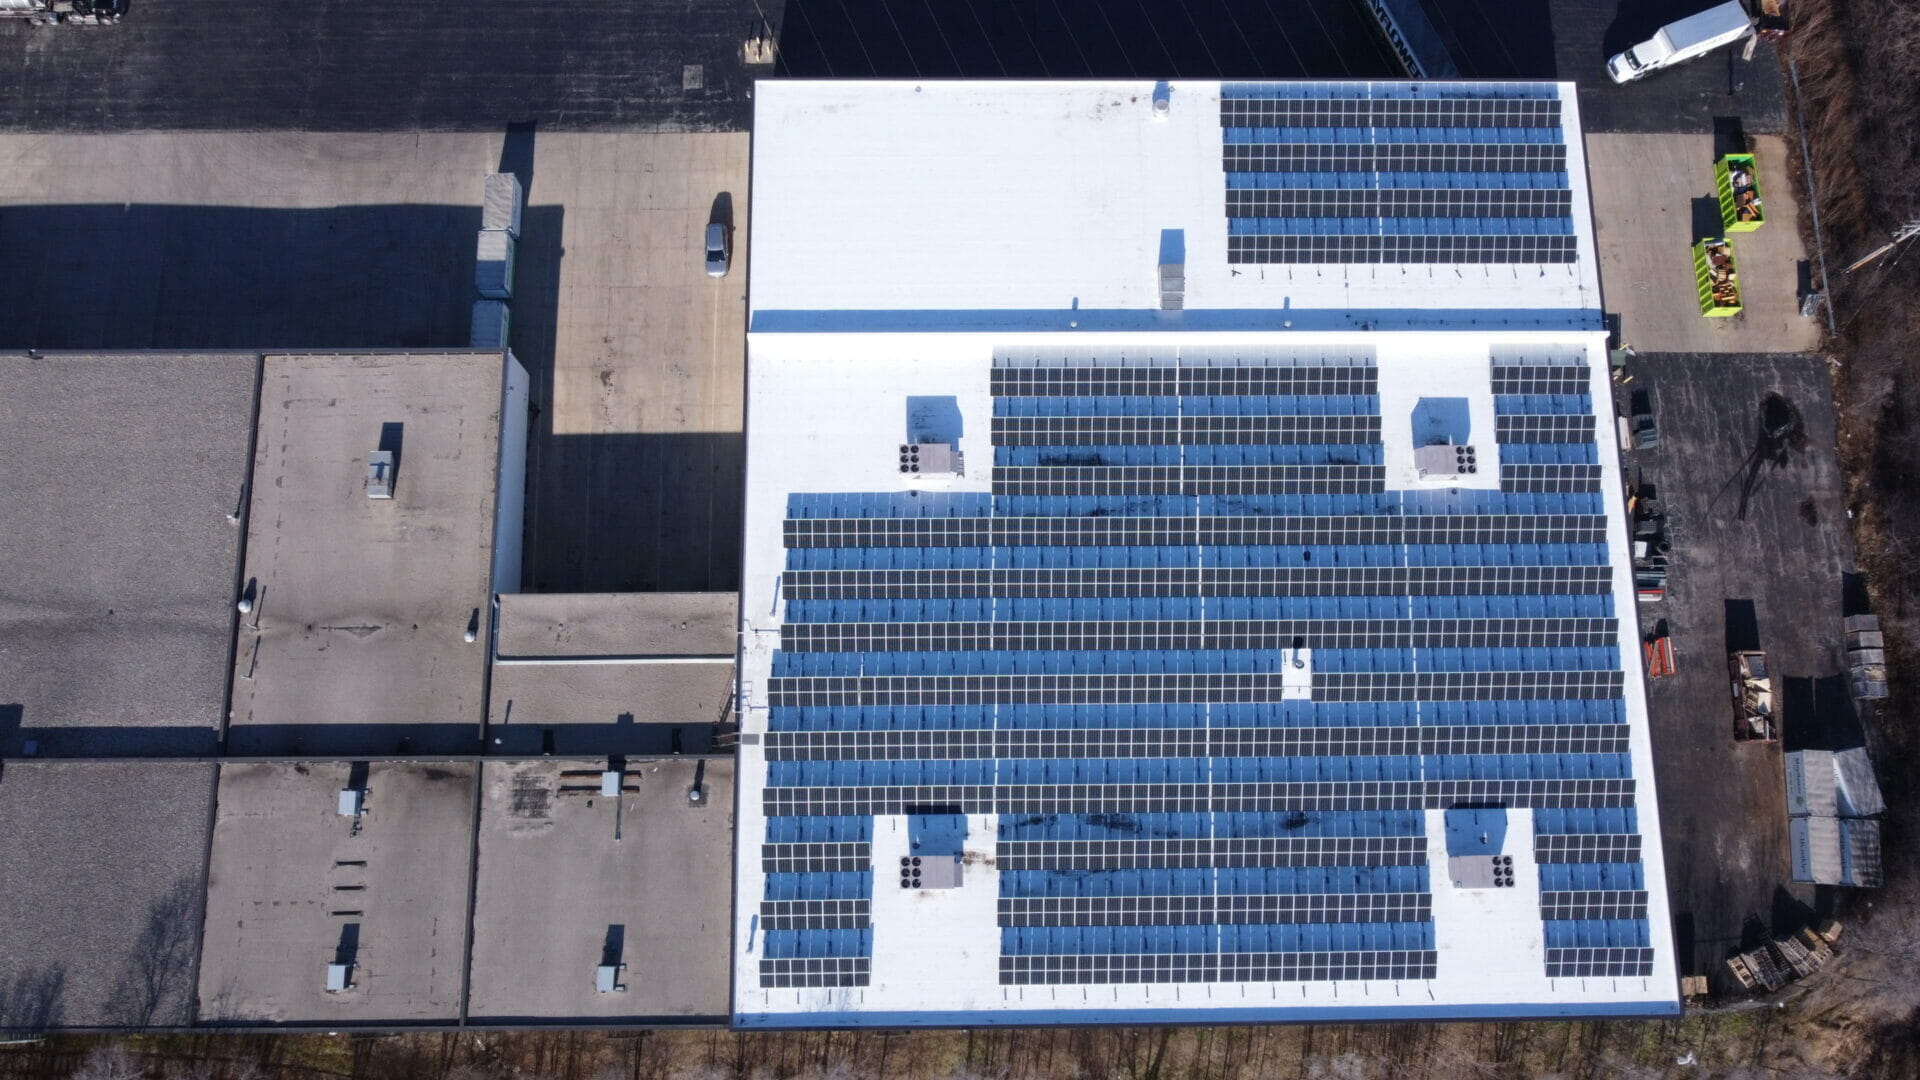
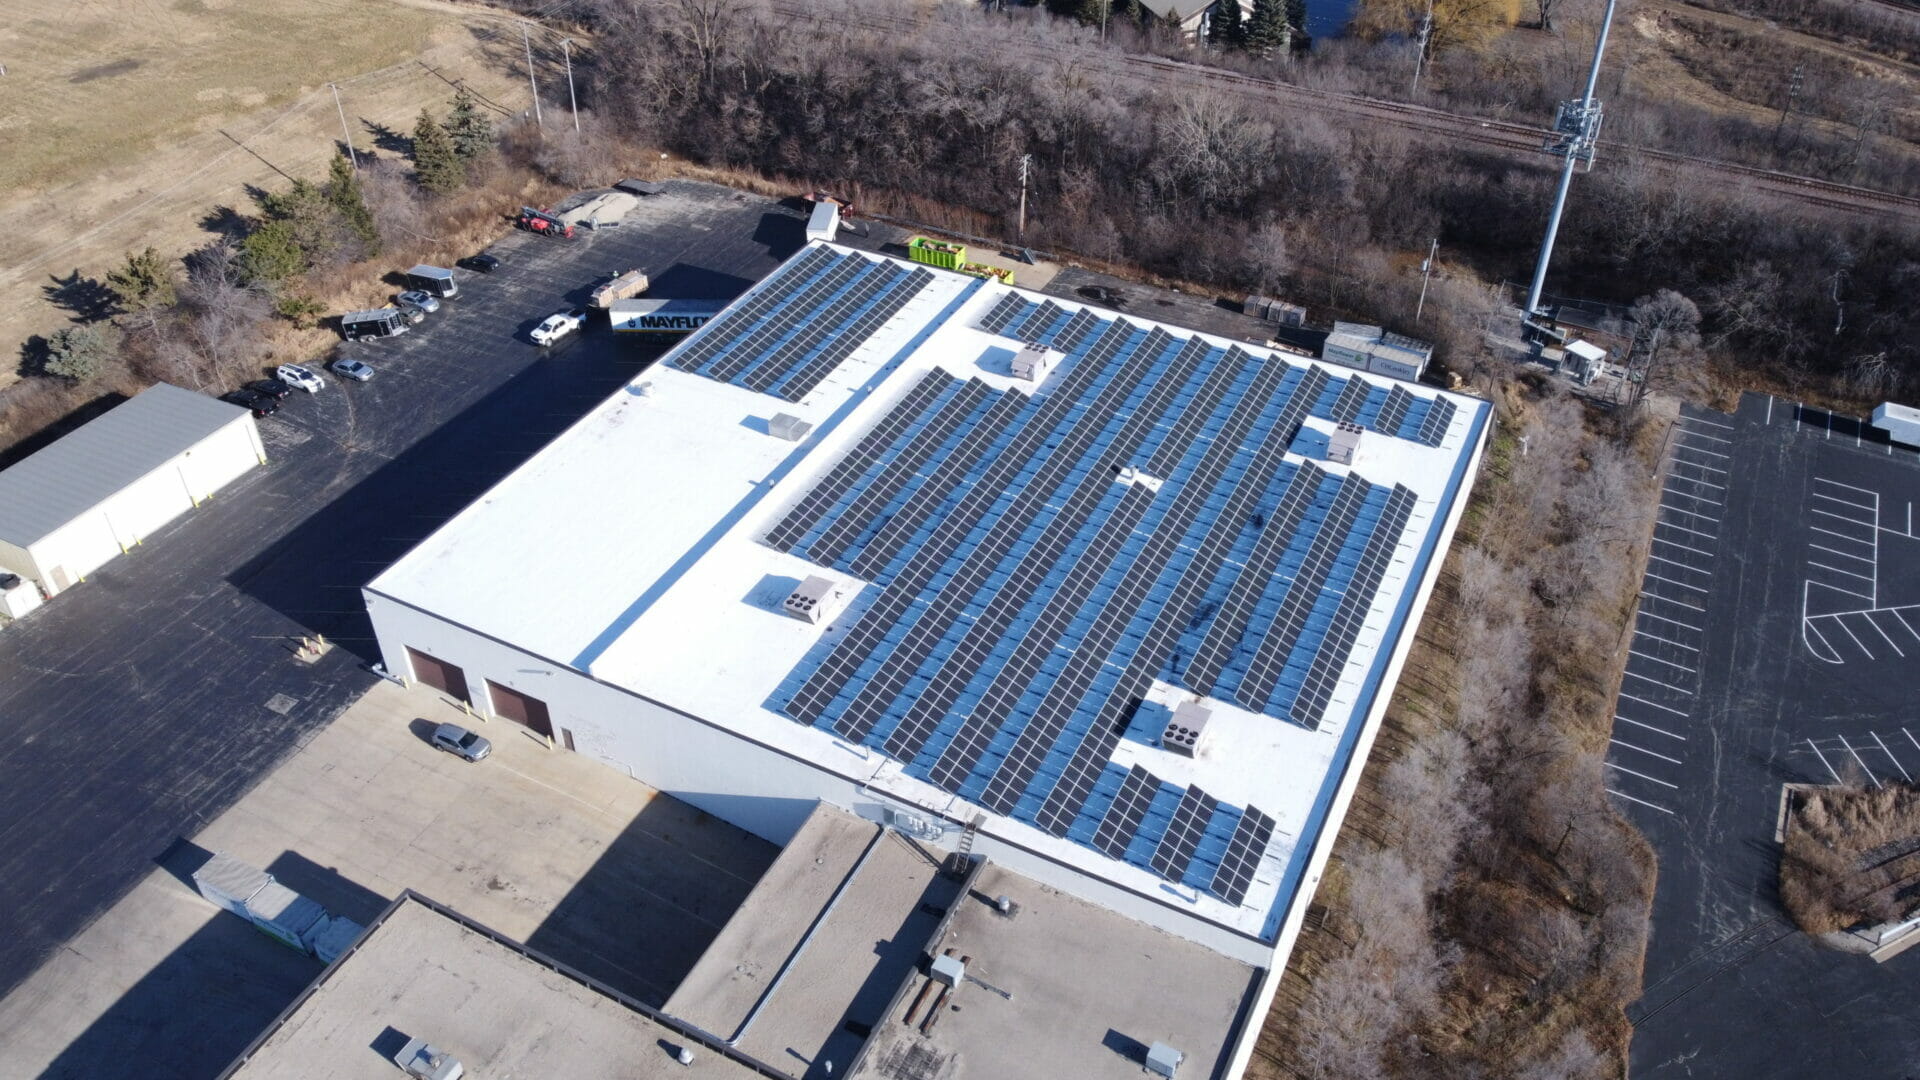
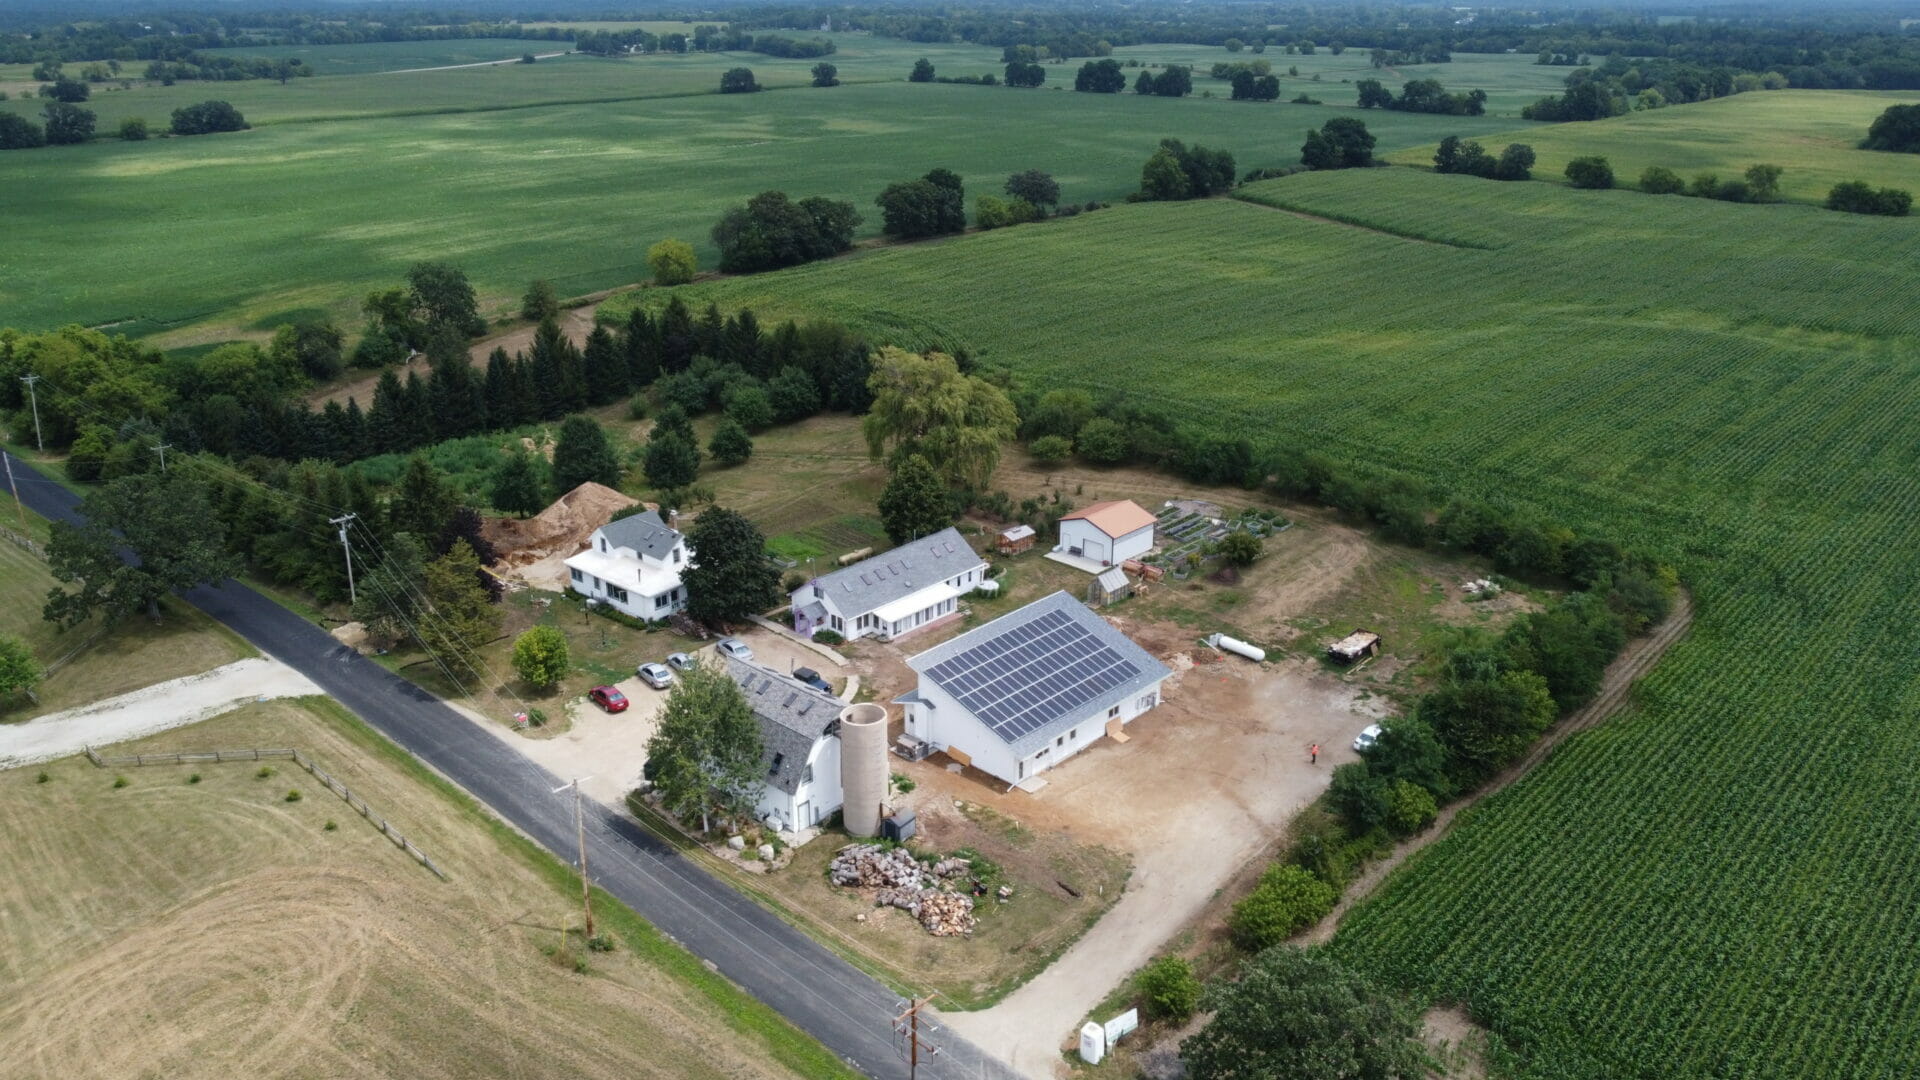
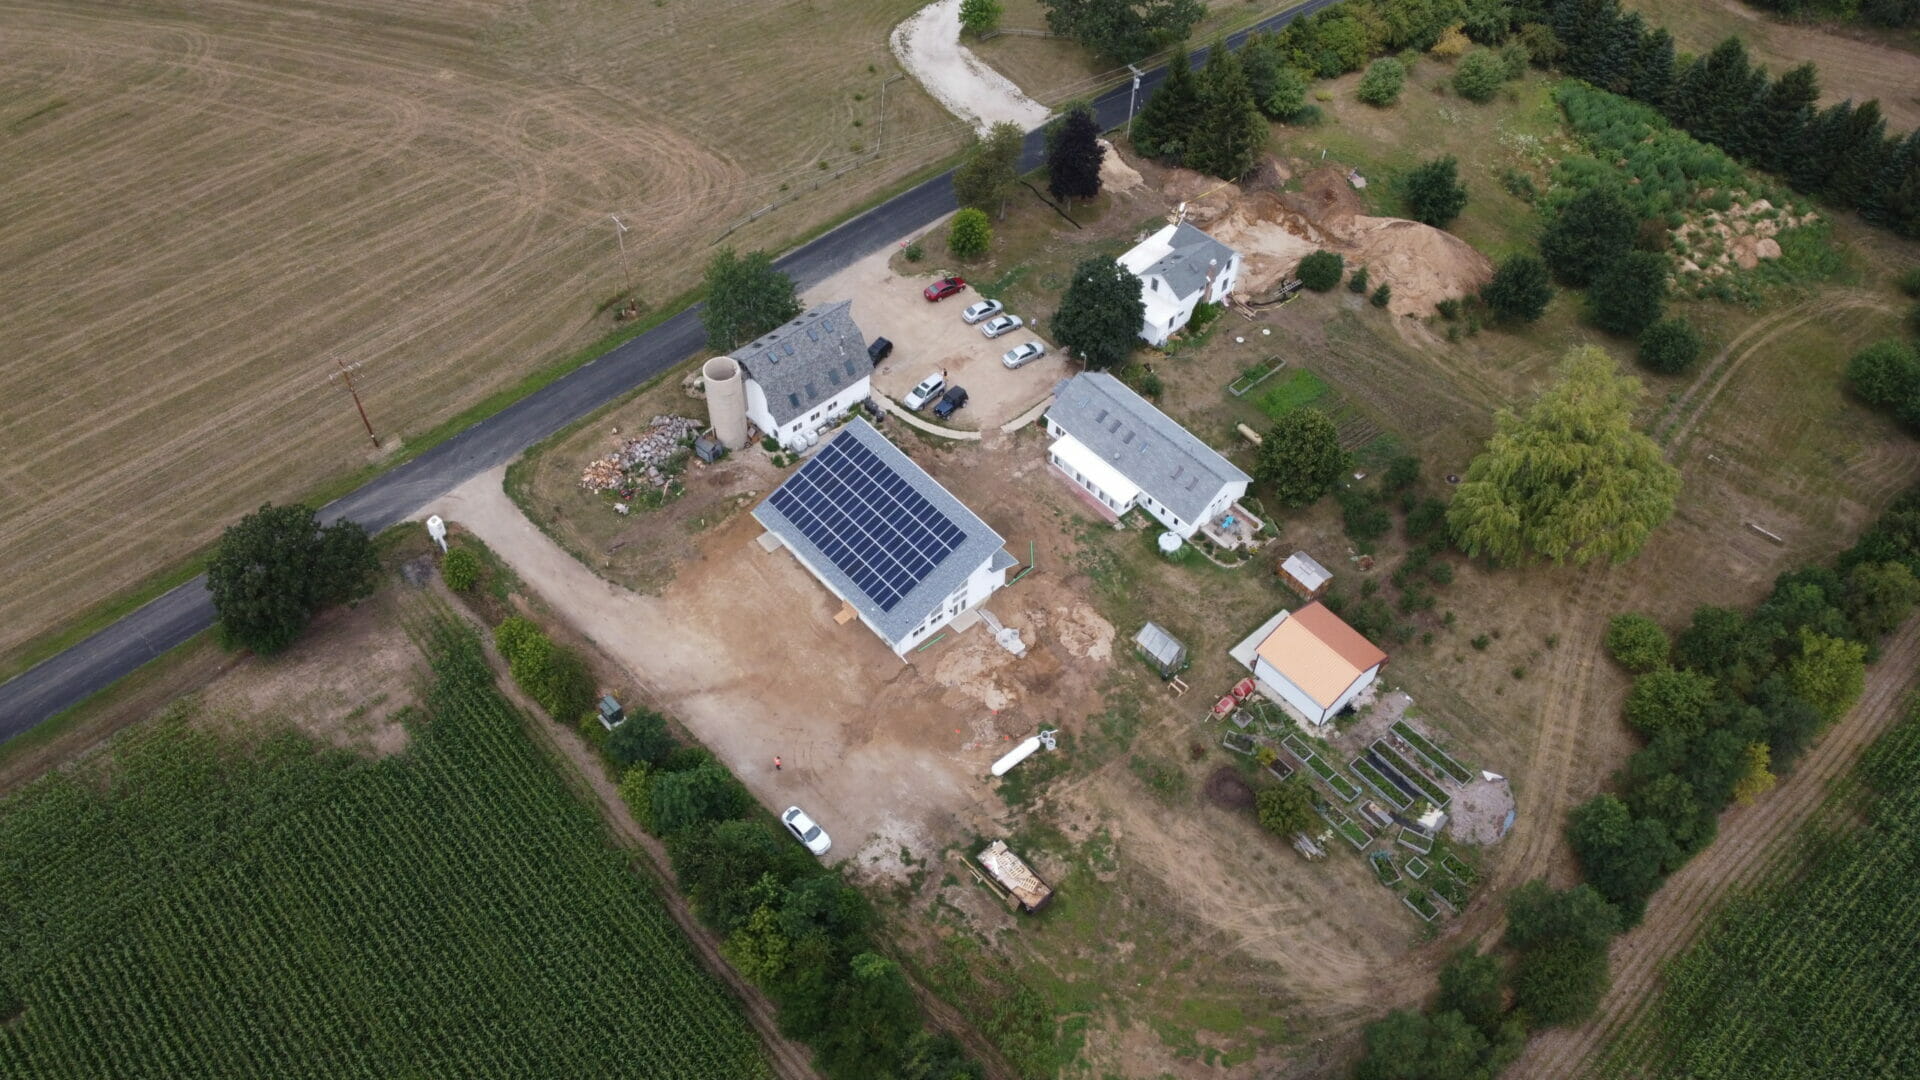
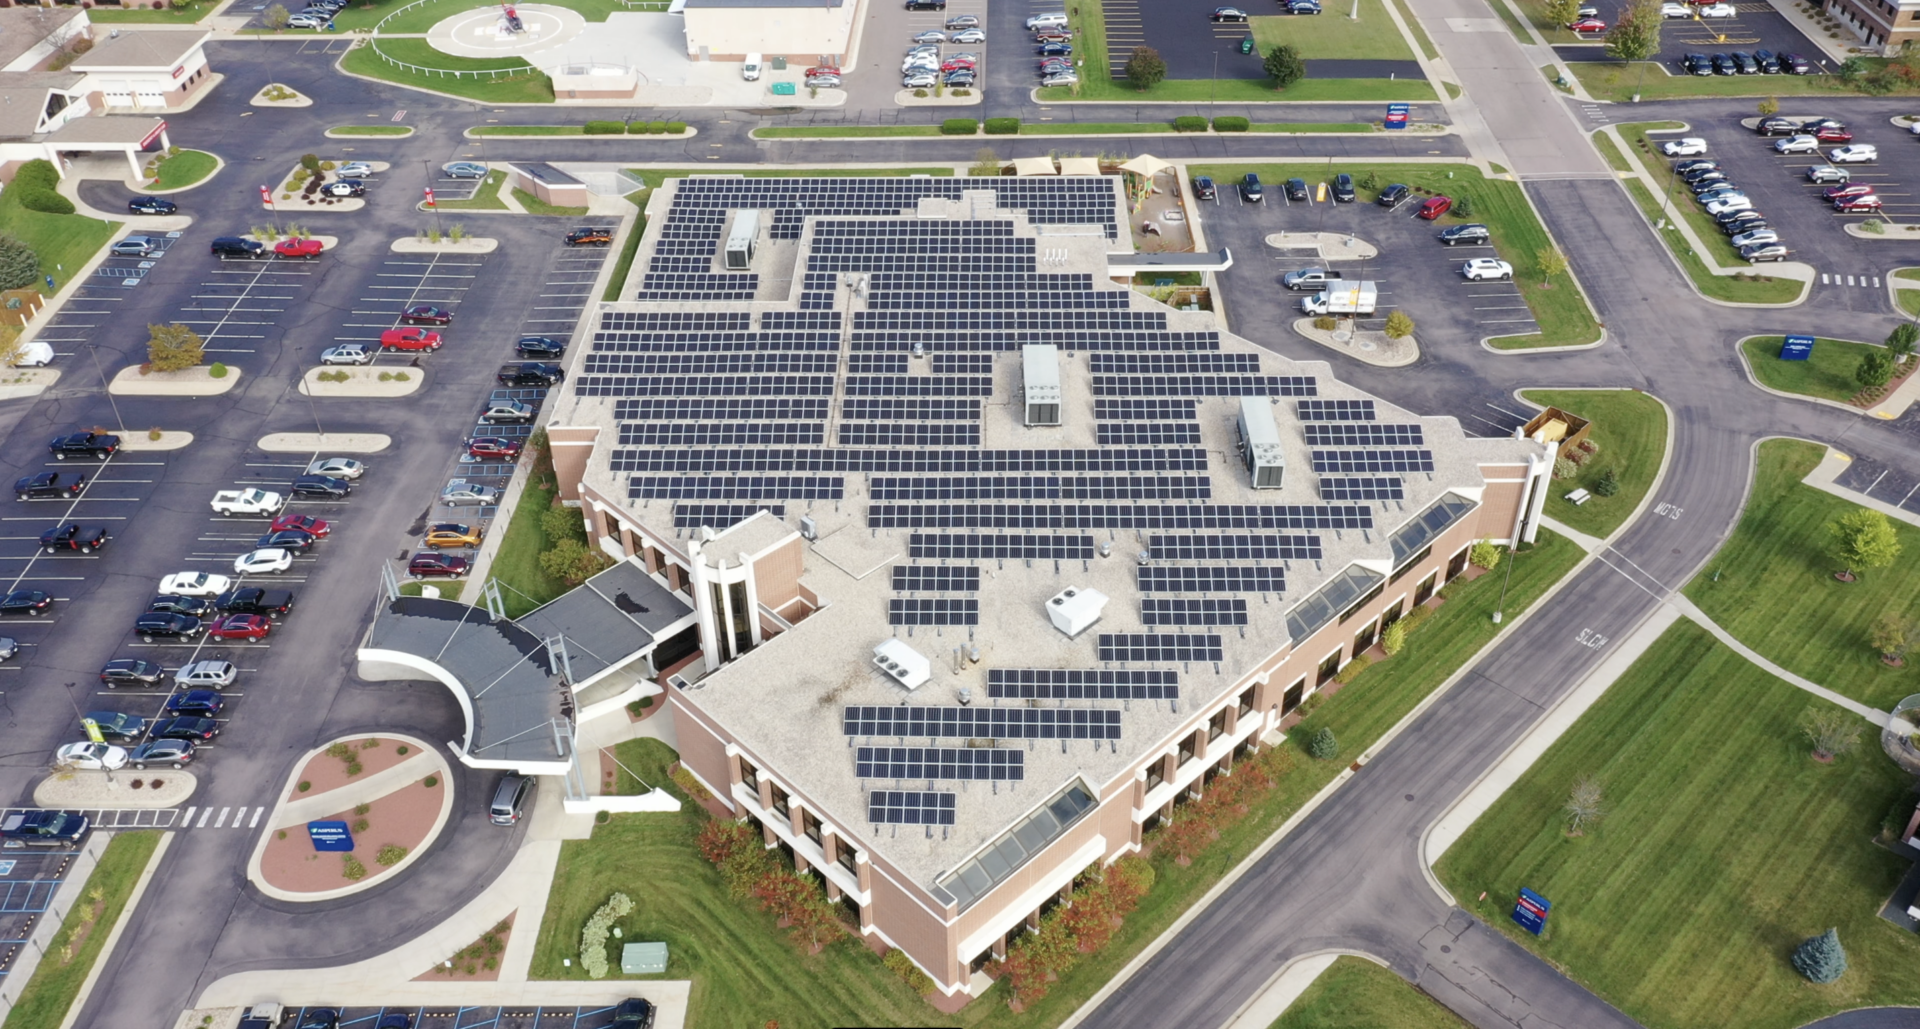
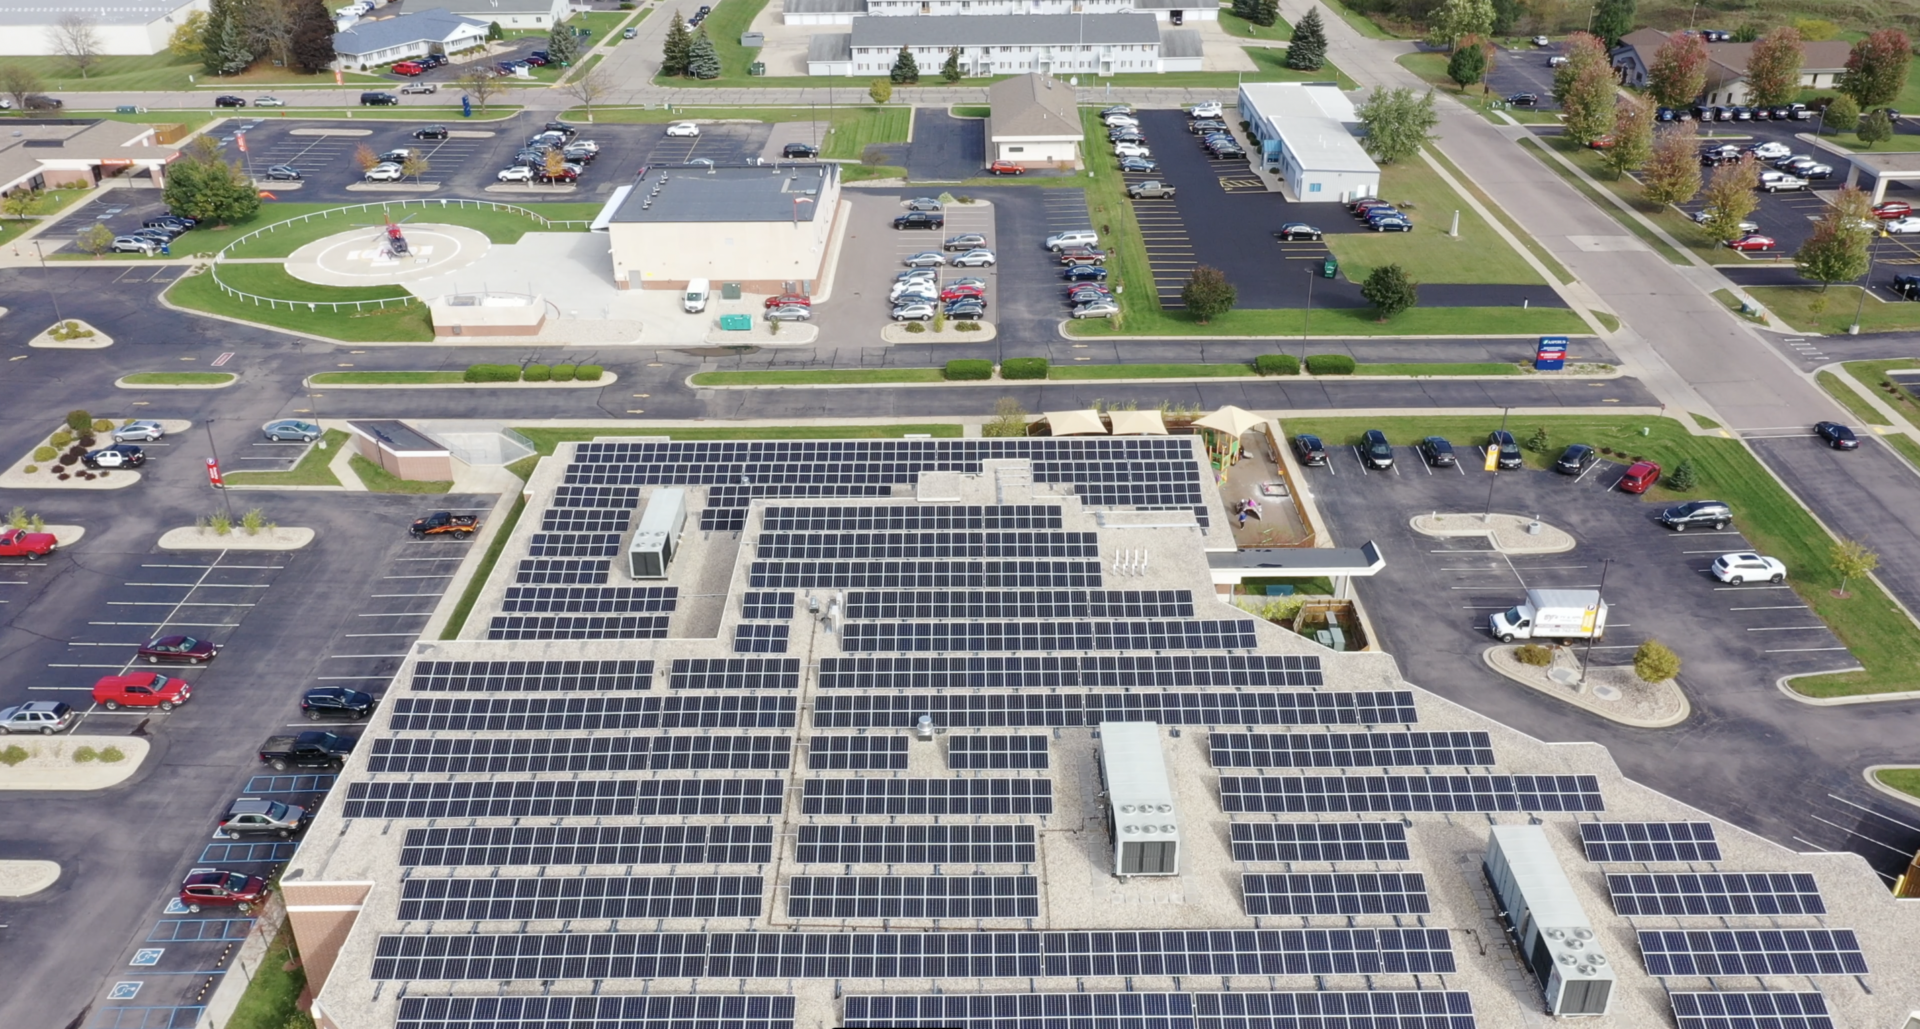
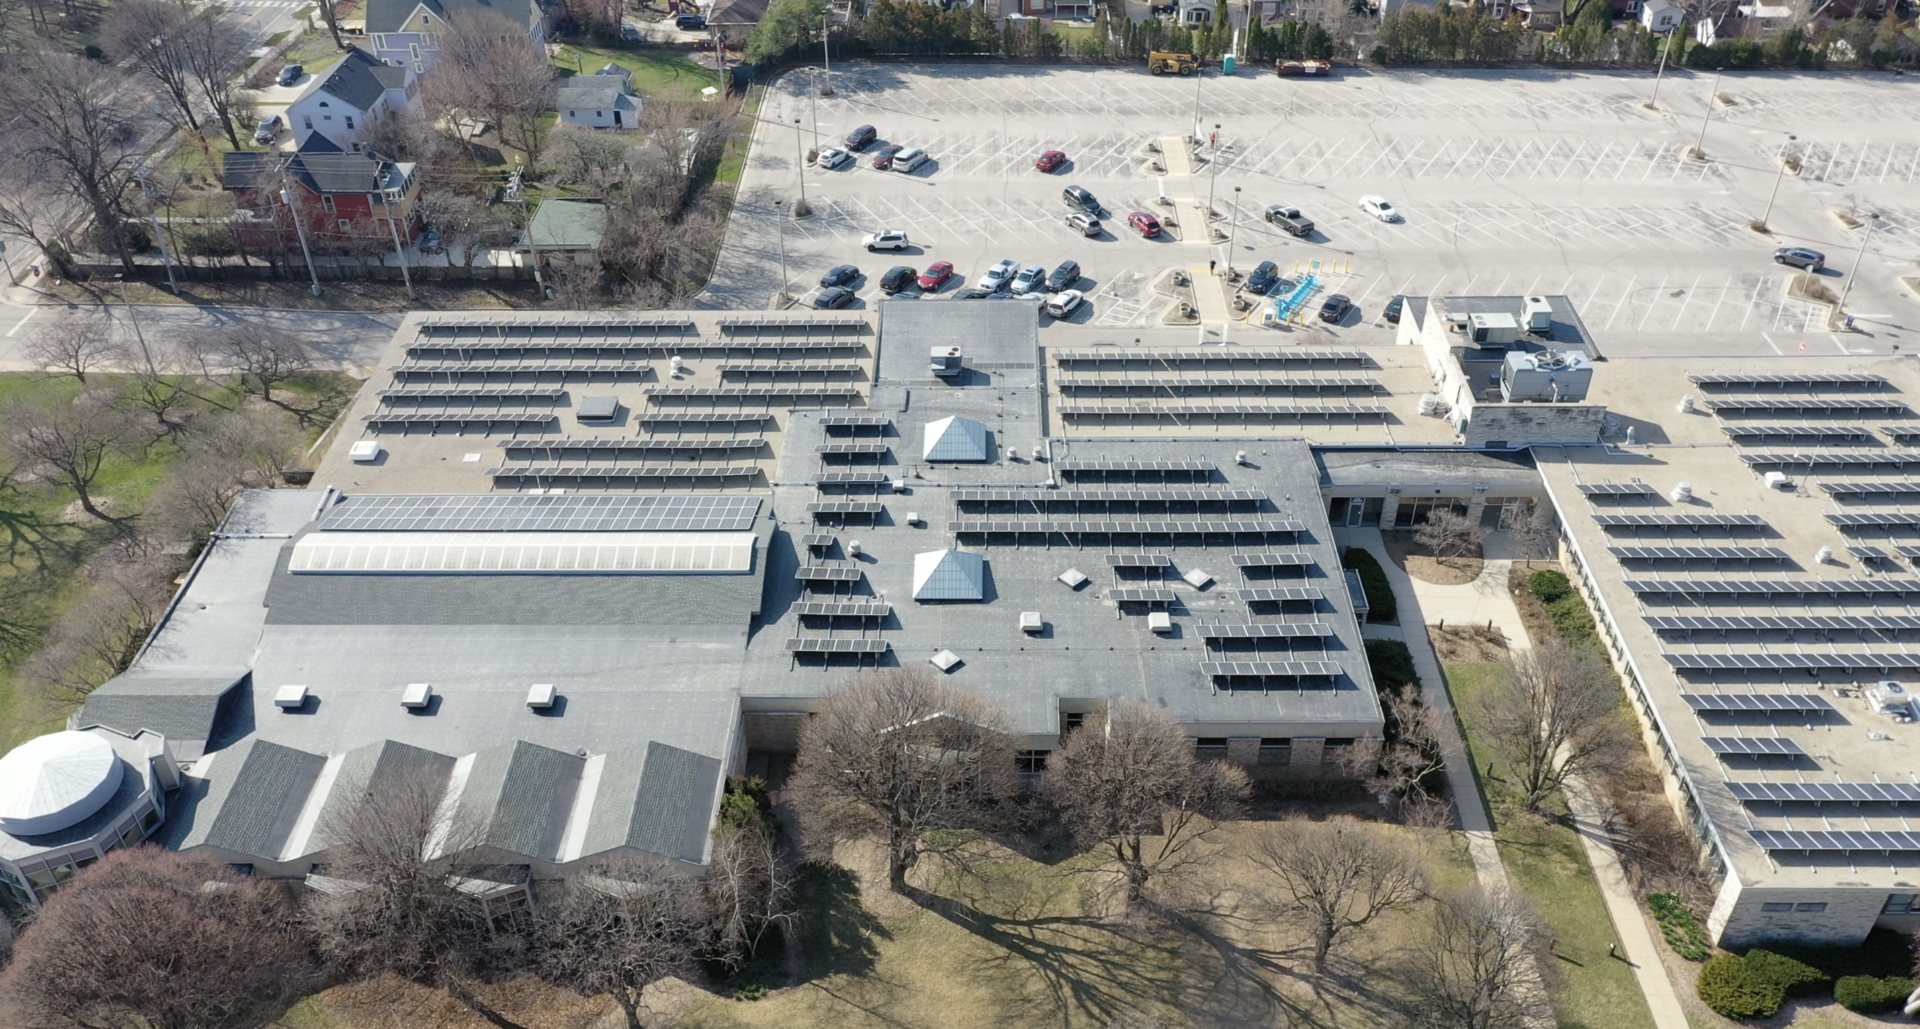
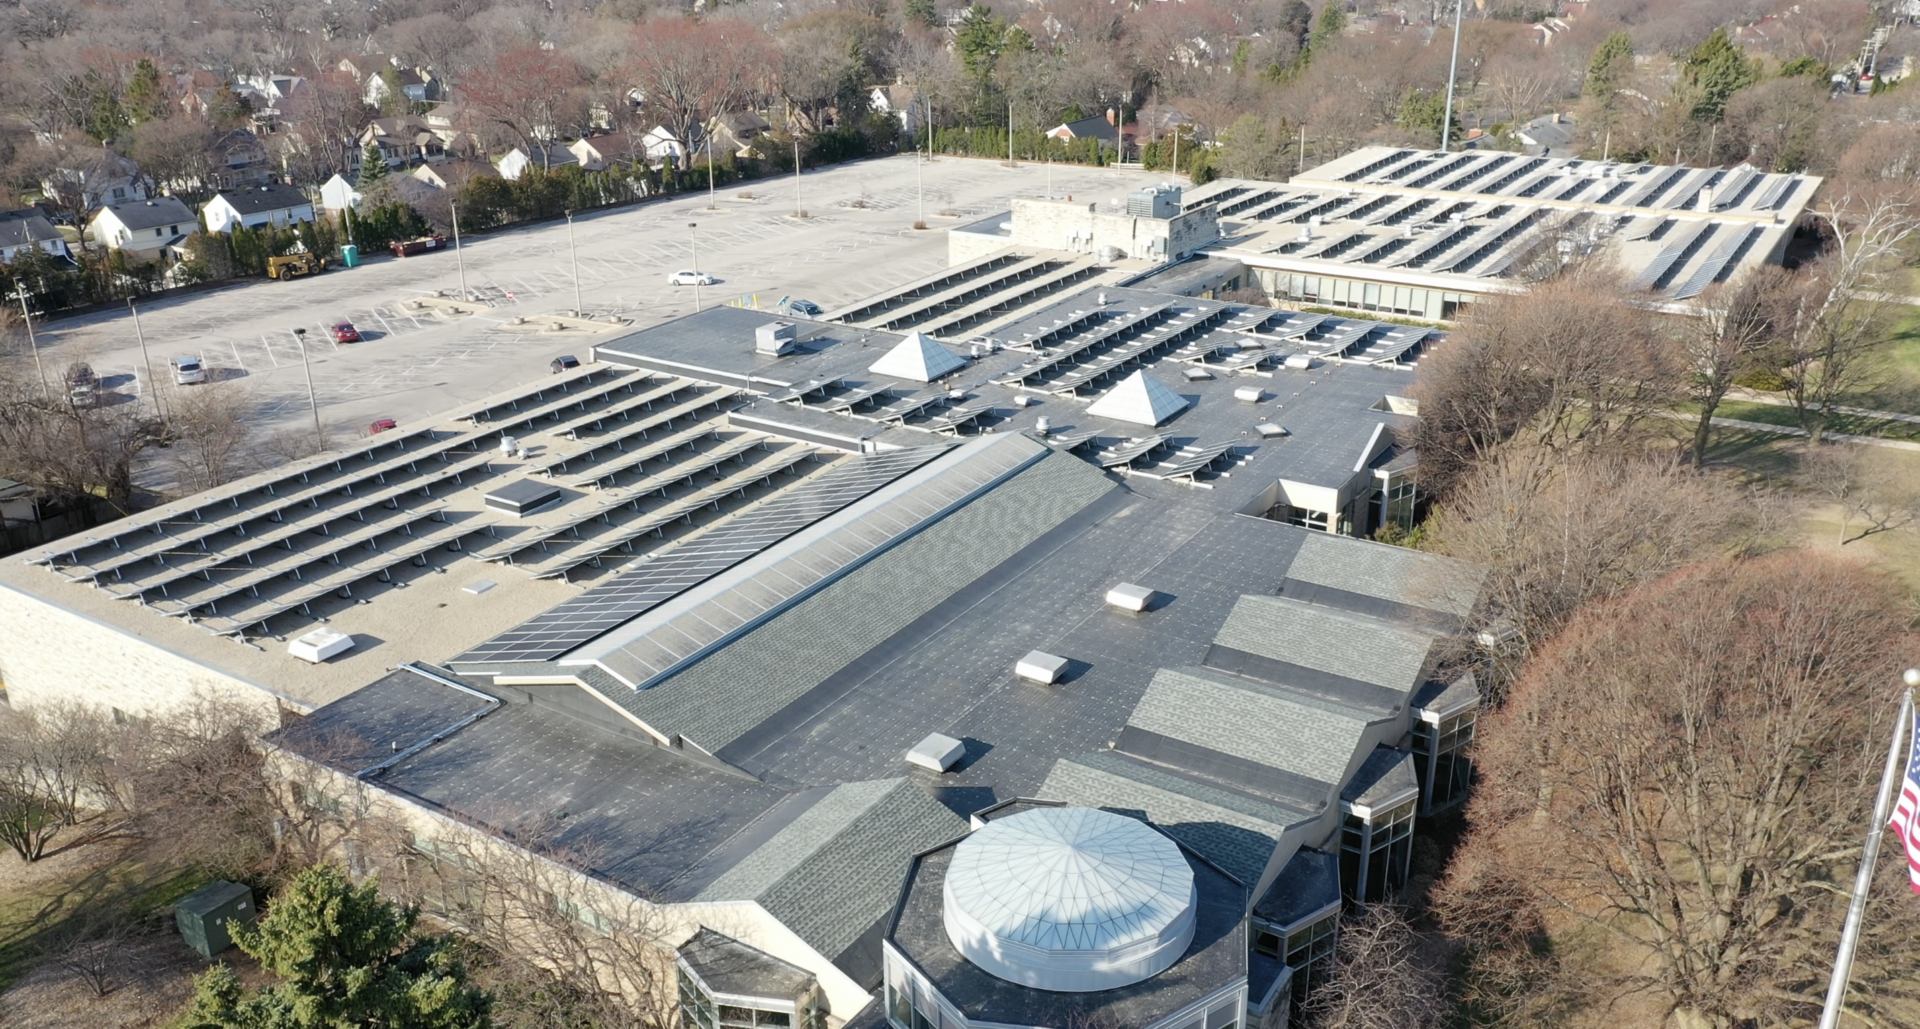
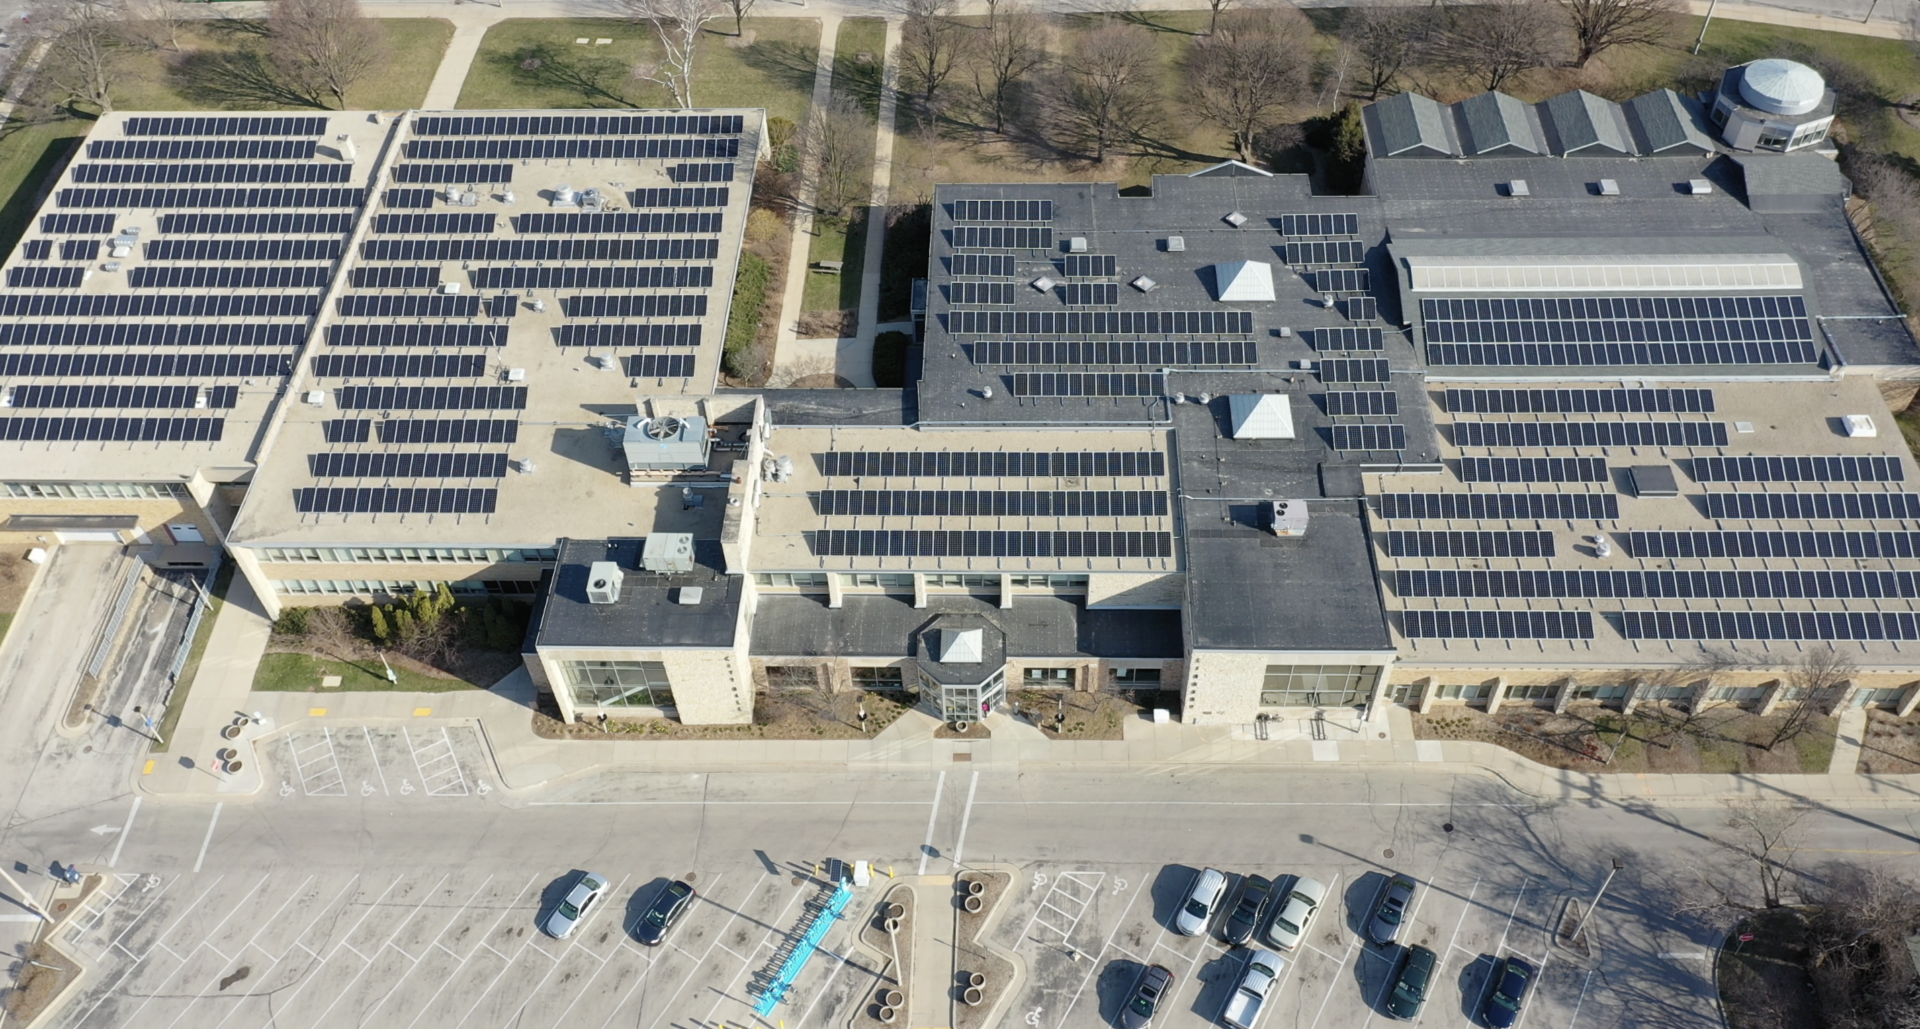
An example of a solar system using demand rates is the Pleasant Prairie RecPlex. Energy-intensive equipment such as pool heating systems and other mechanical loads contribute to the facility’s demand charges.
Arch installed a 999kW system in the fall of 2025 to offset these high demand charges.

Aerial image of Pleasant Prairie RecPlex solar system installed by Arch Solar.
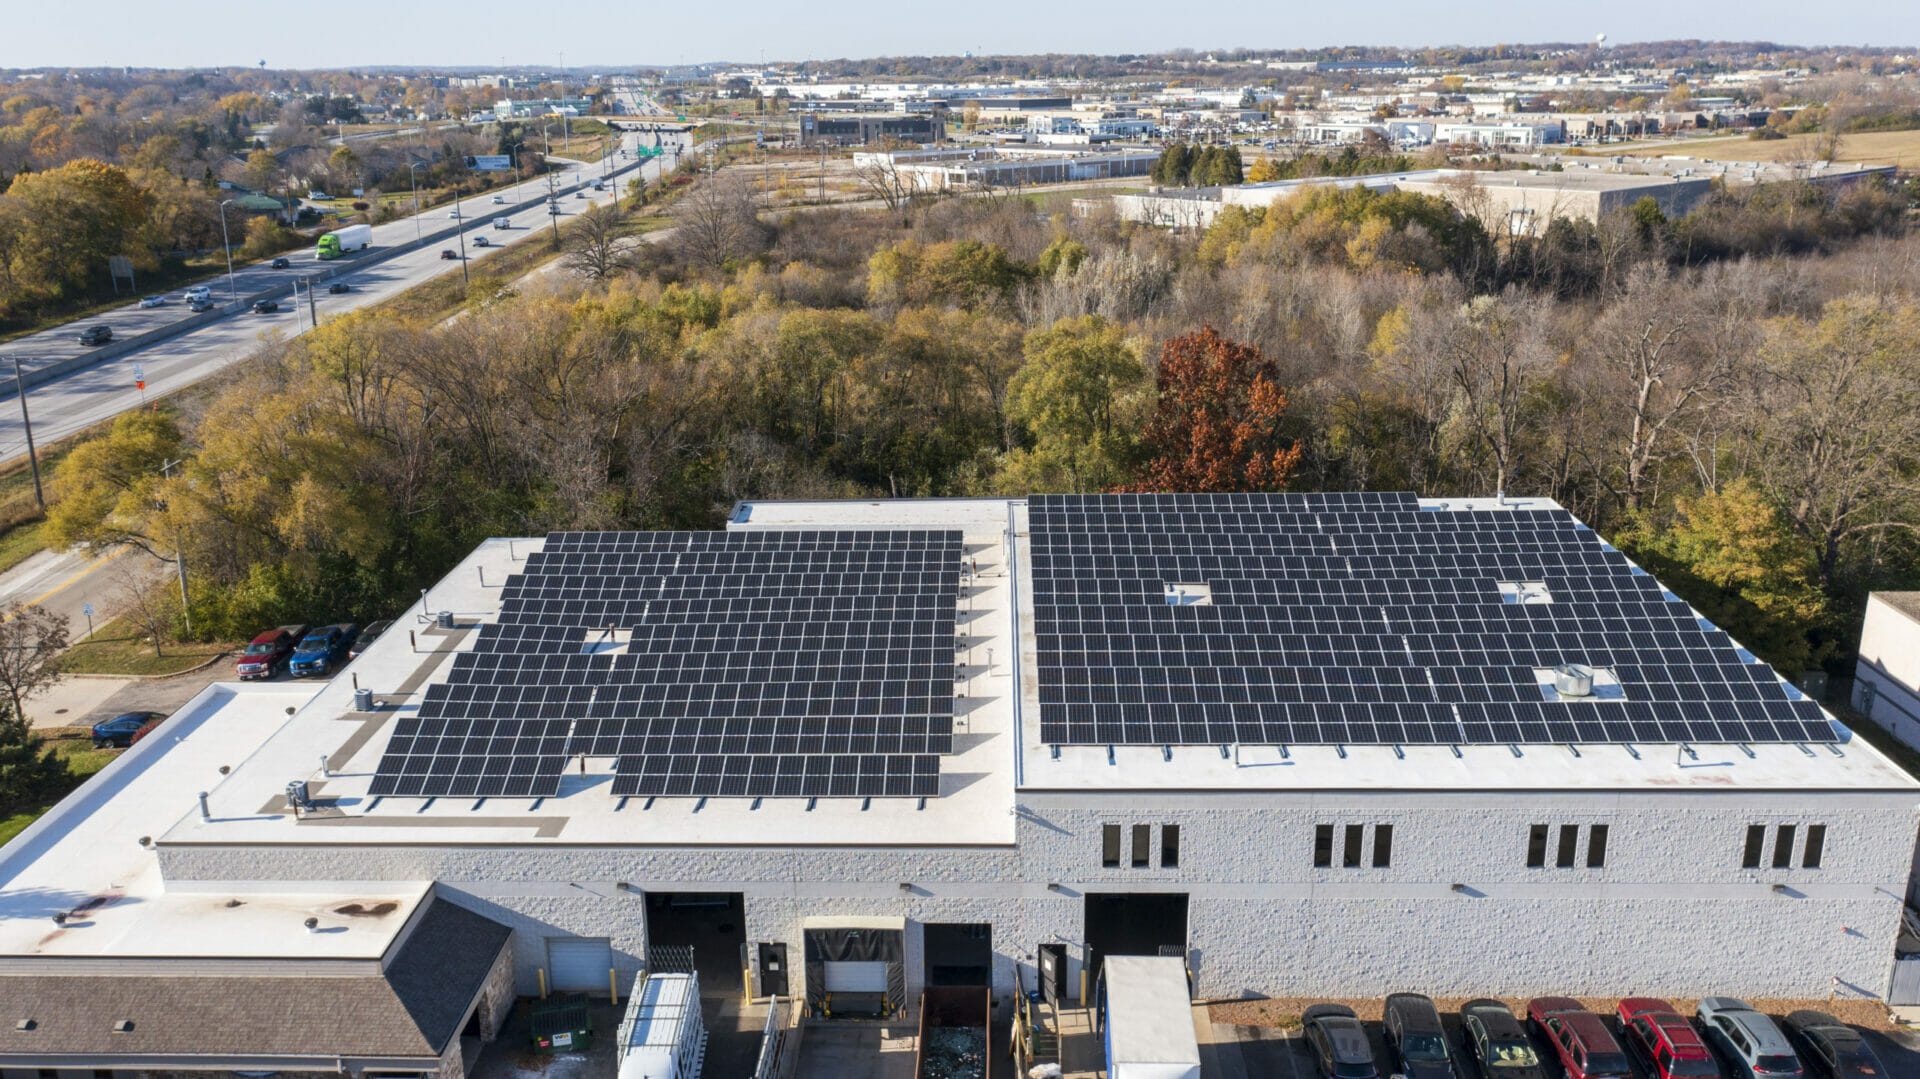
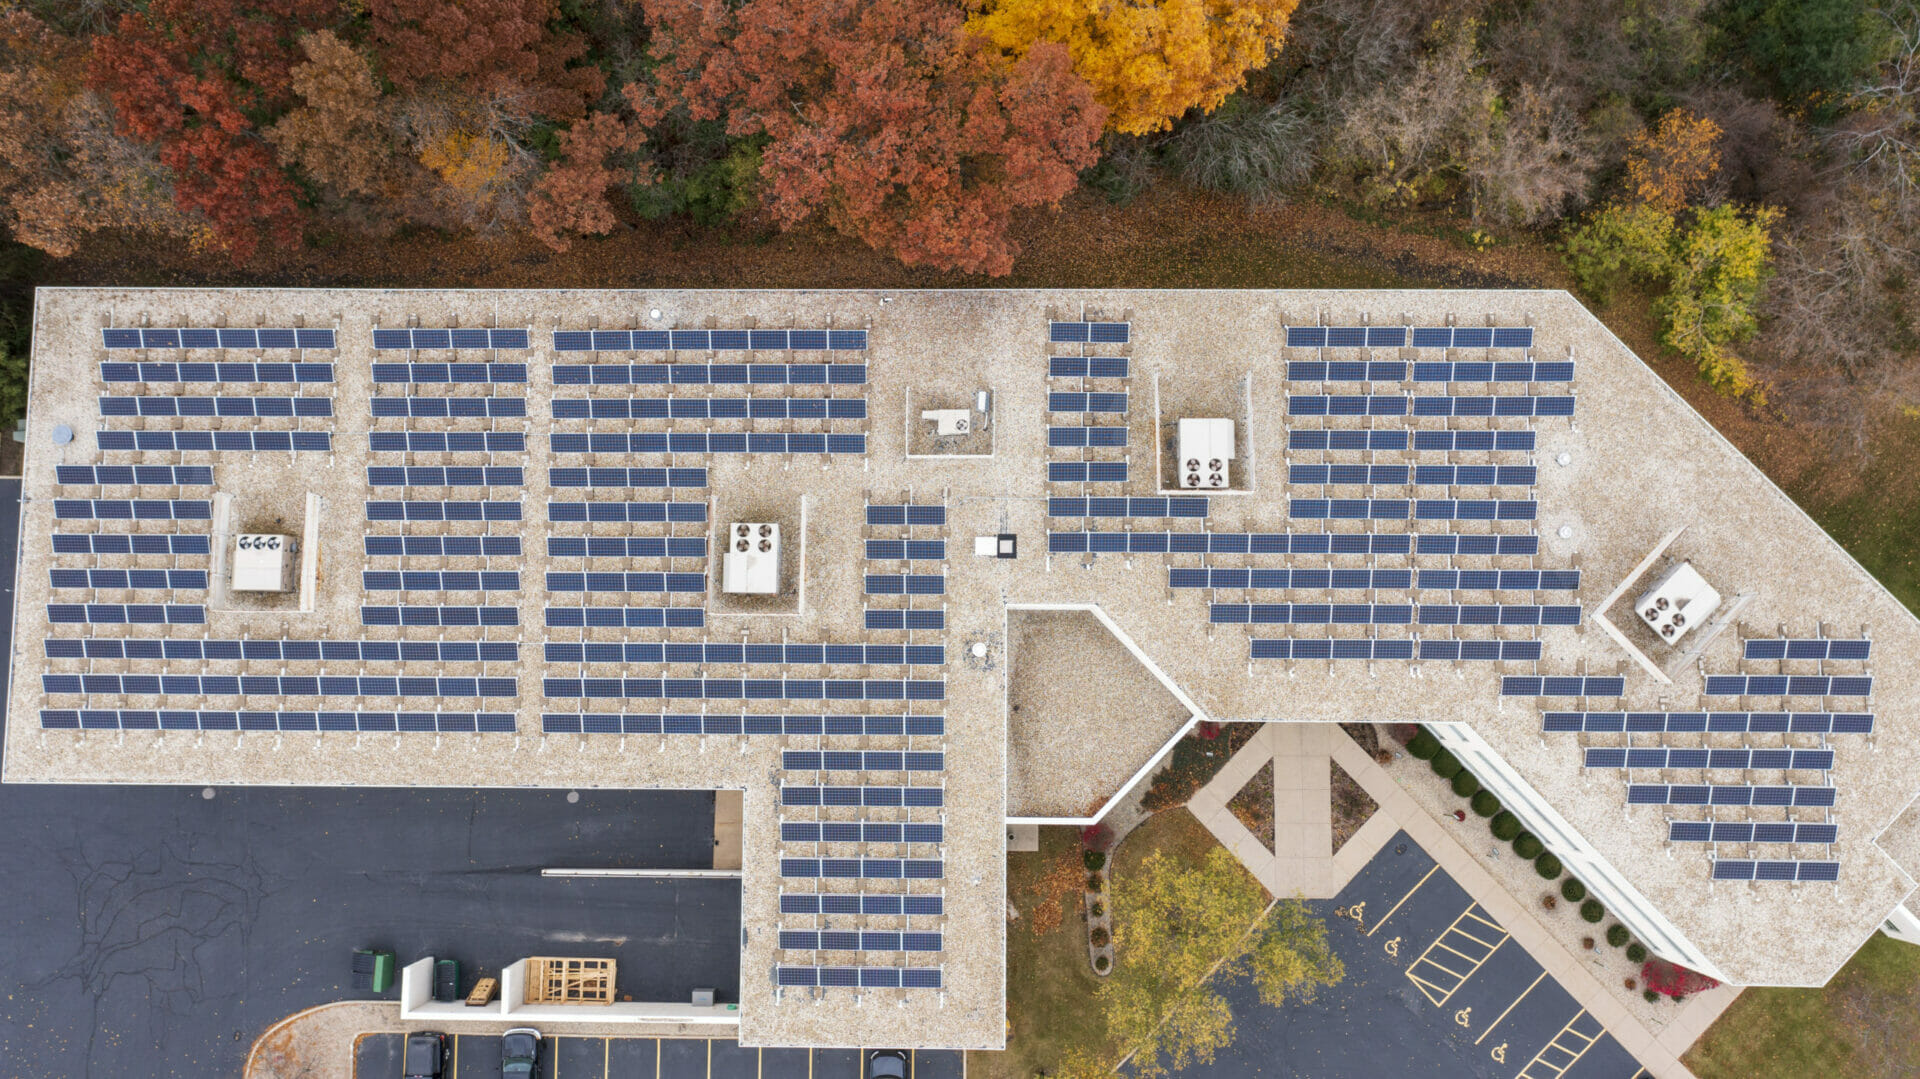
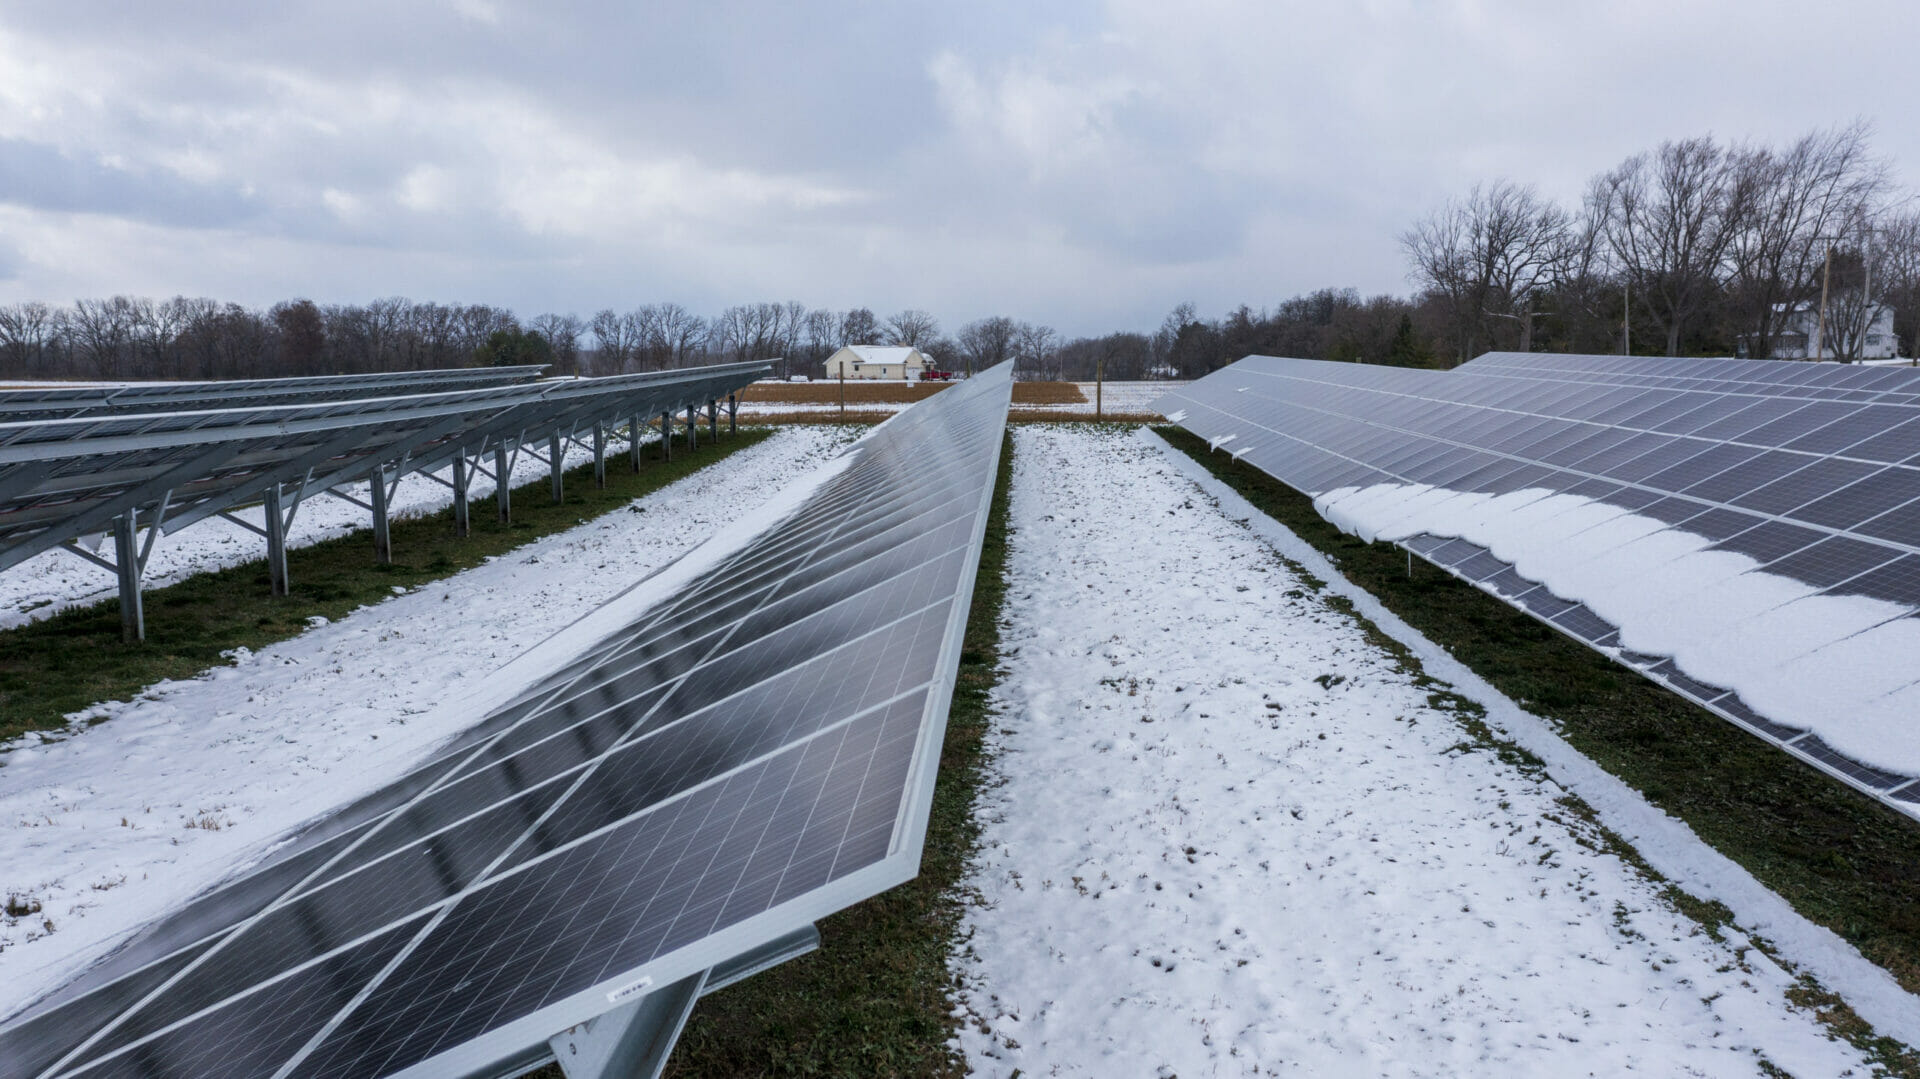
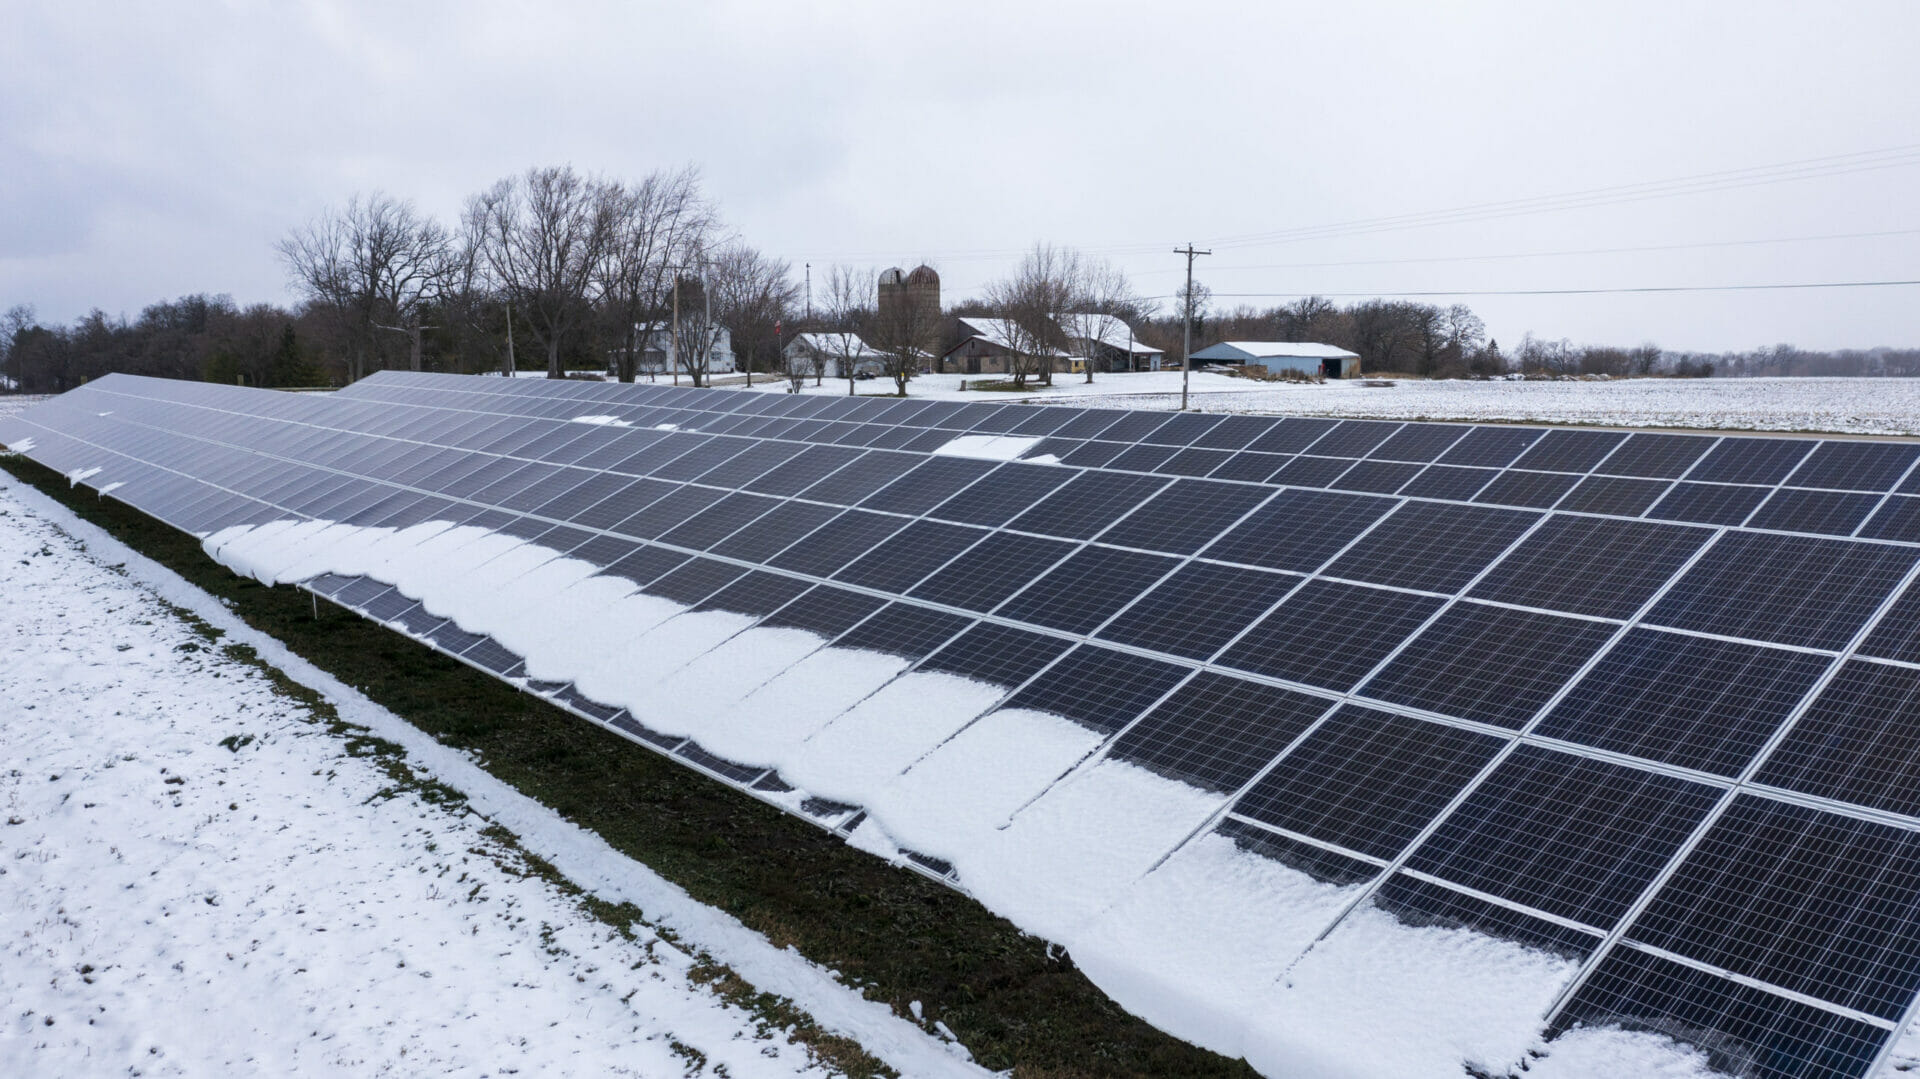
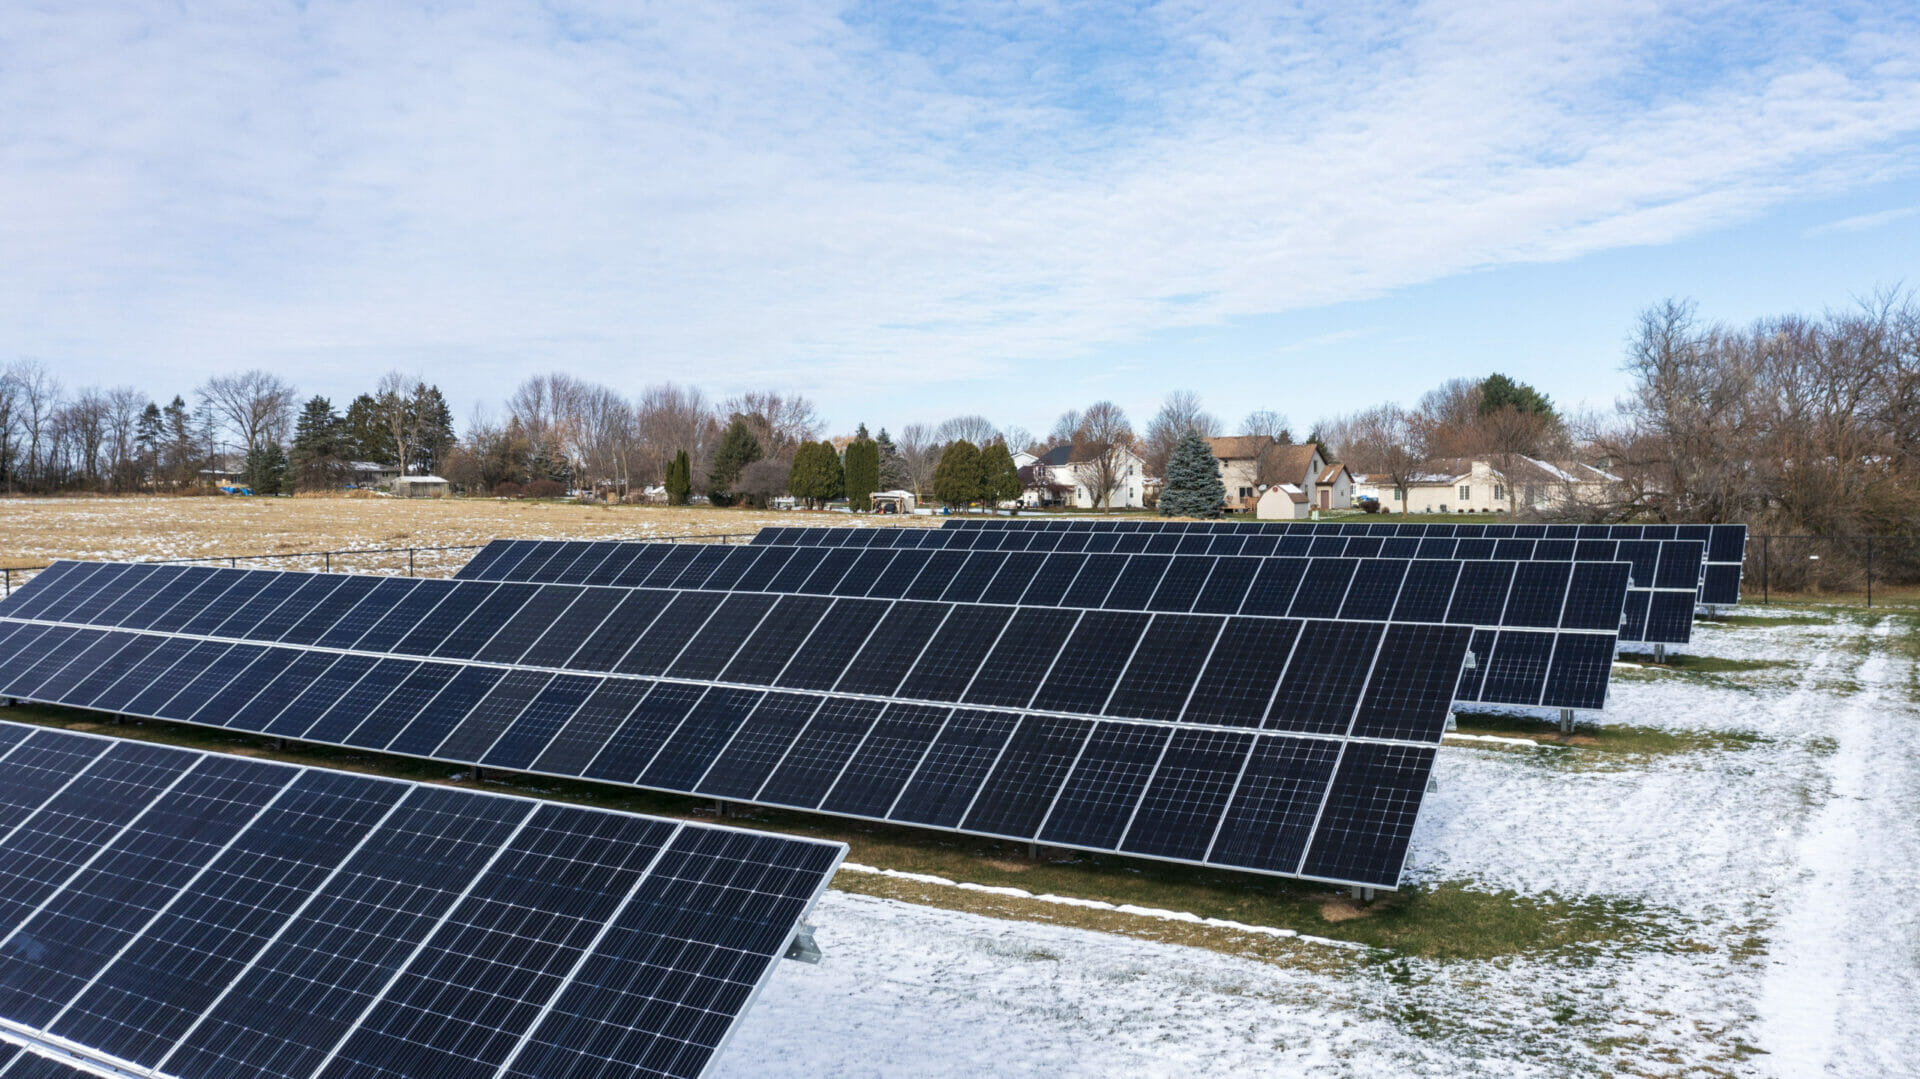
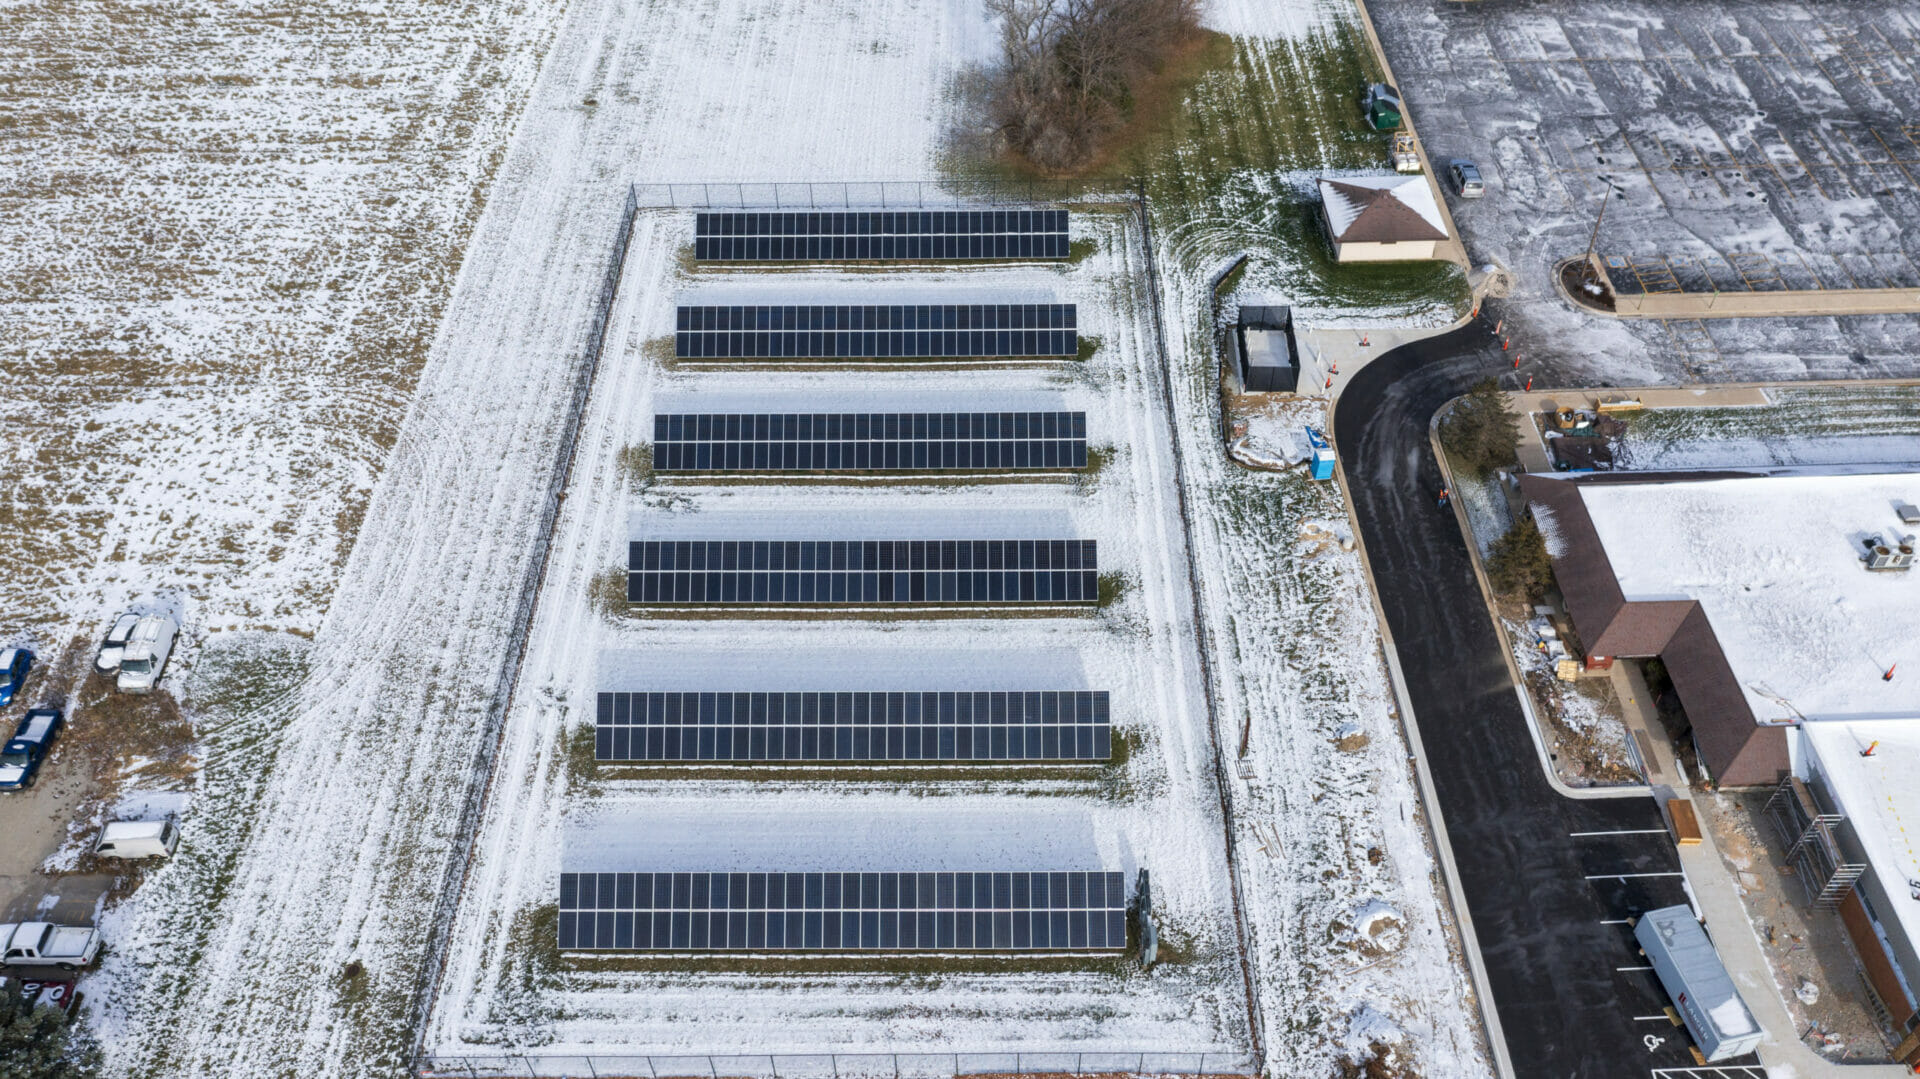
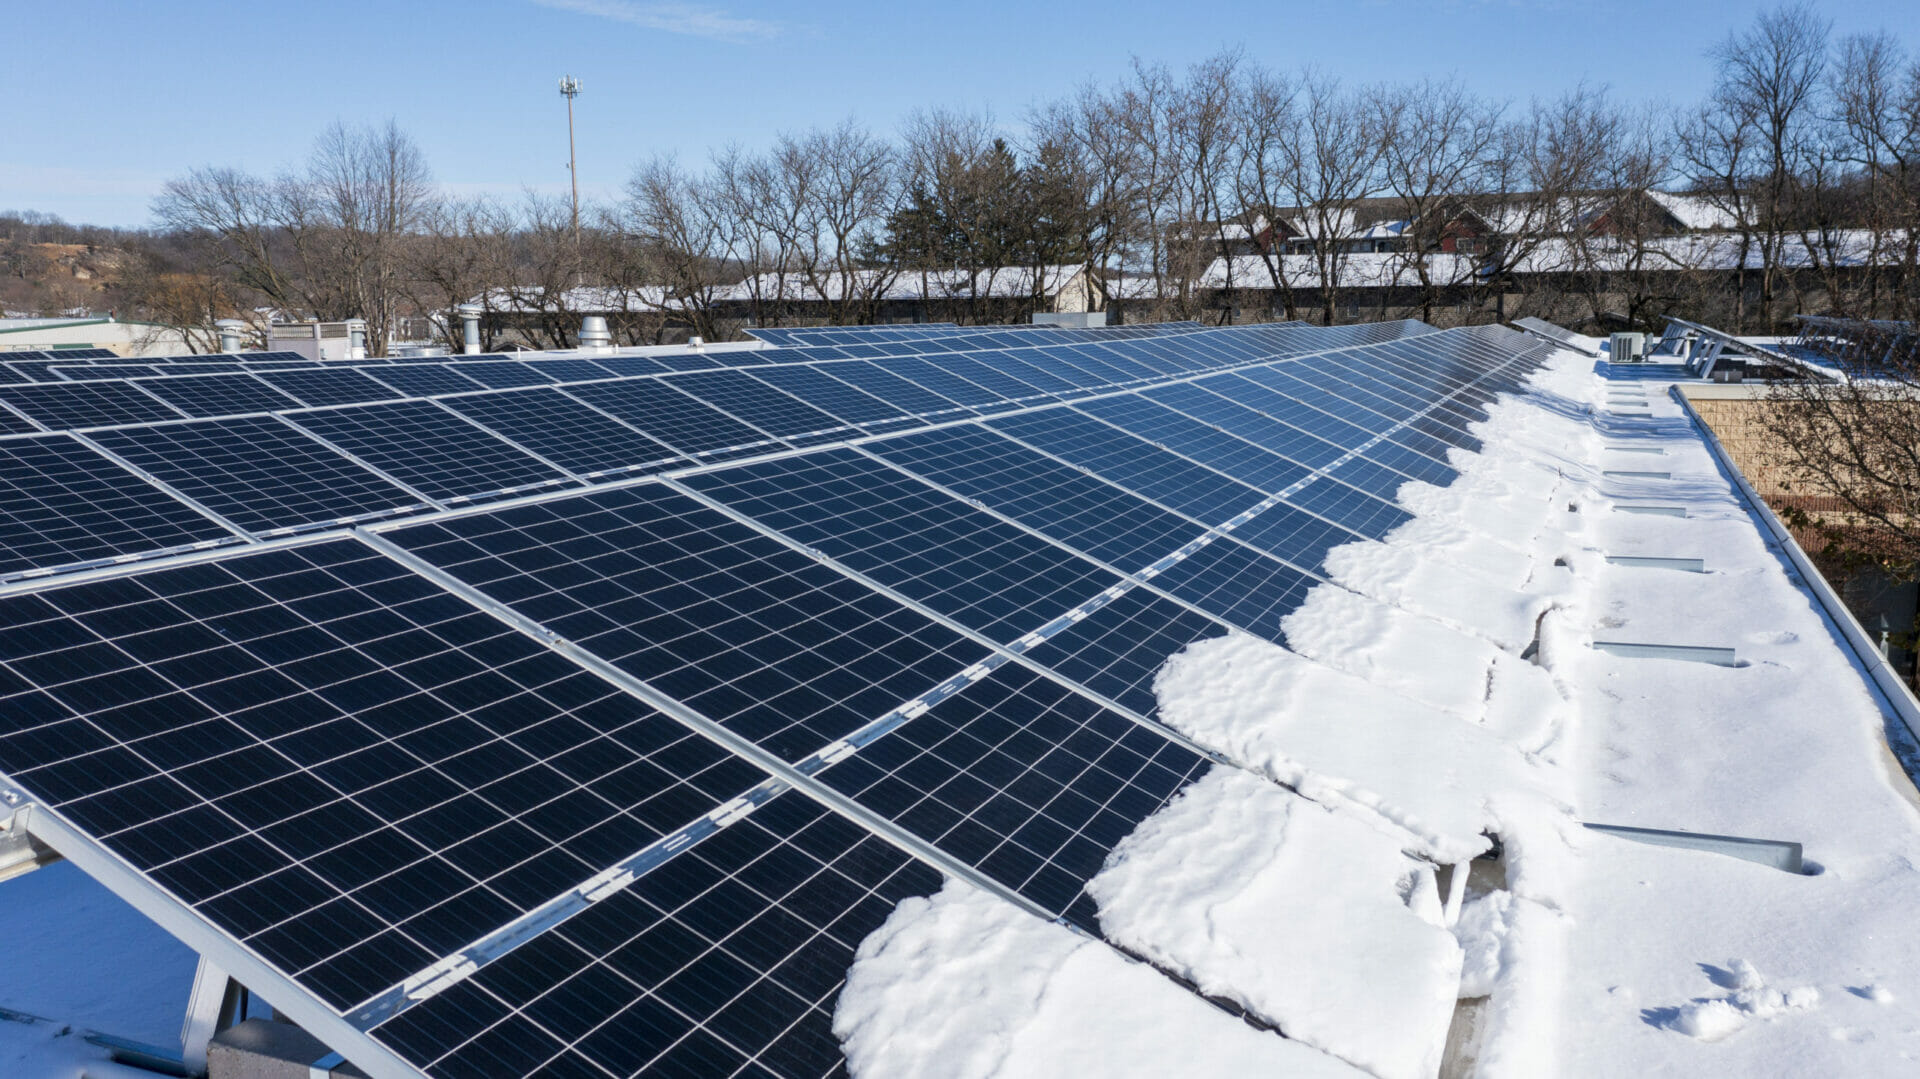
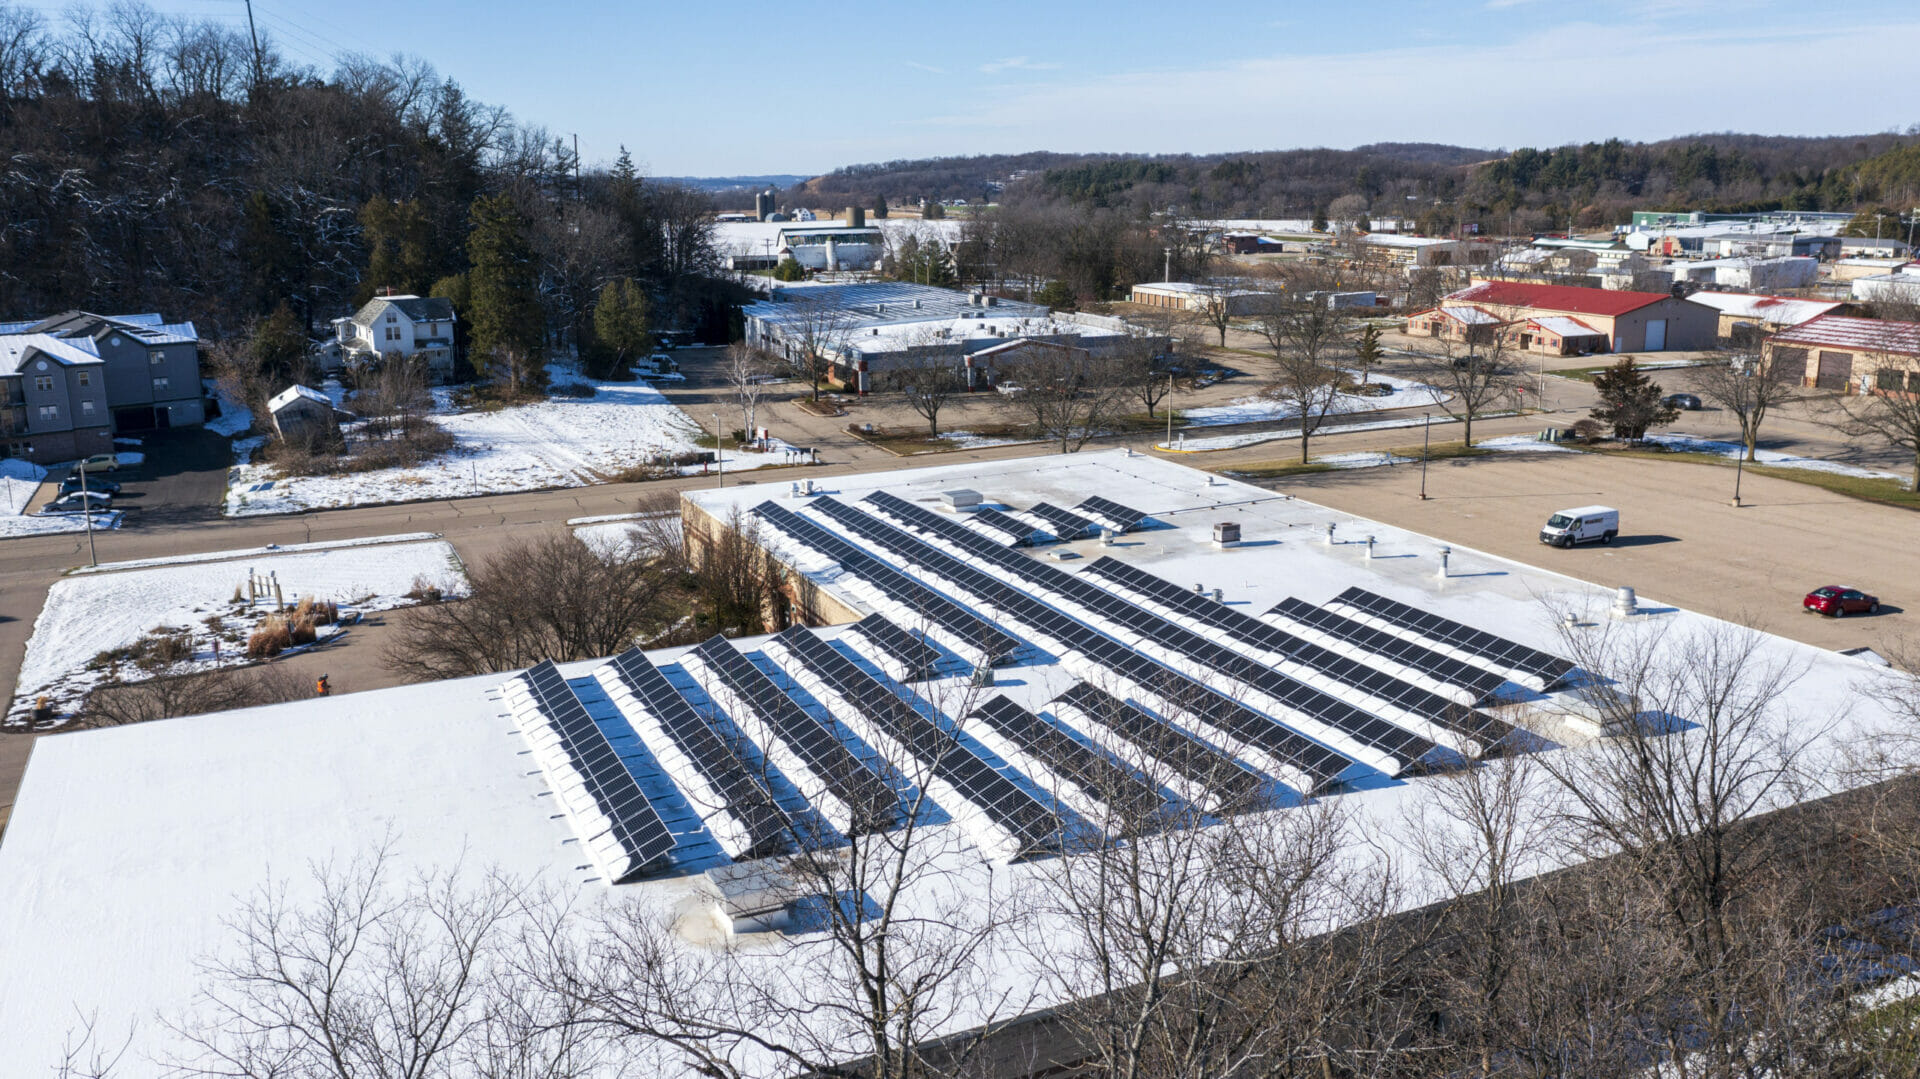
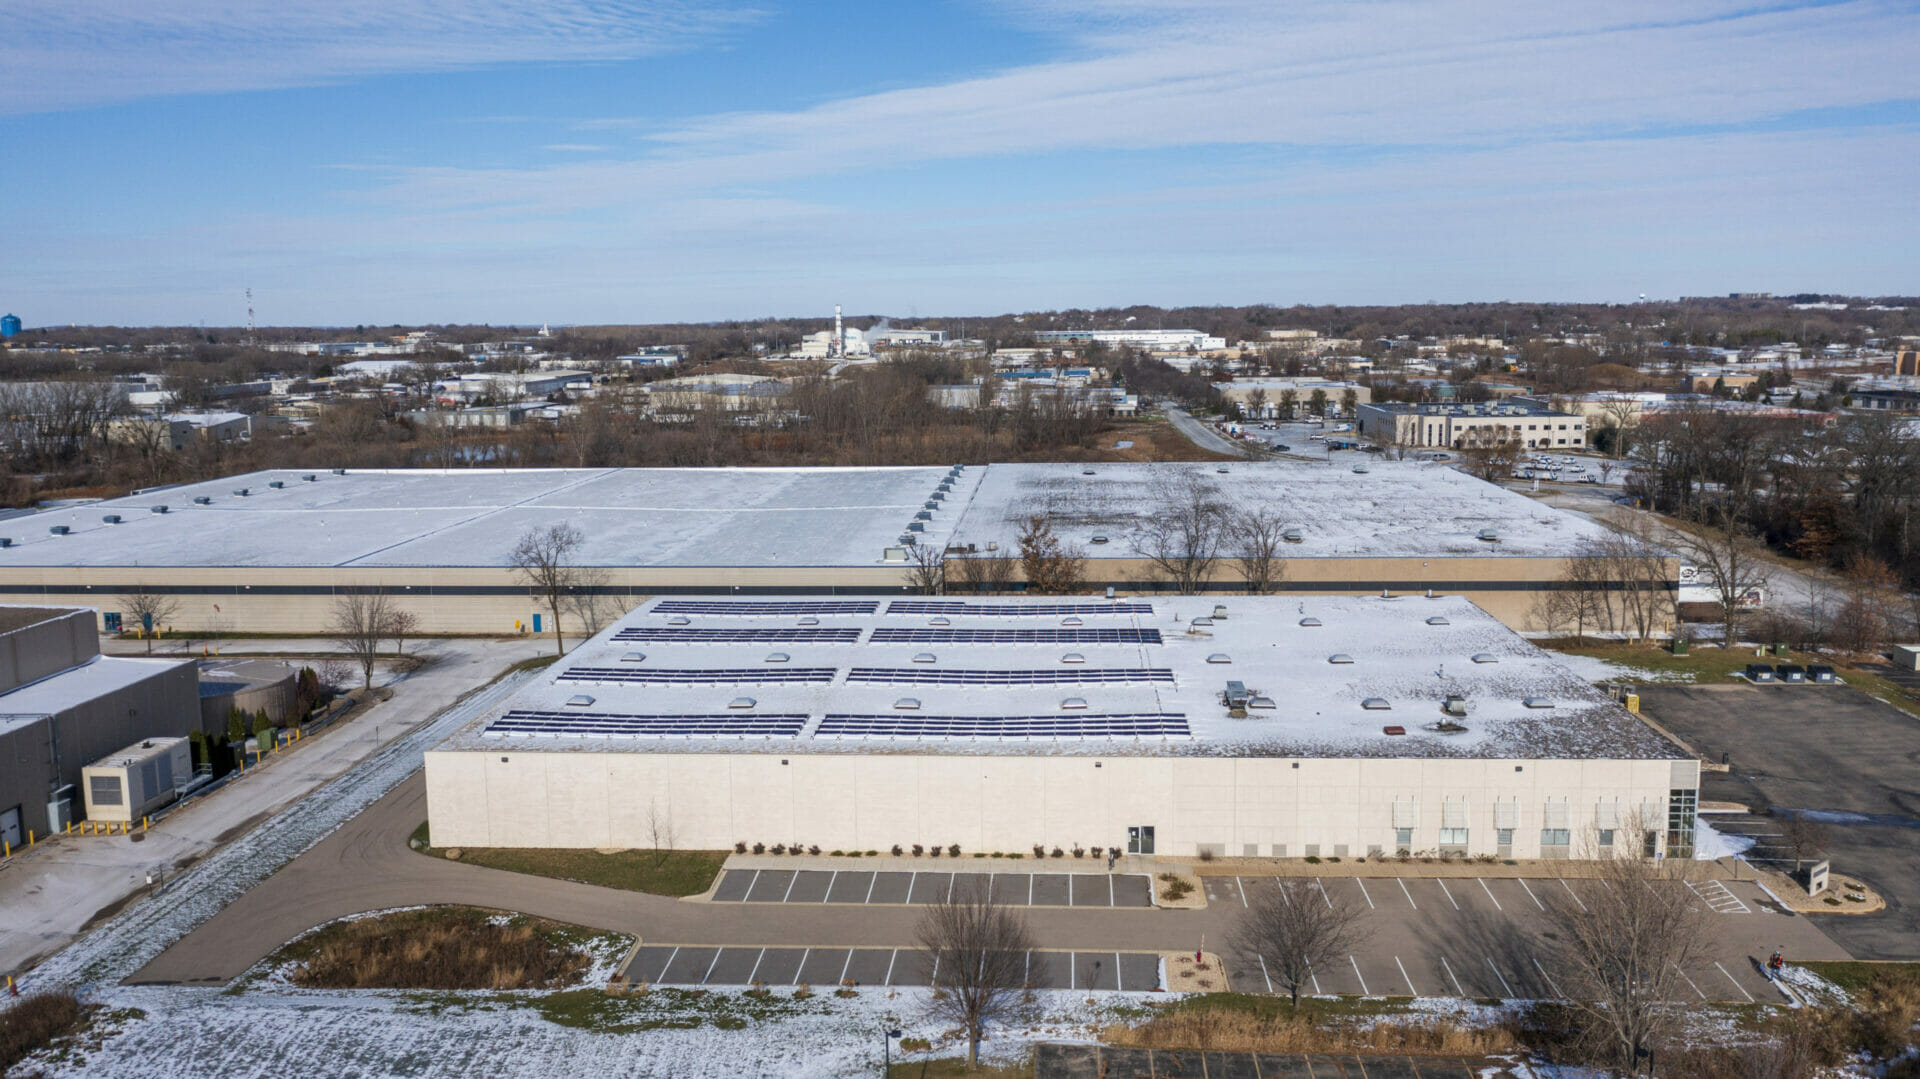
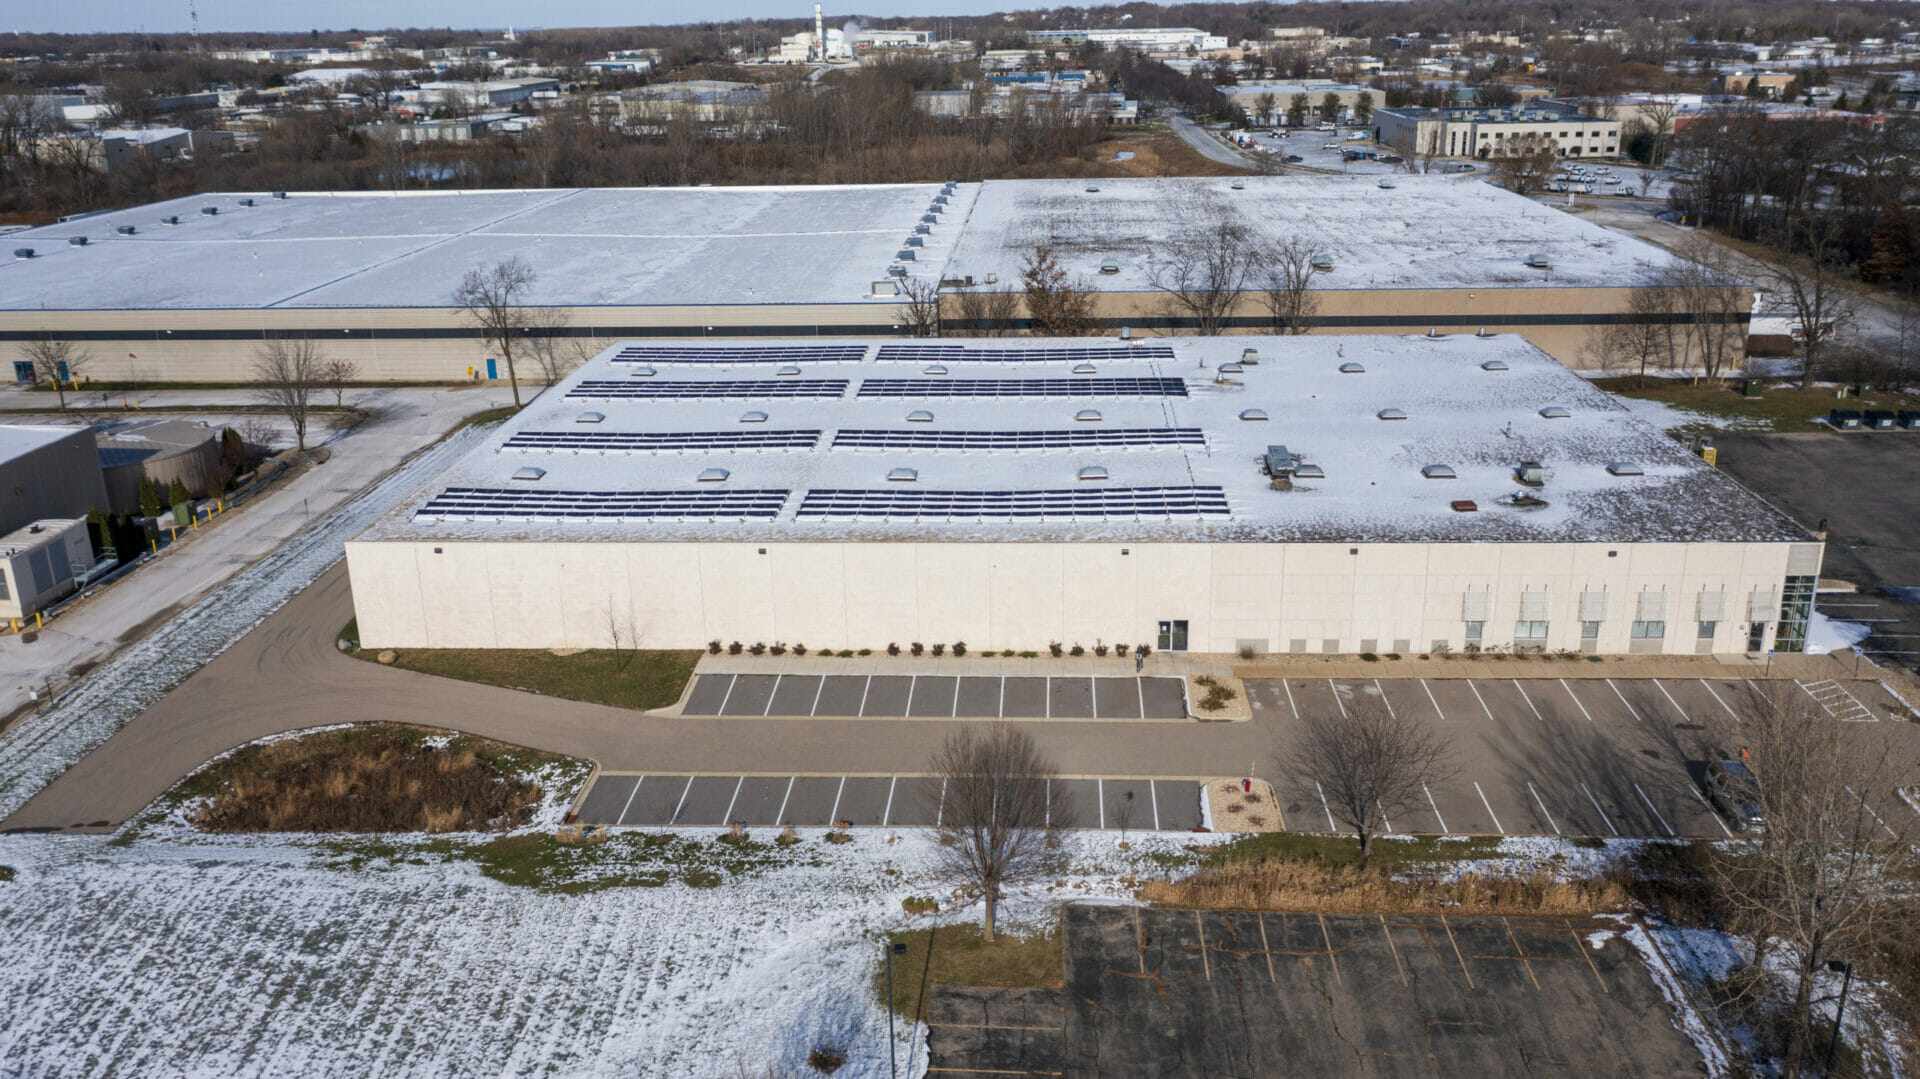
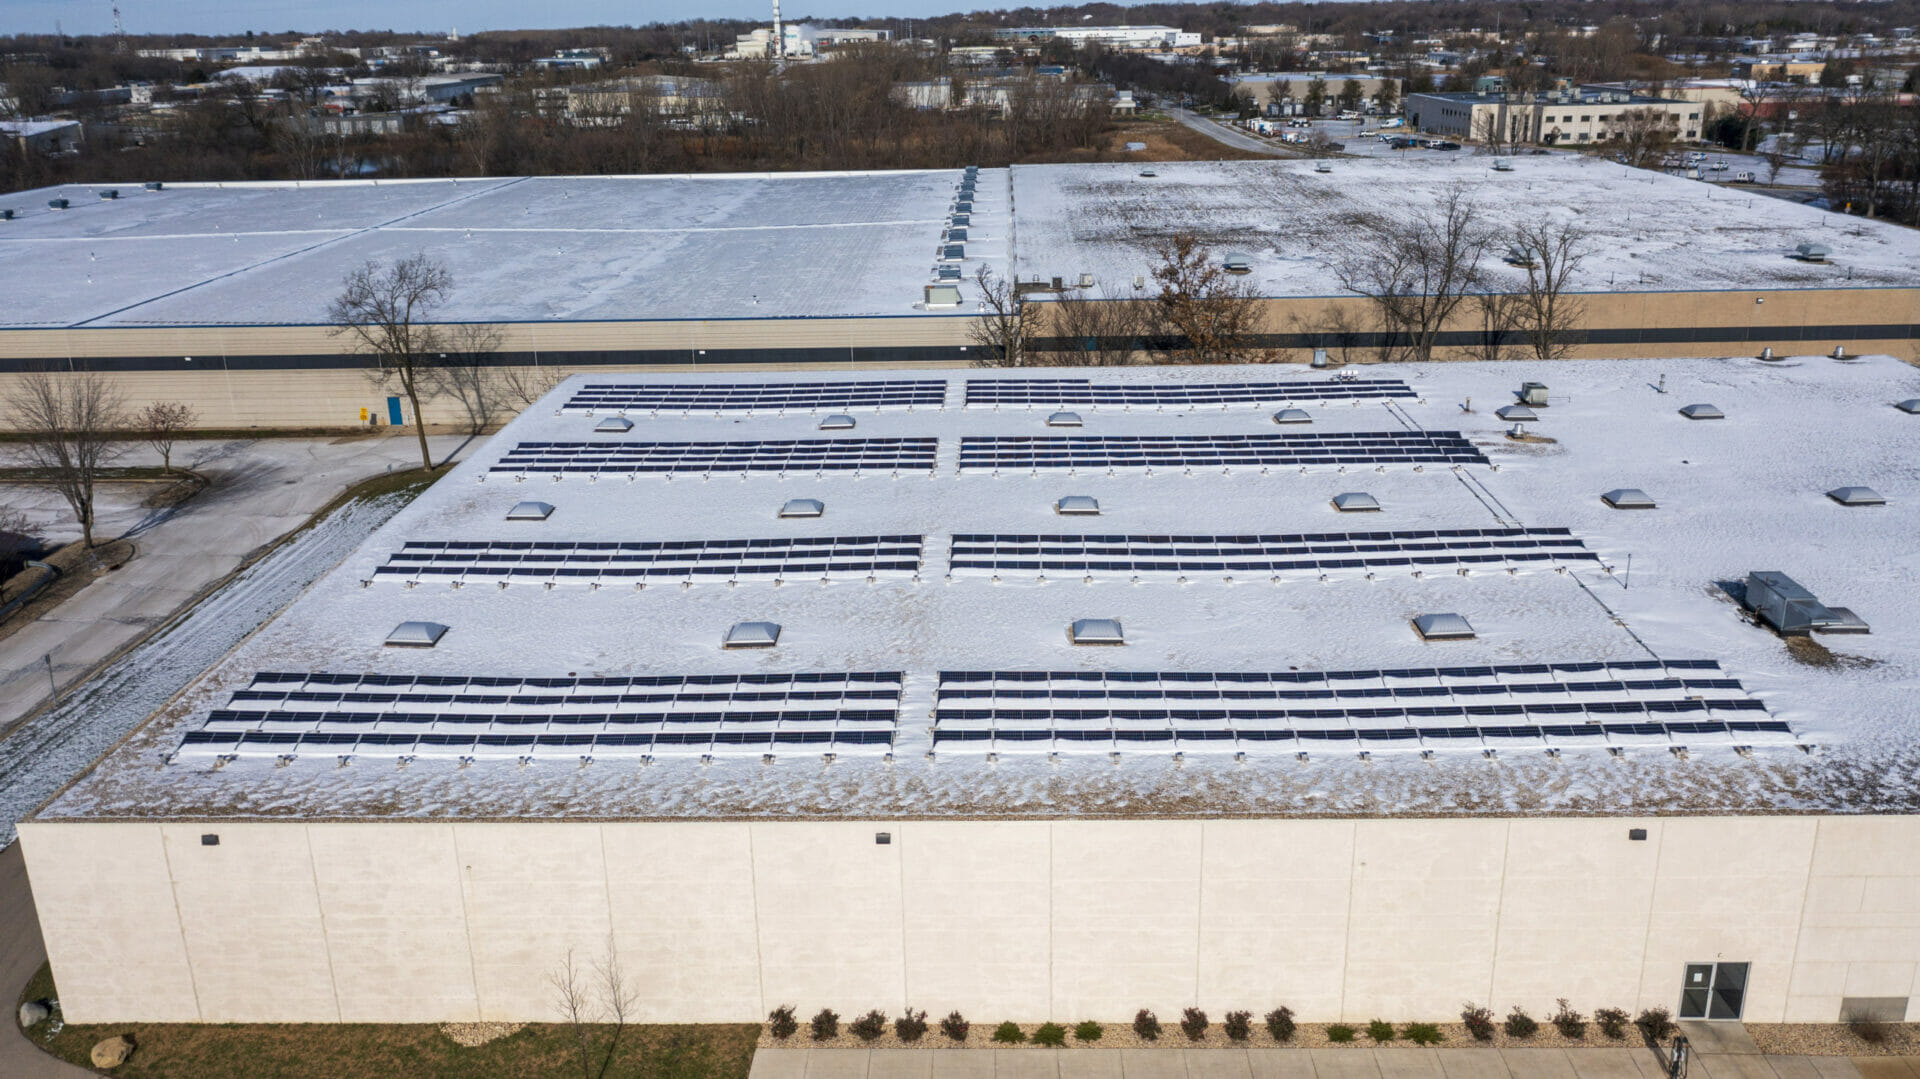
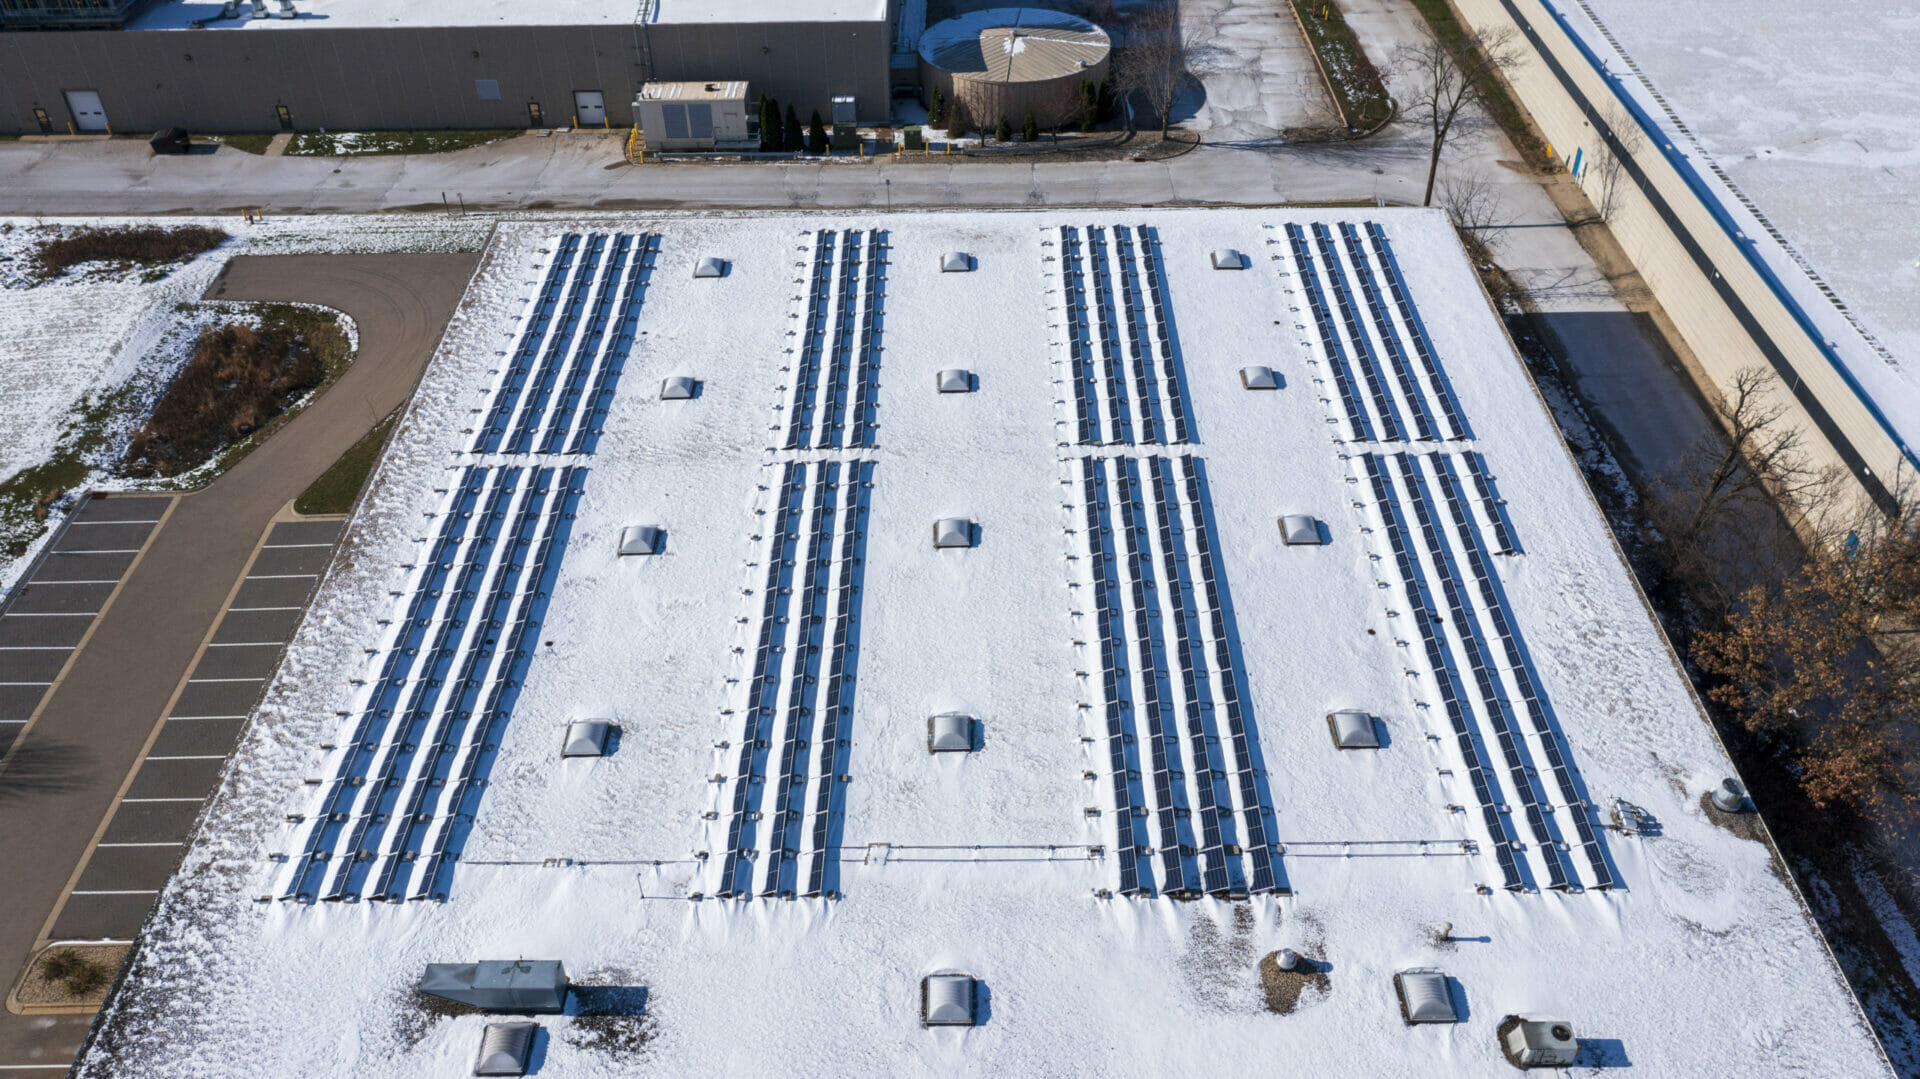
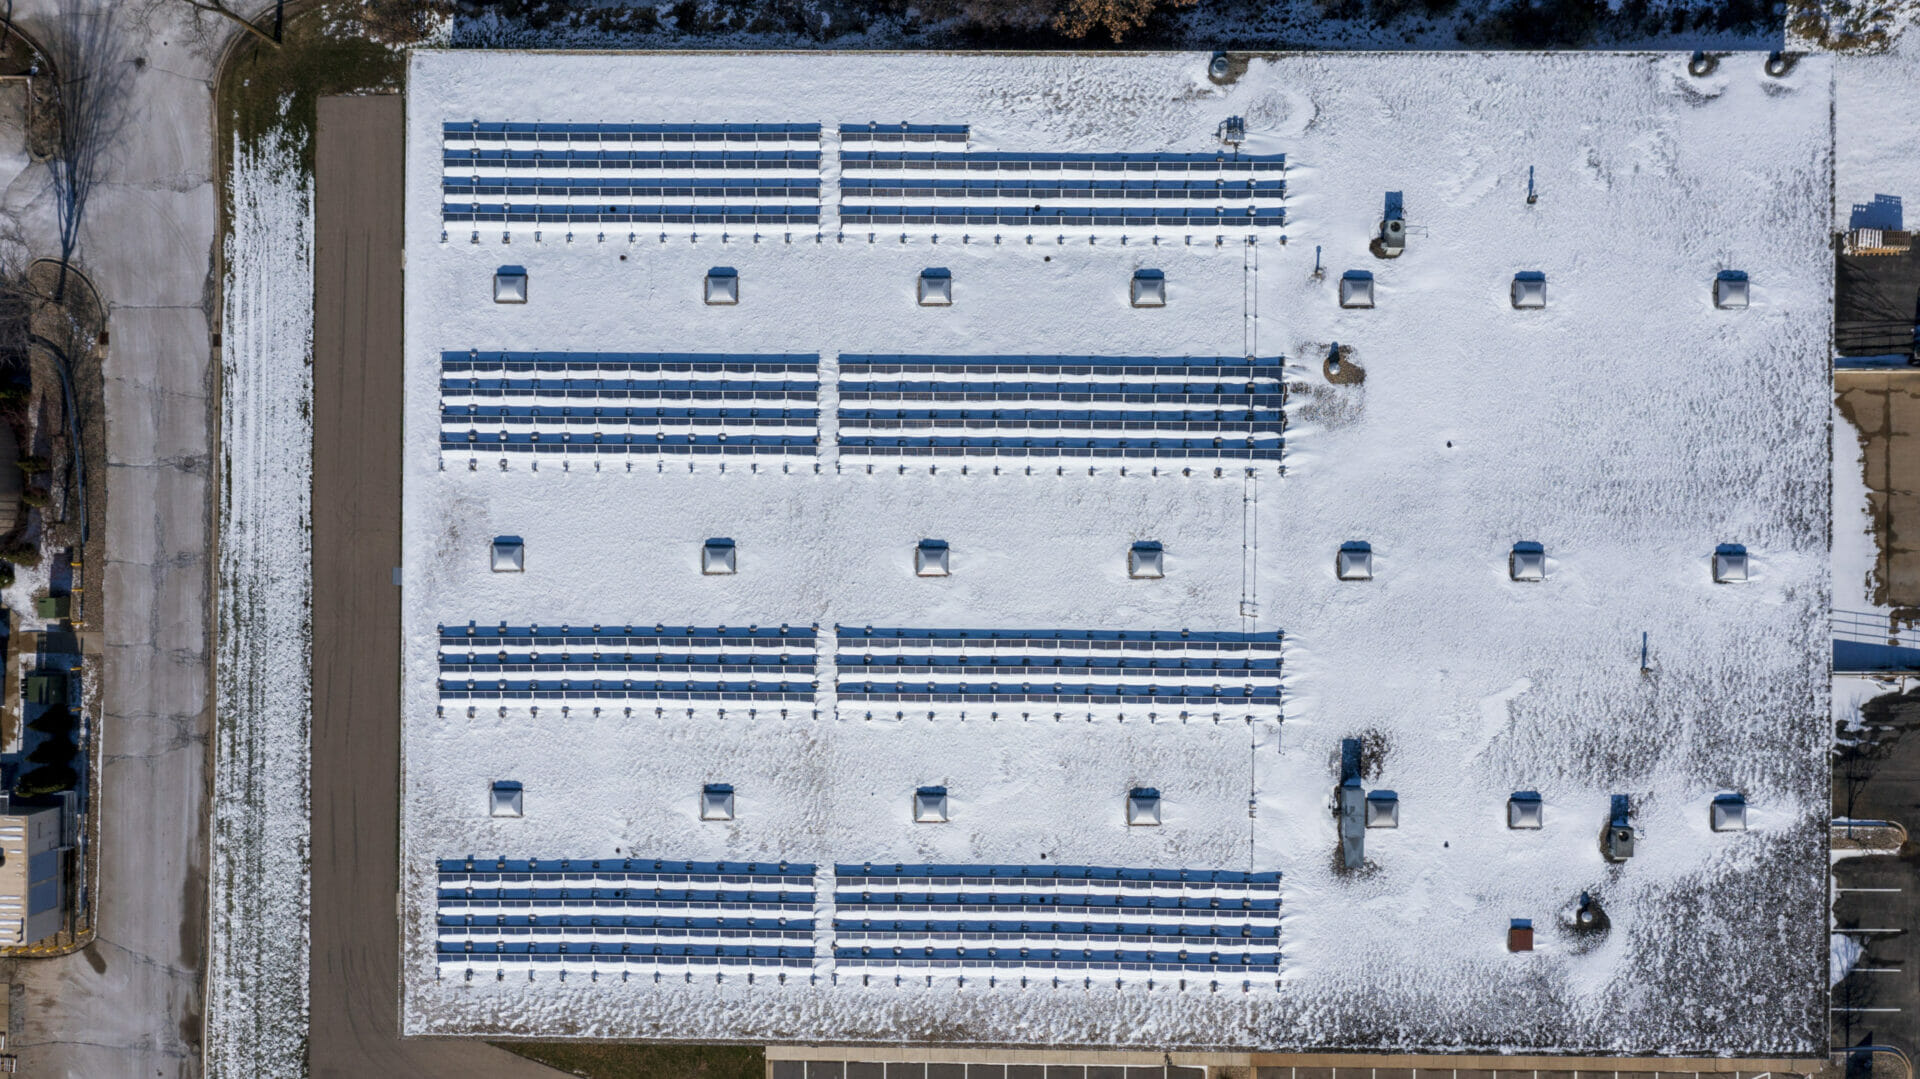
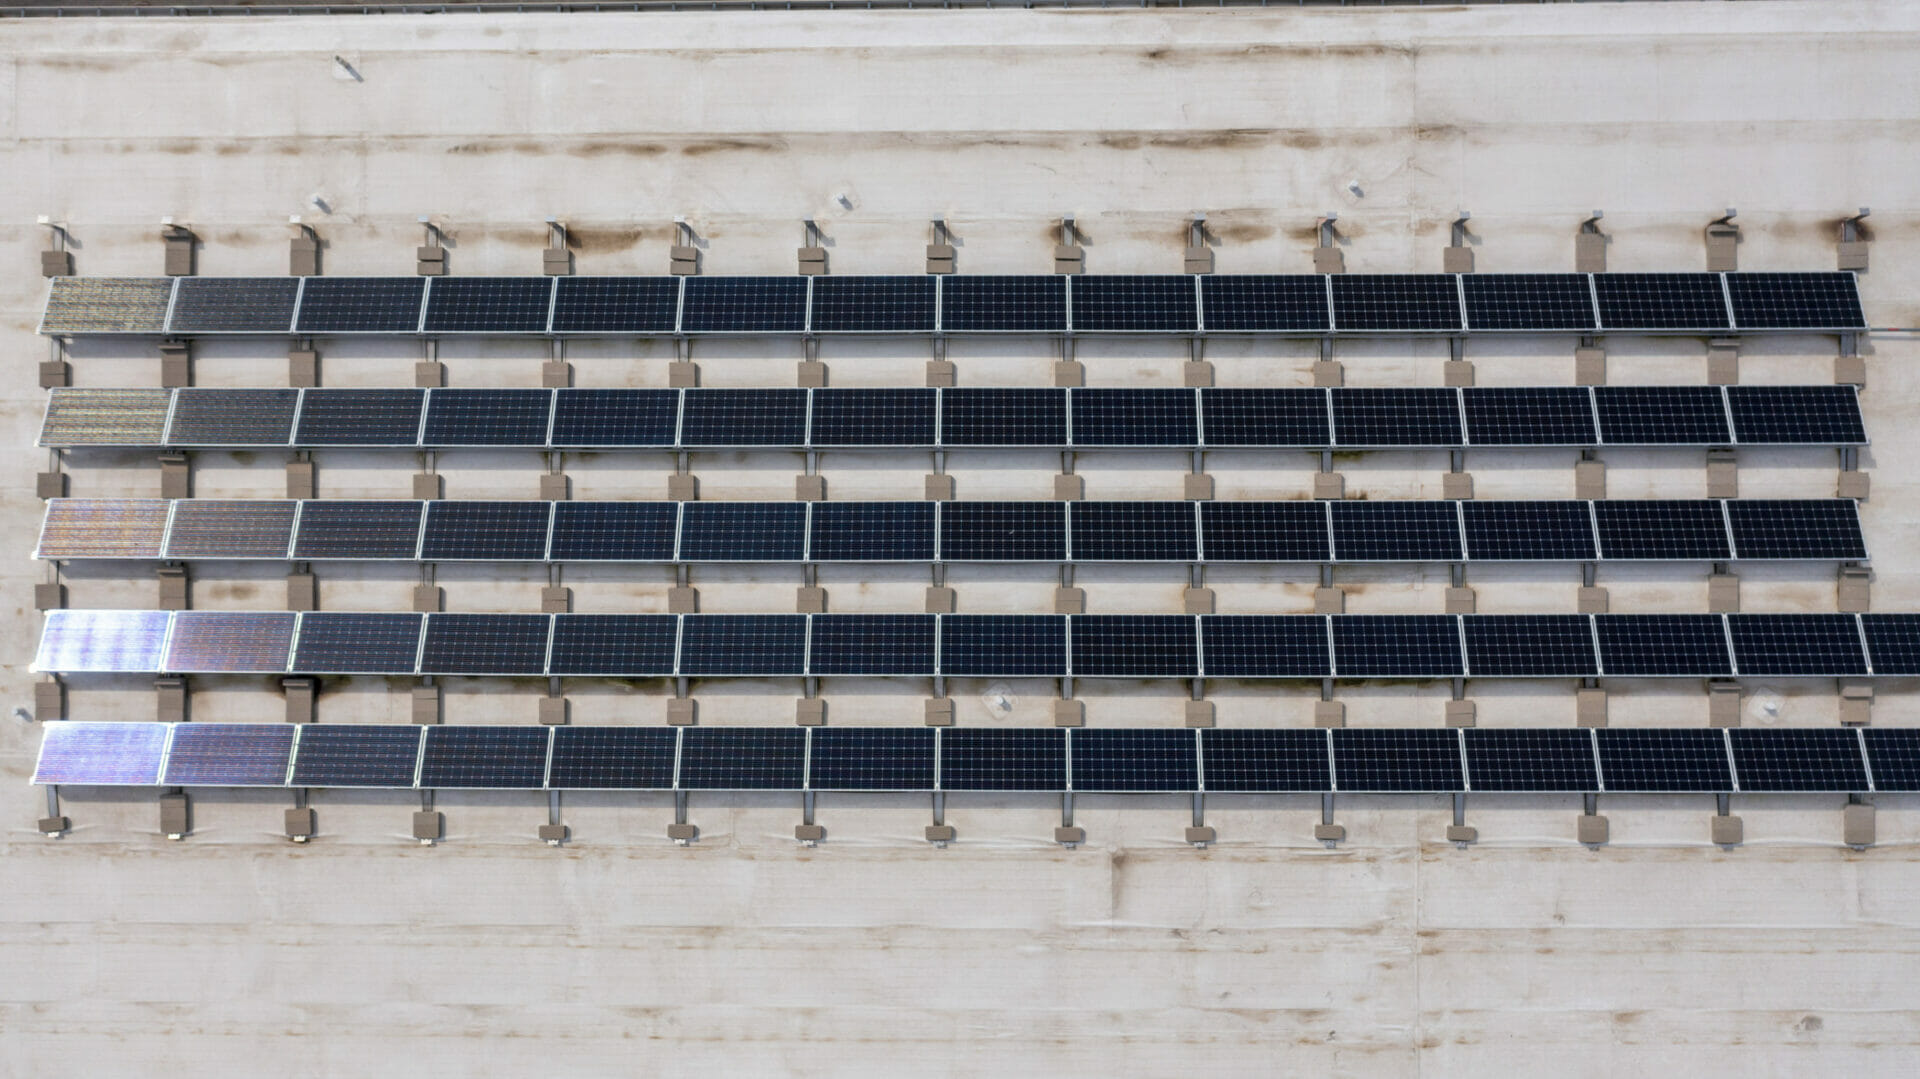
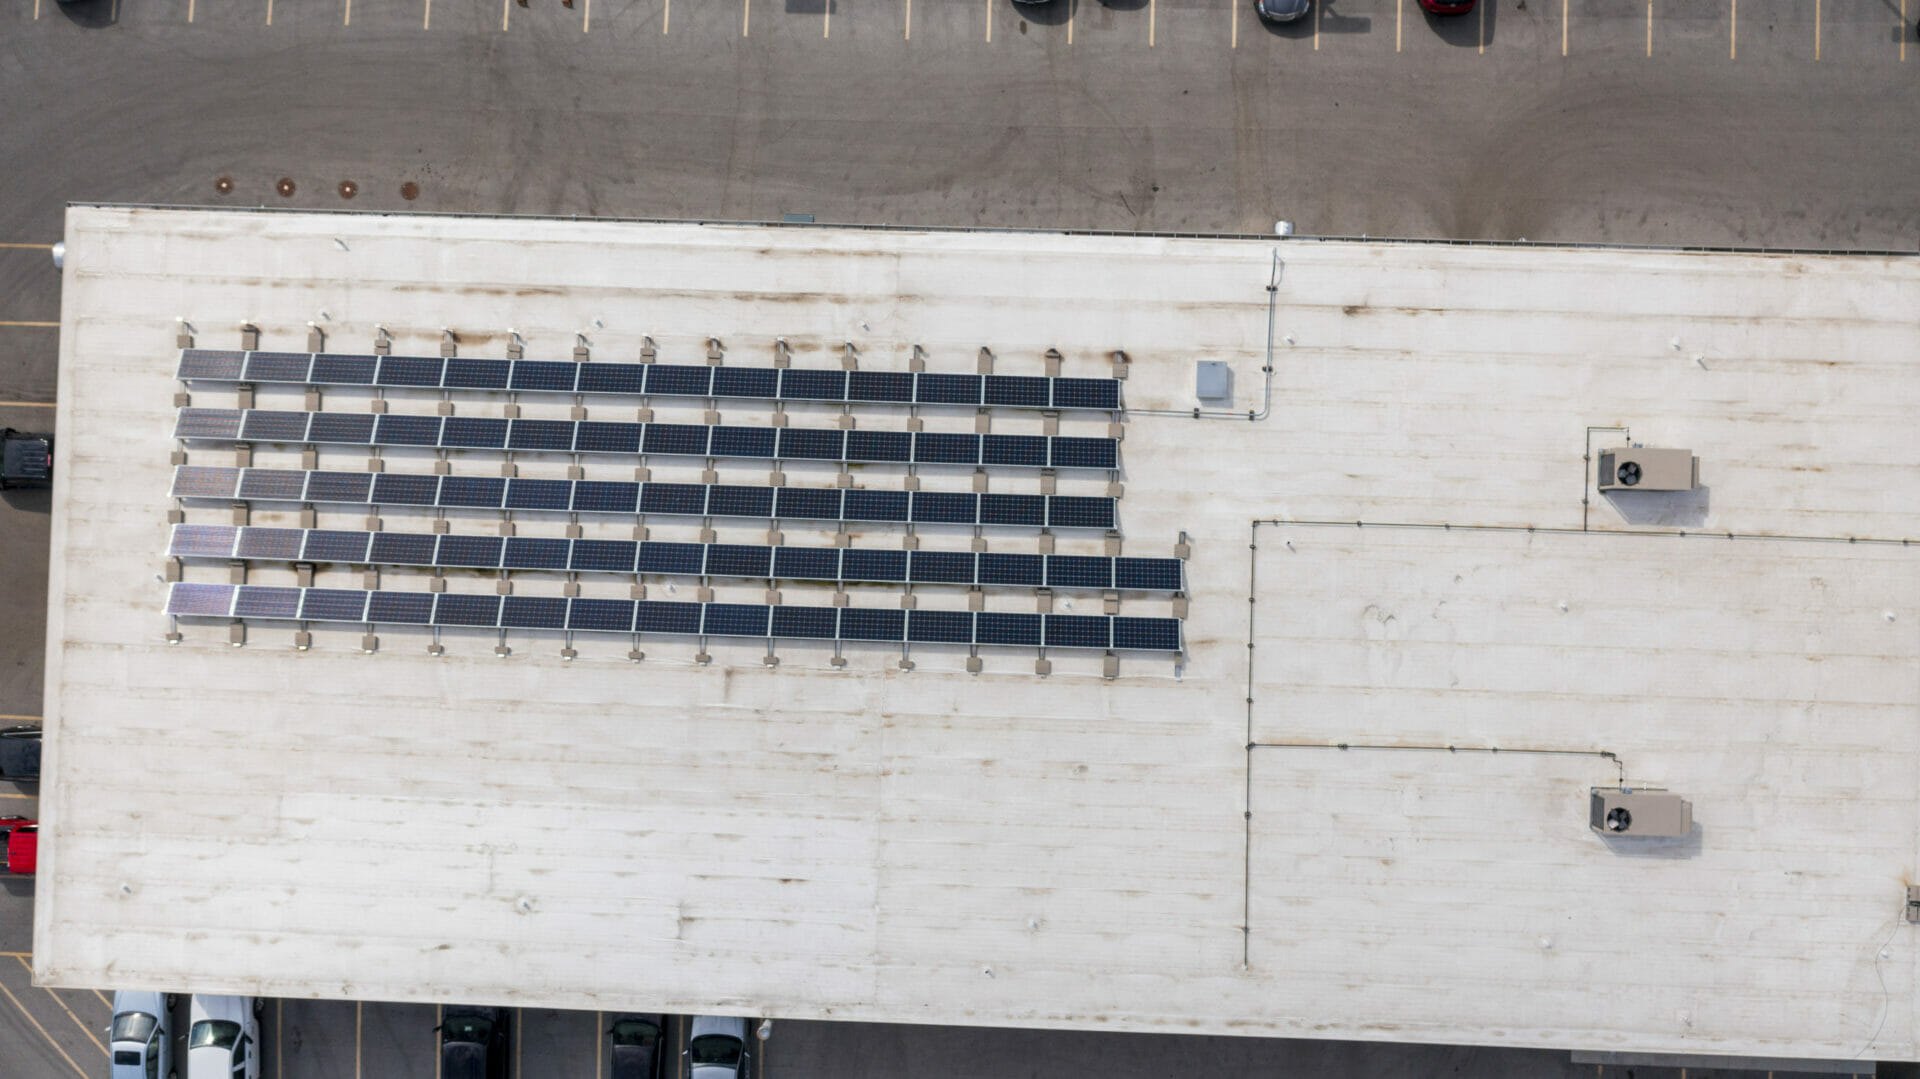
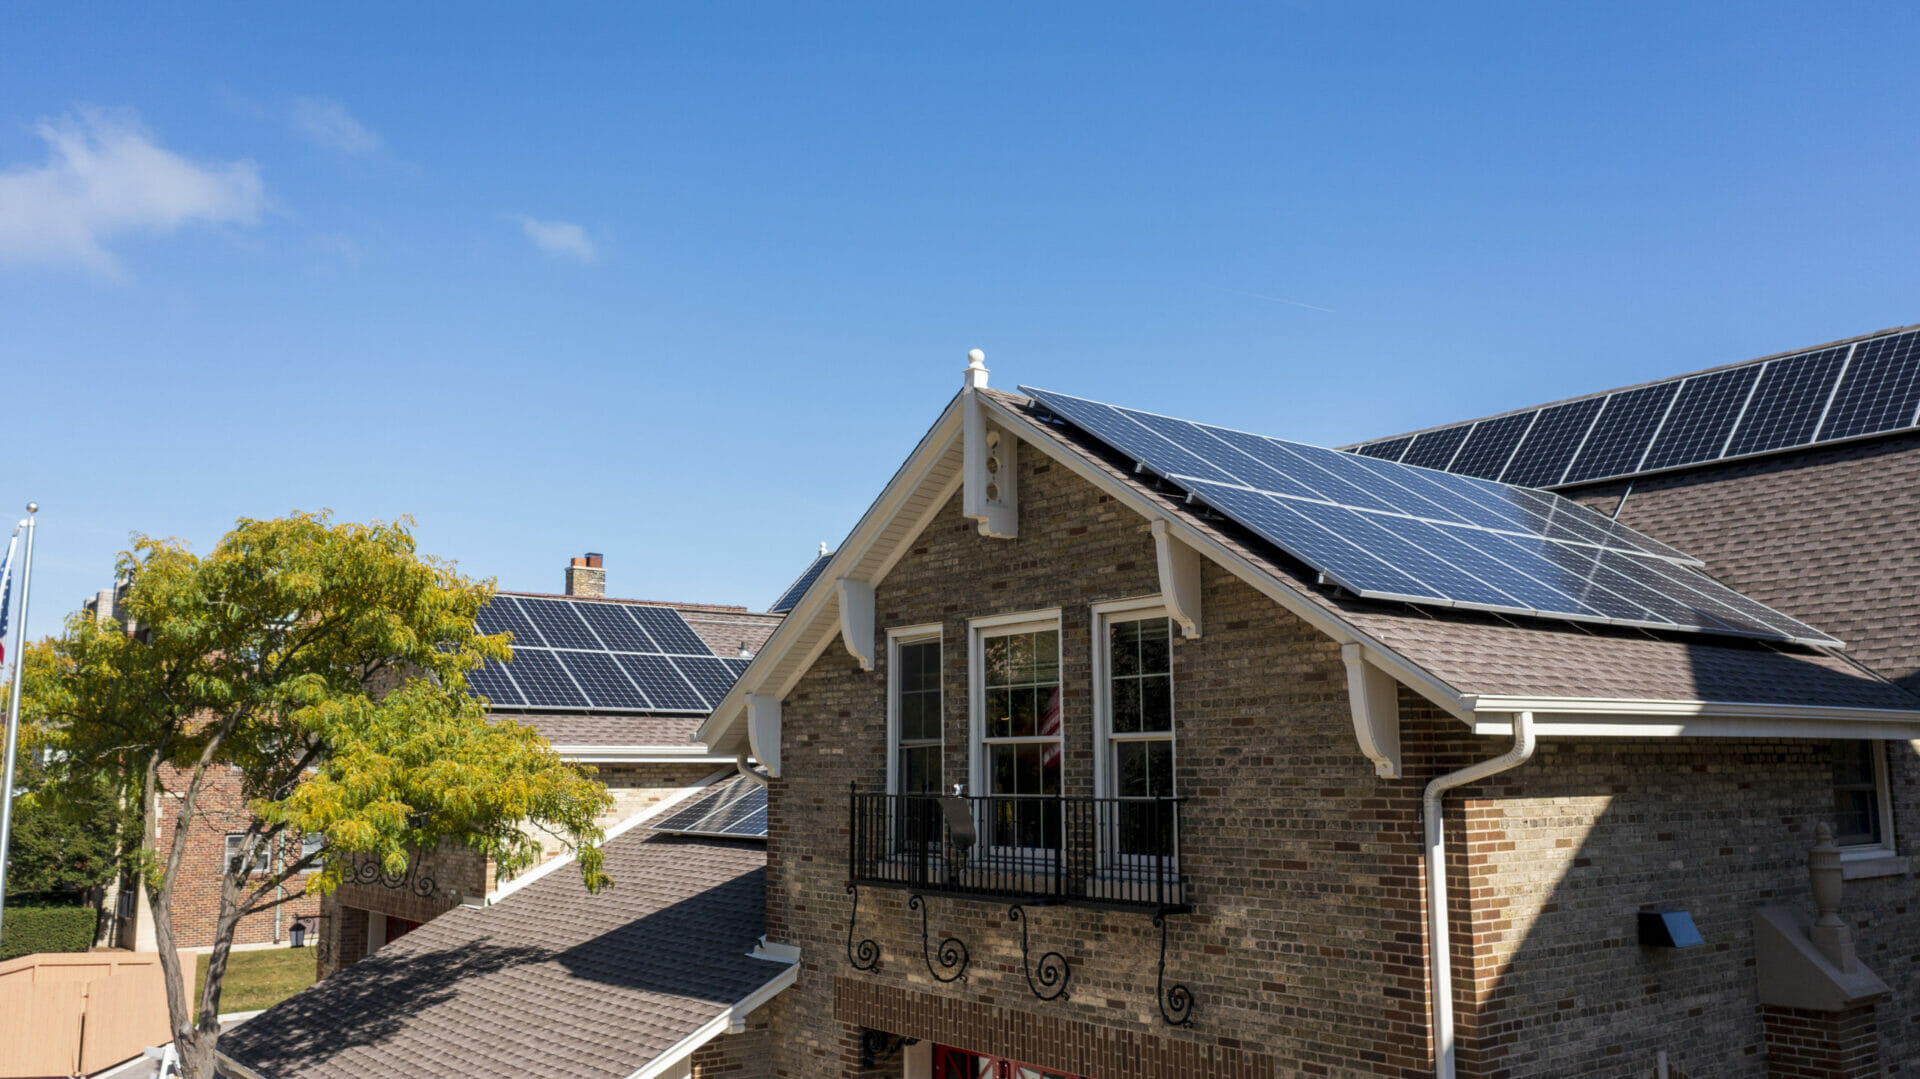
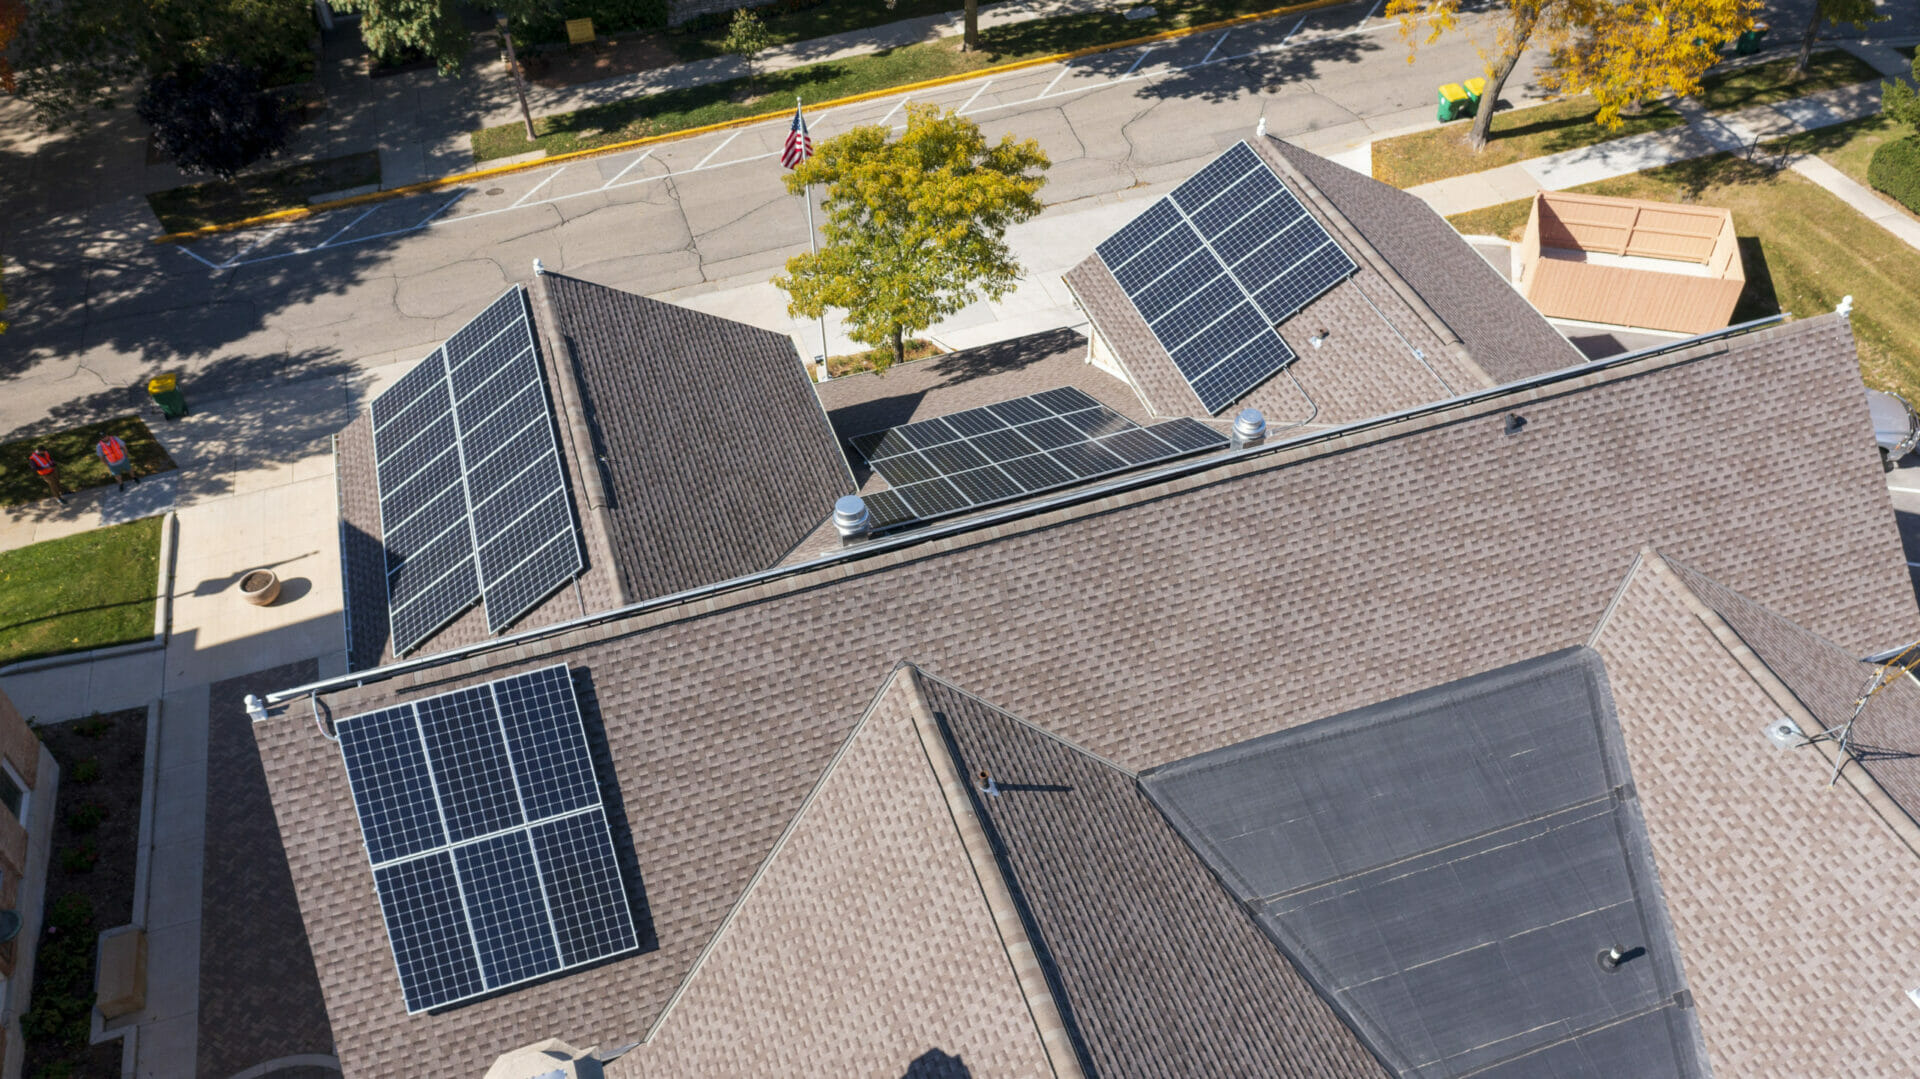
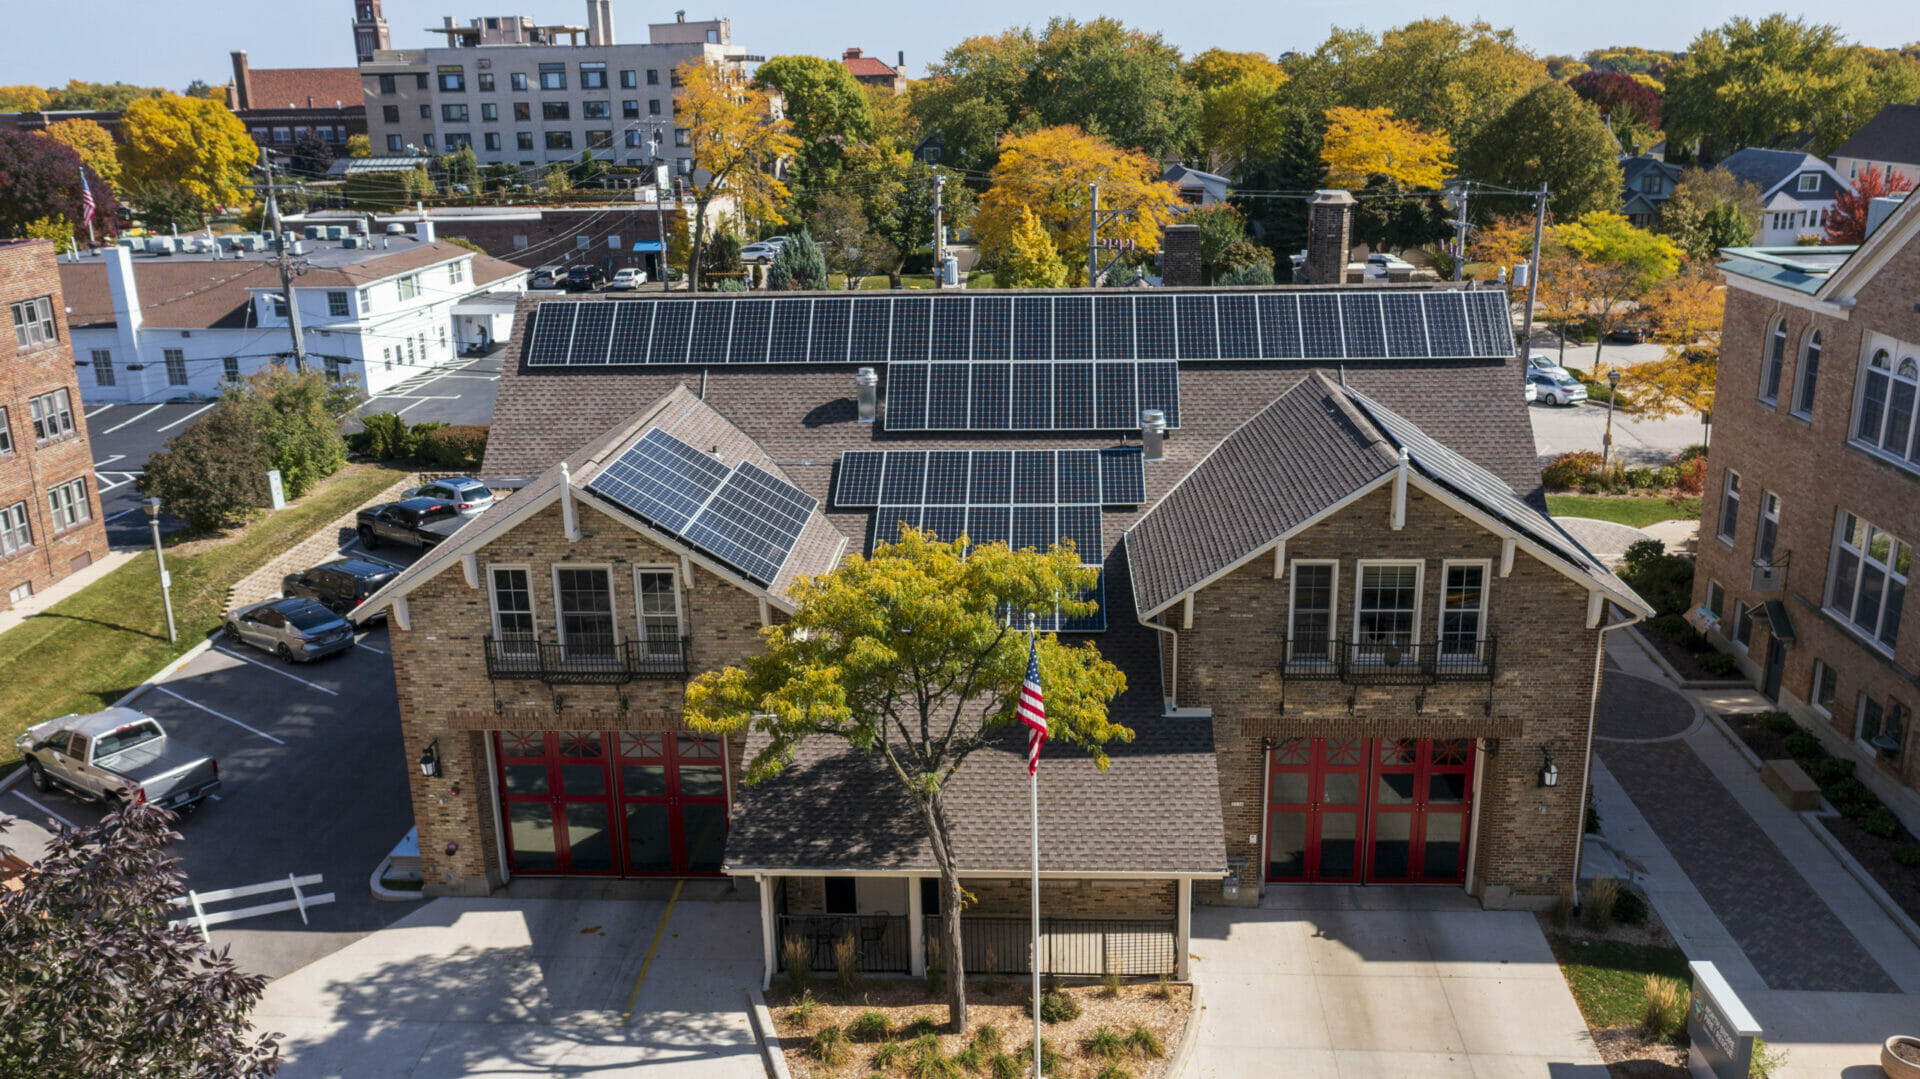
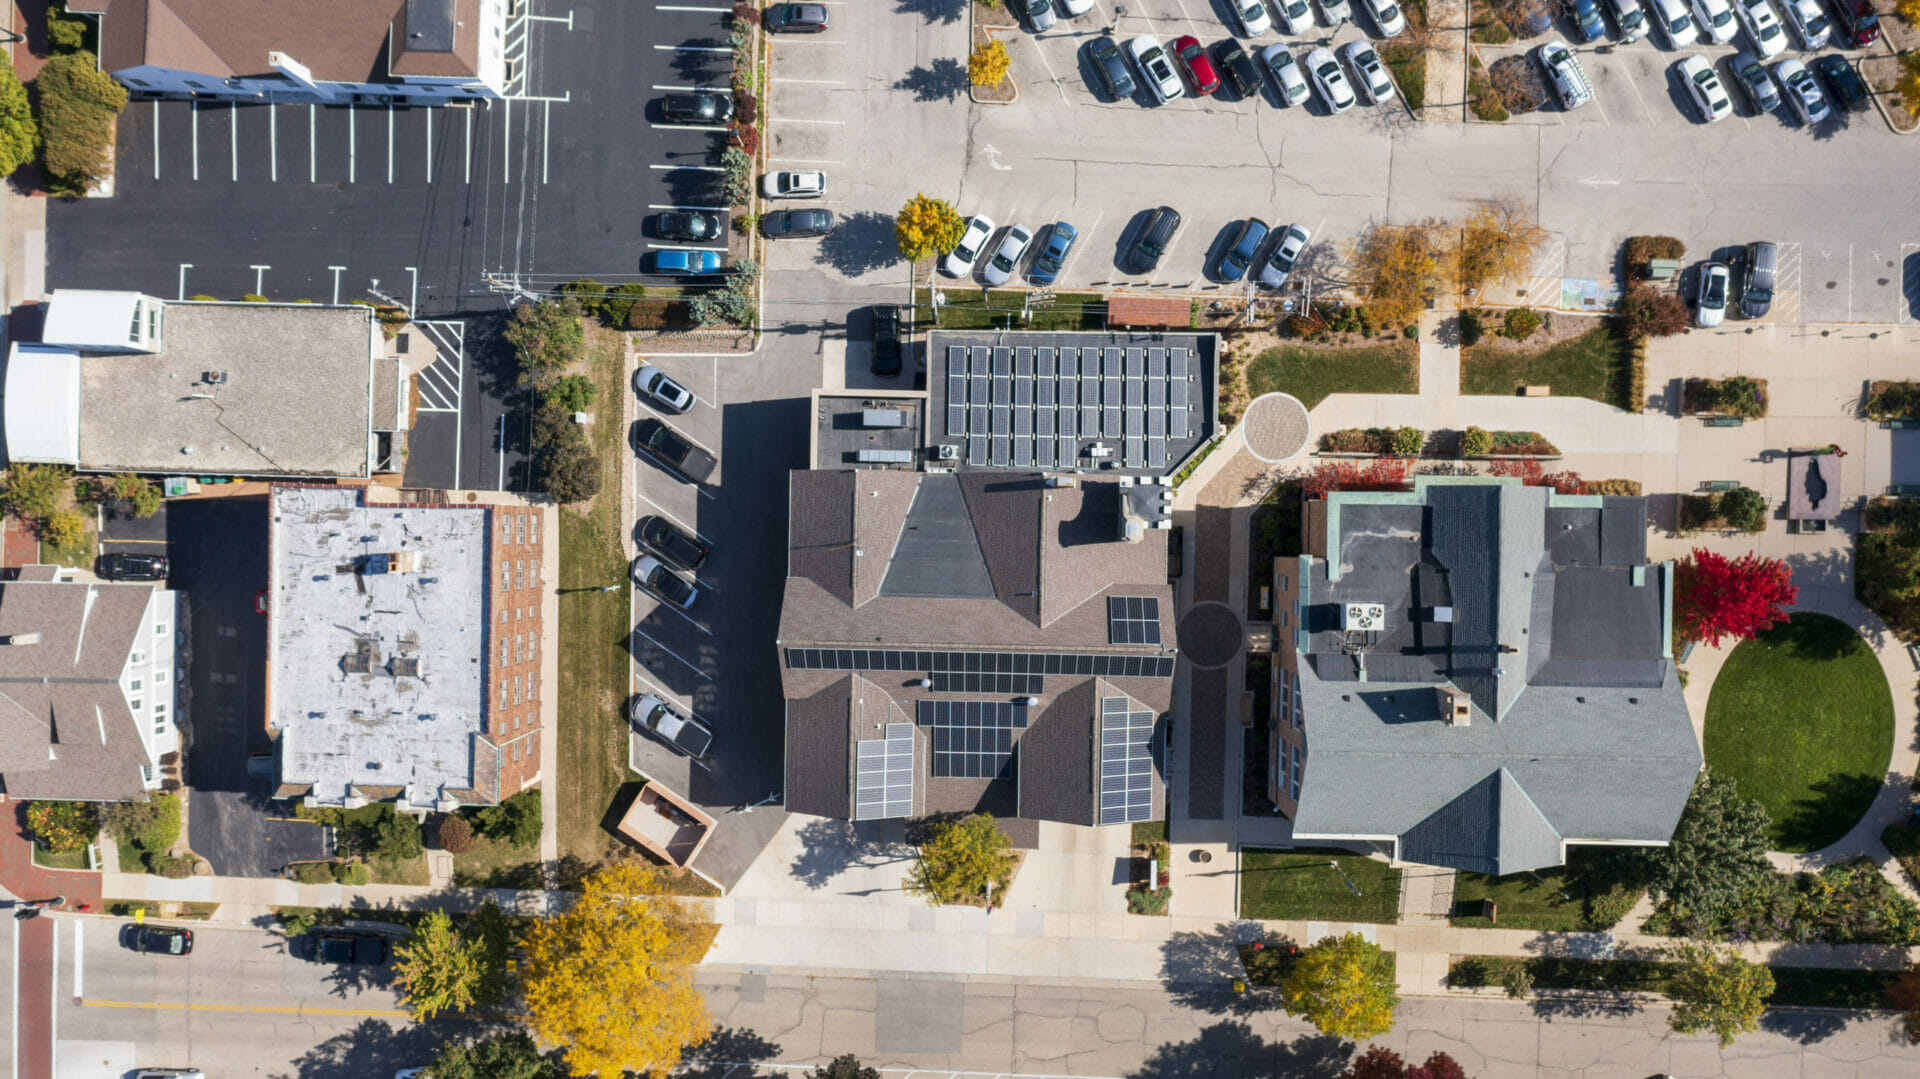
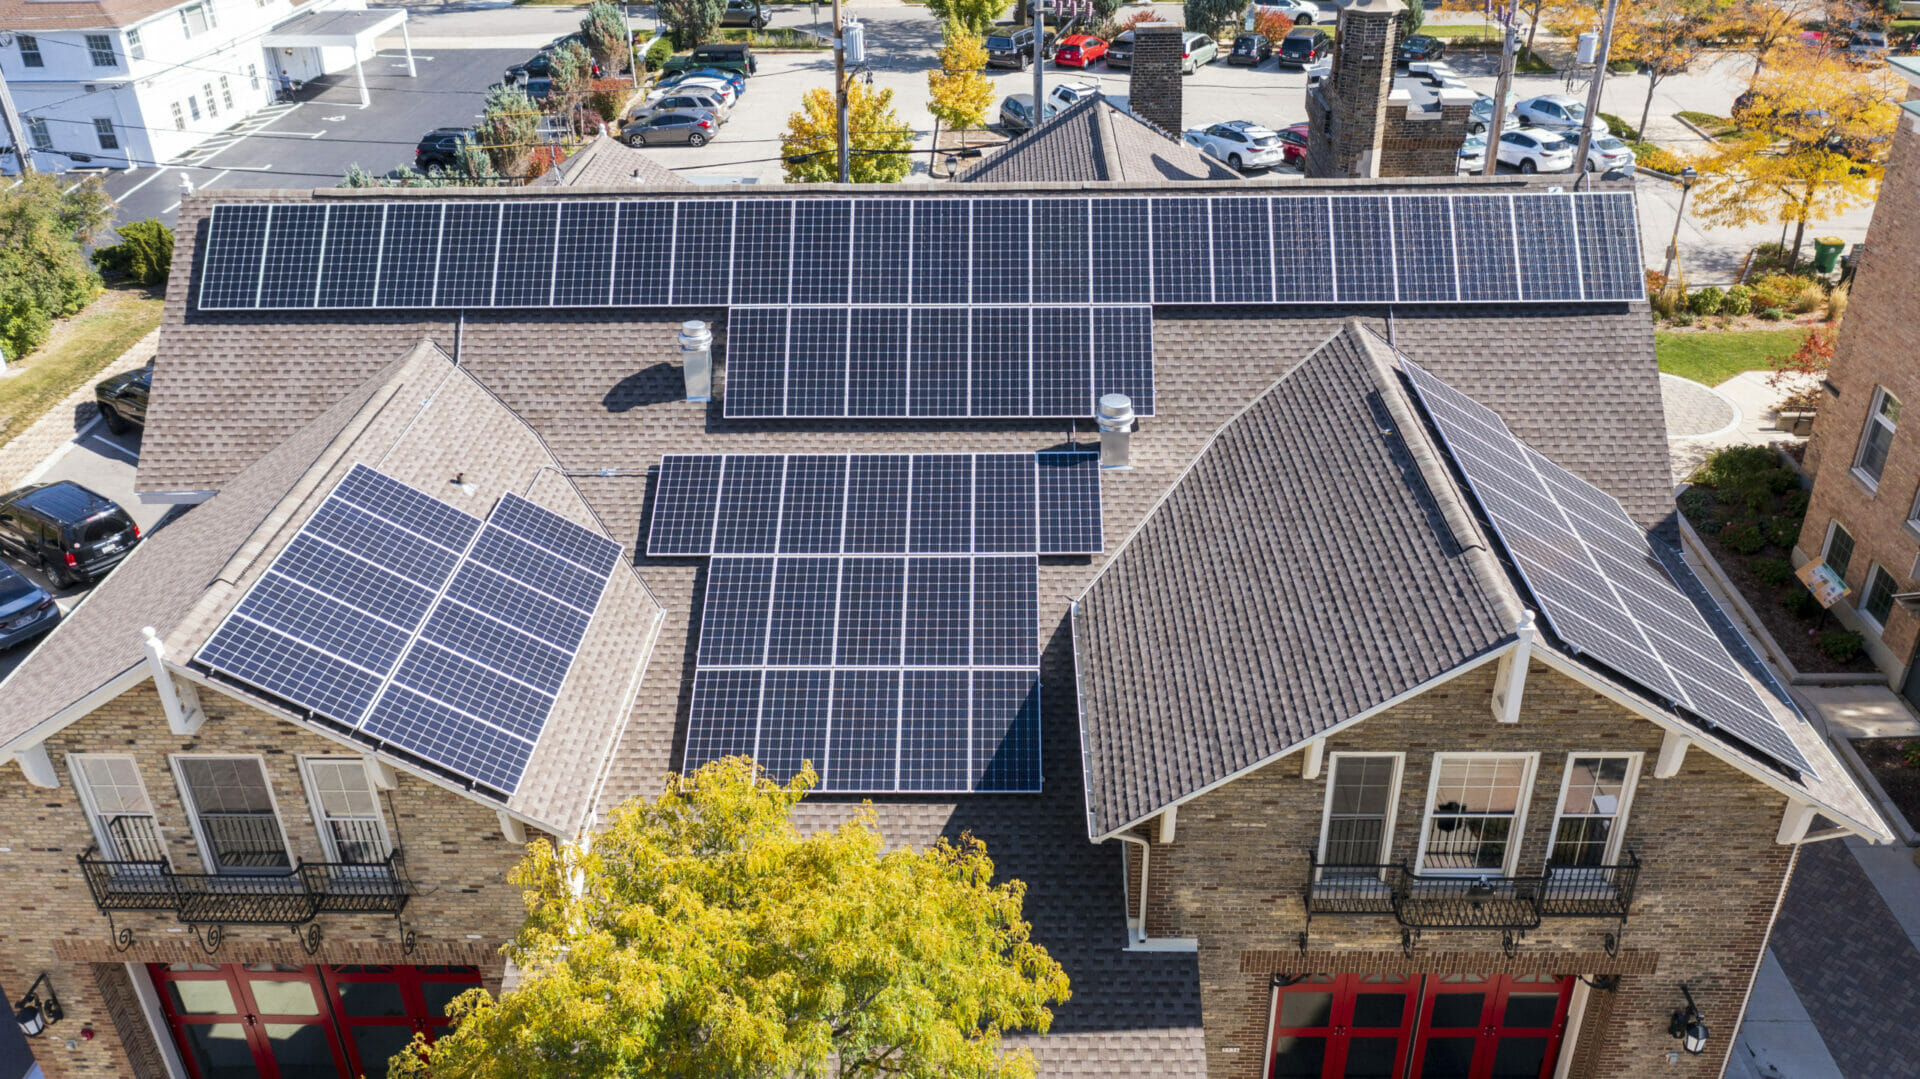
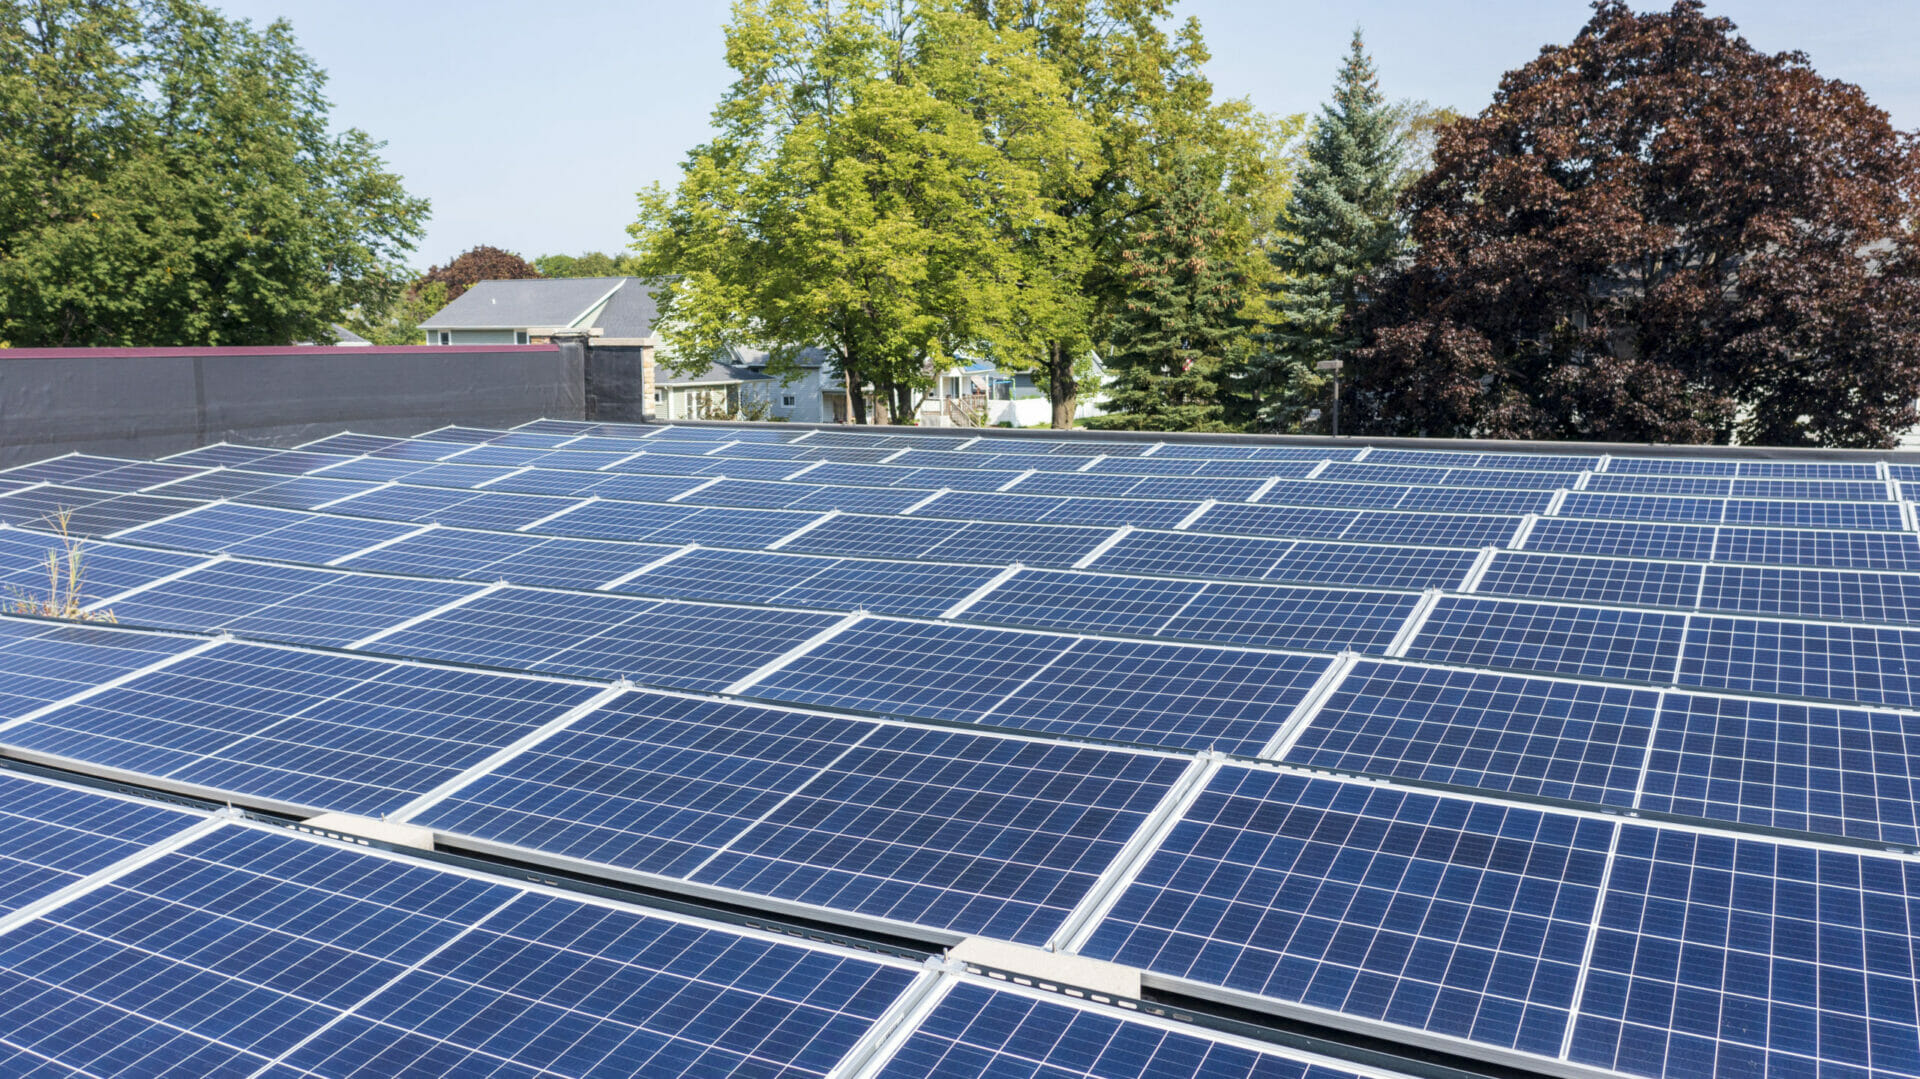
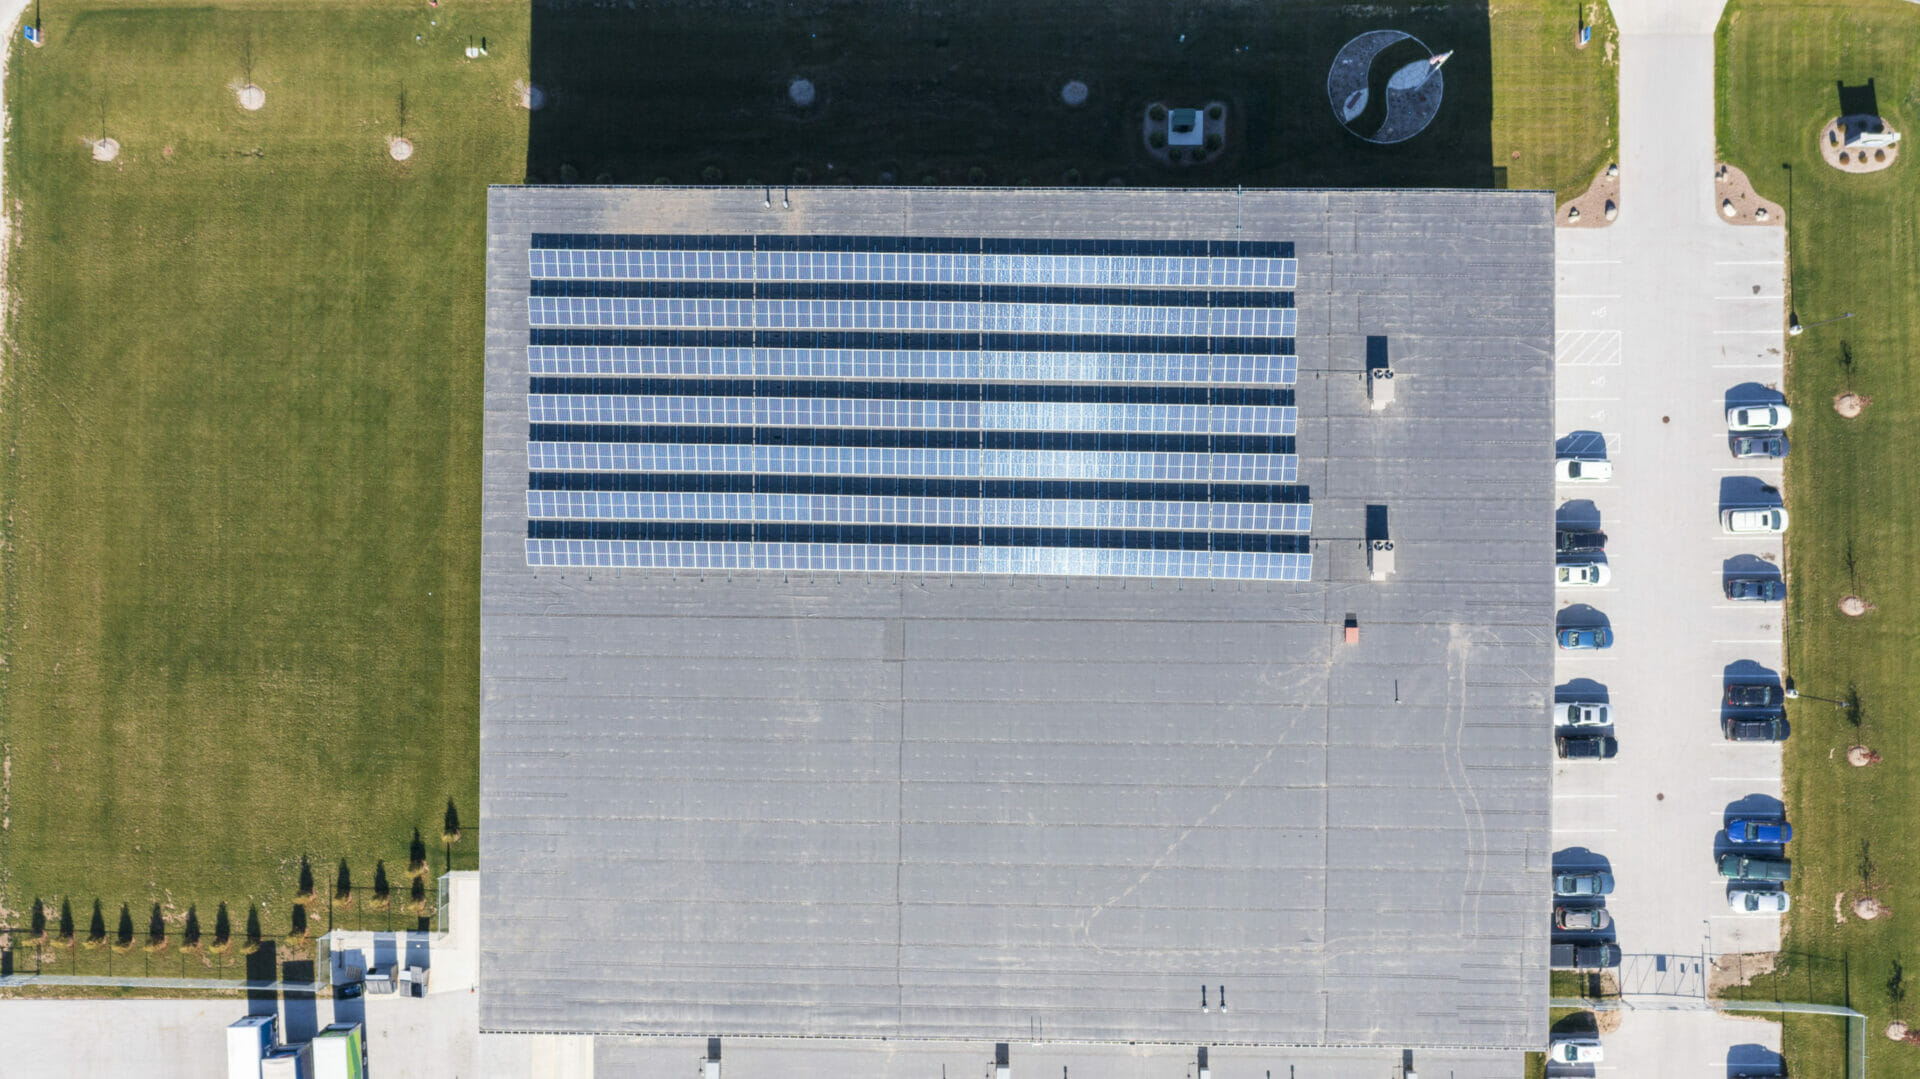
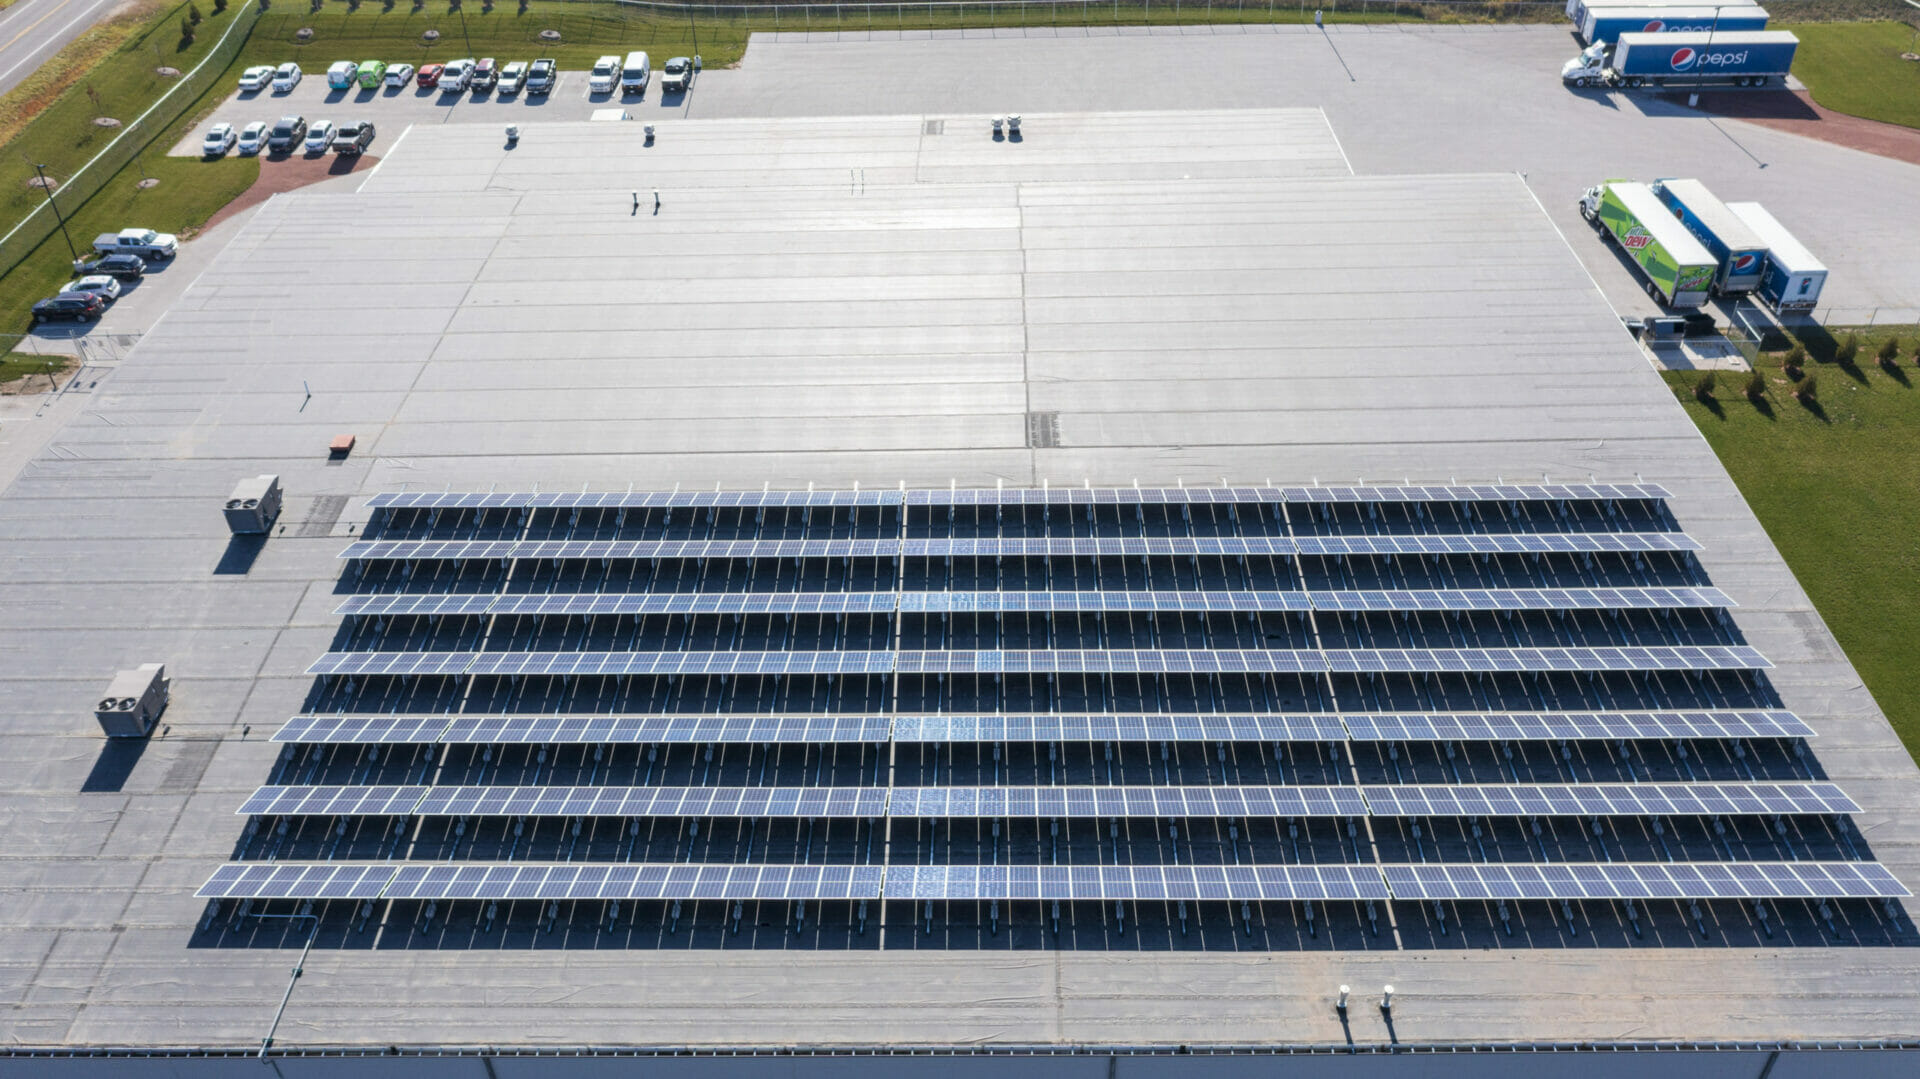
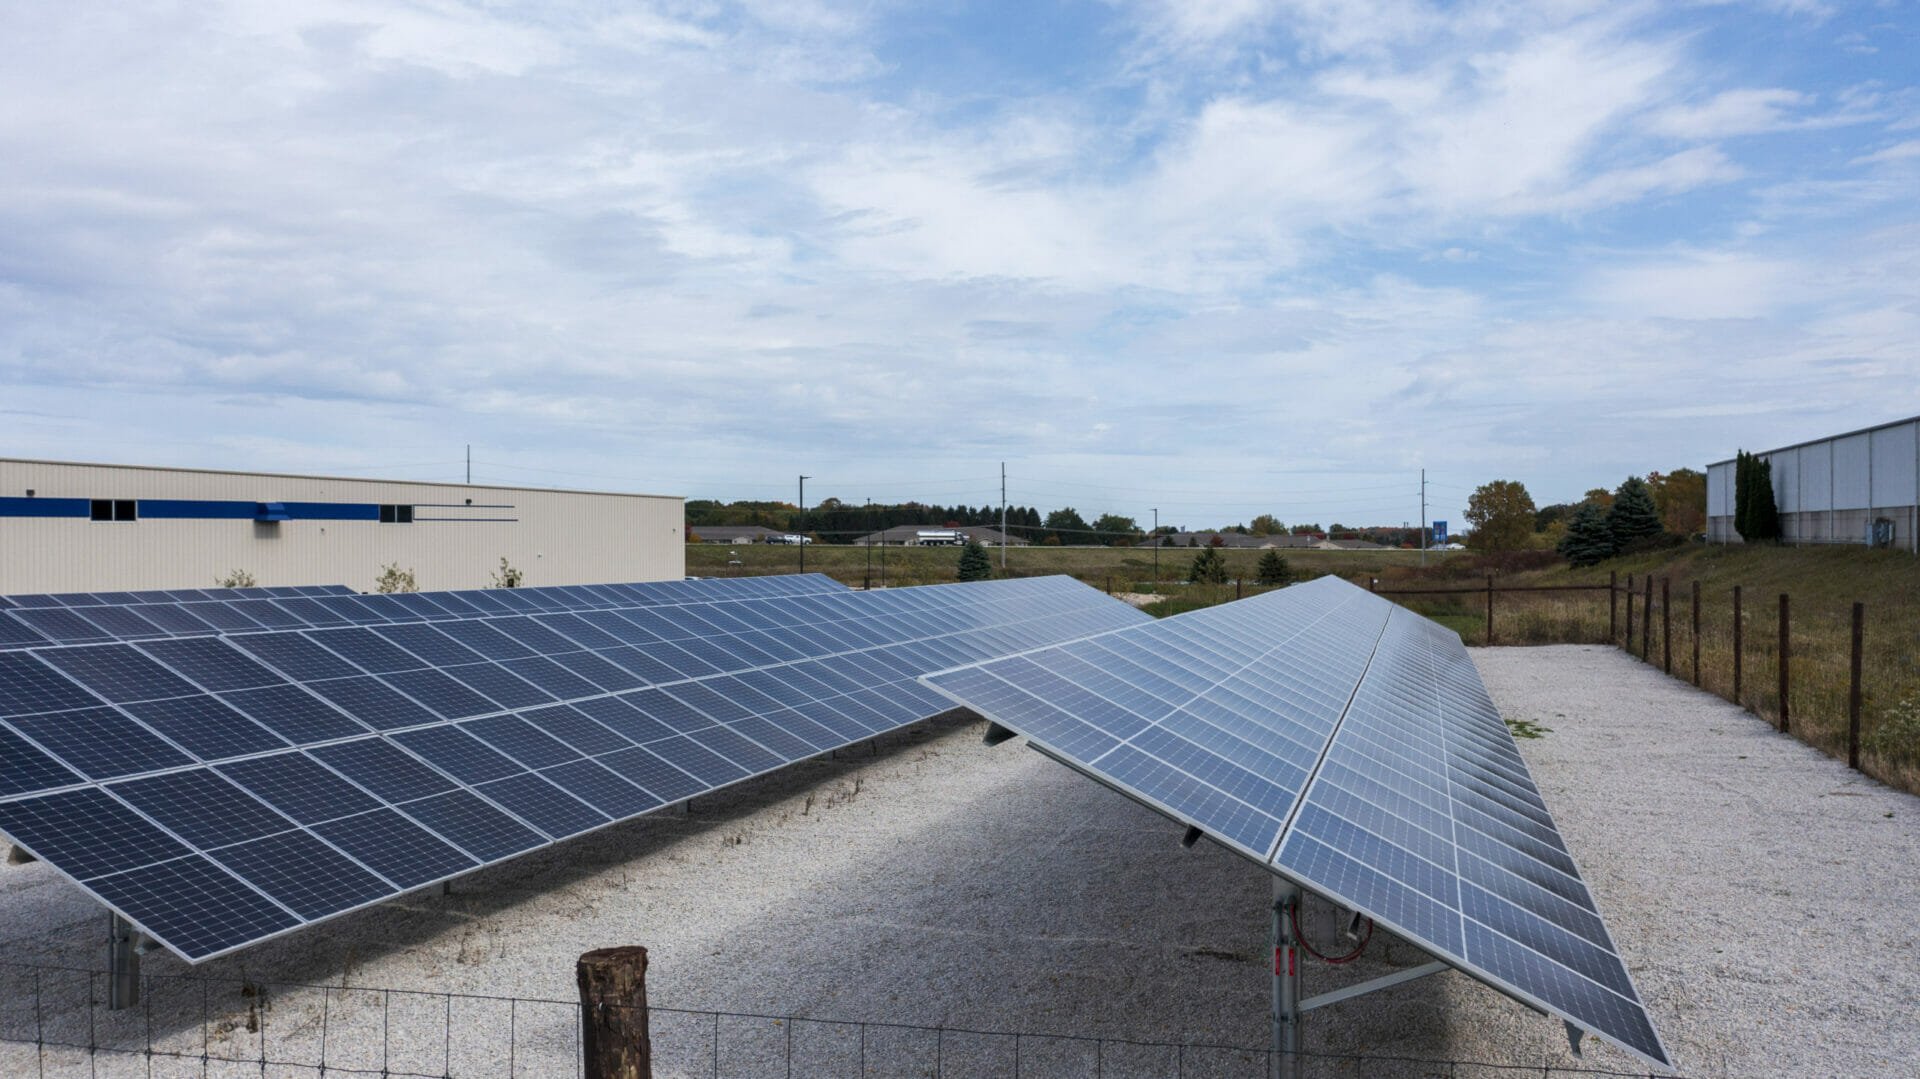
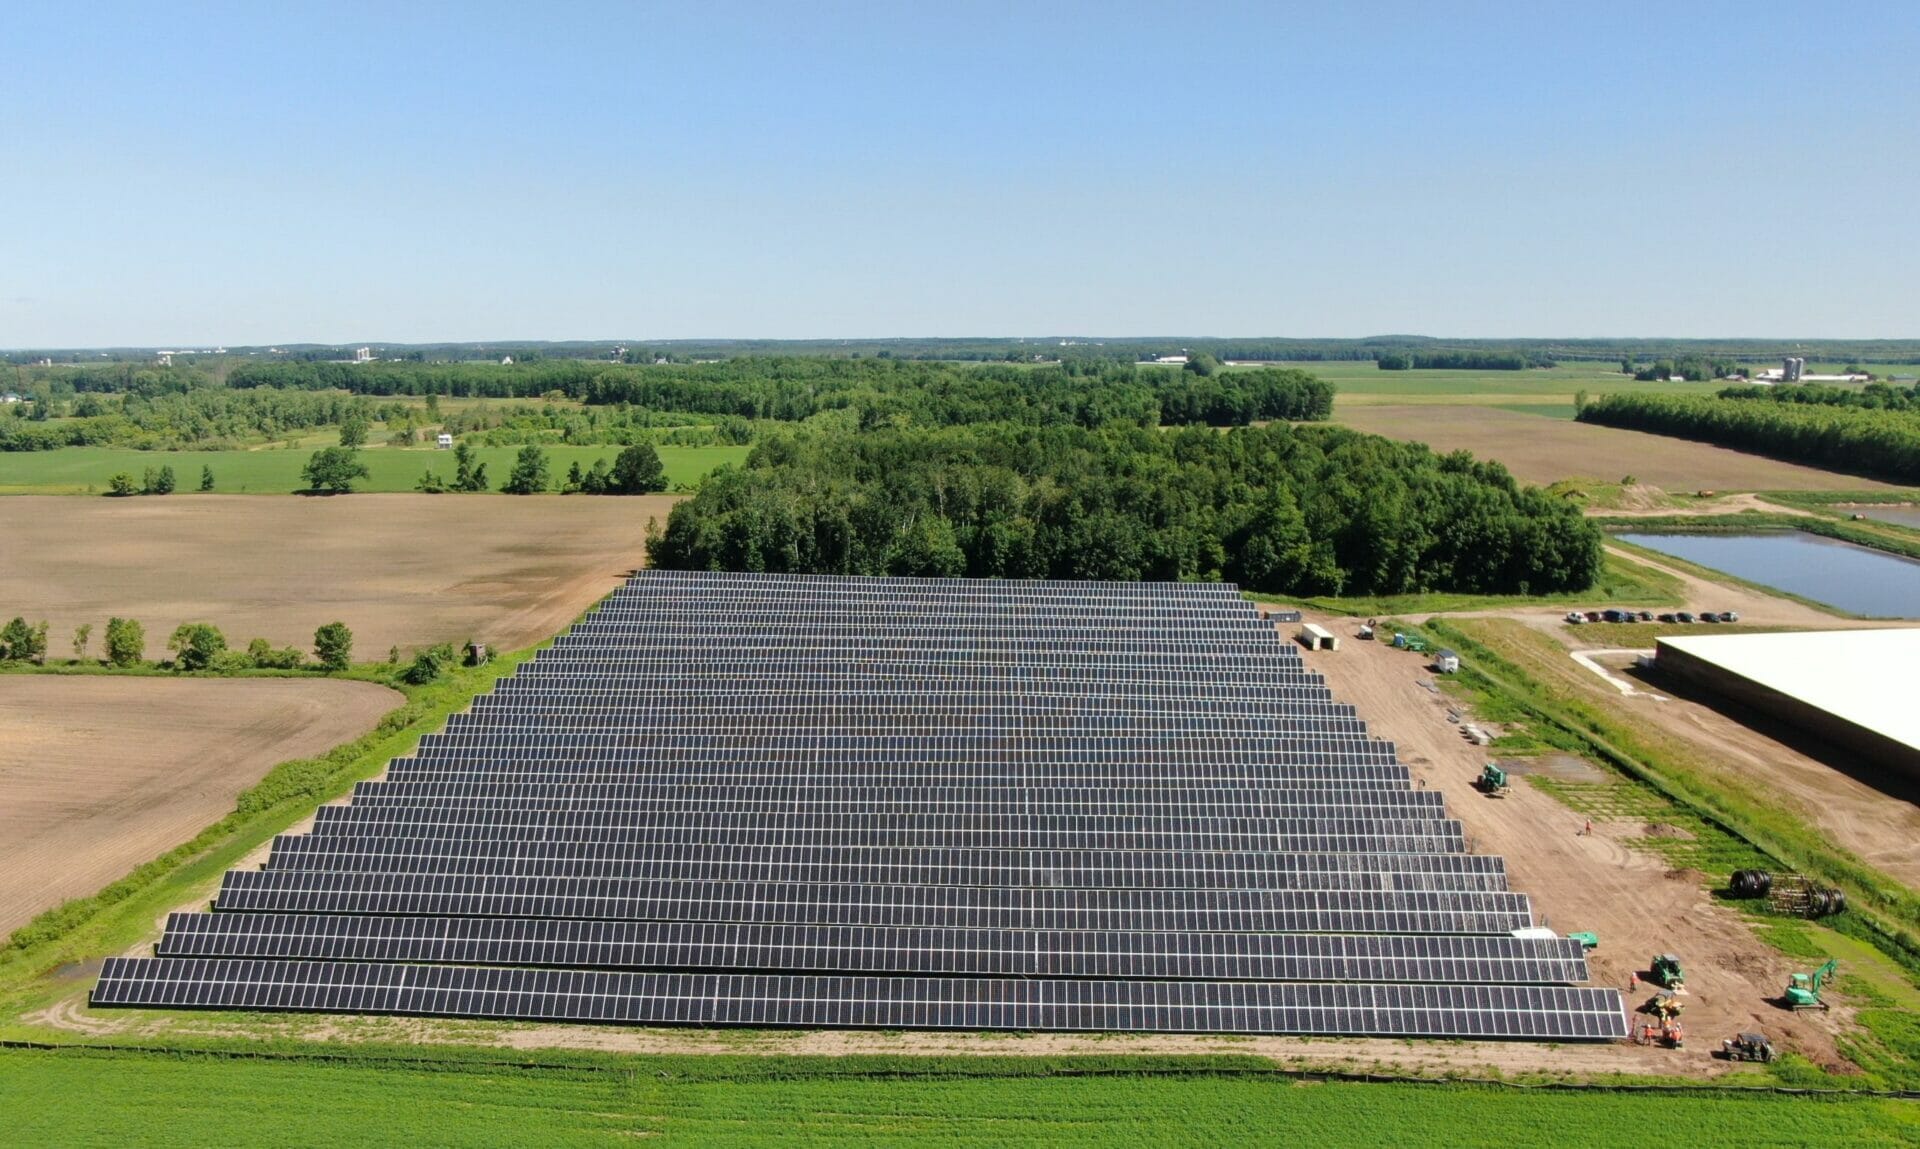
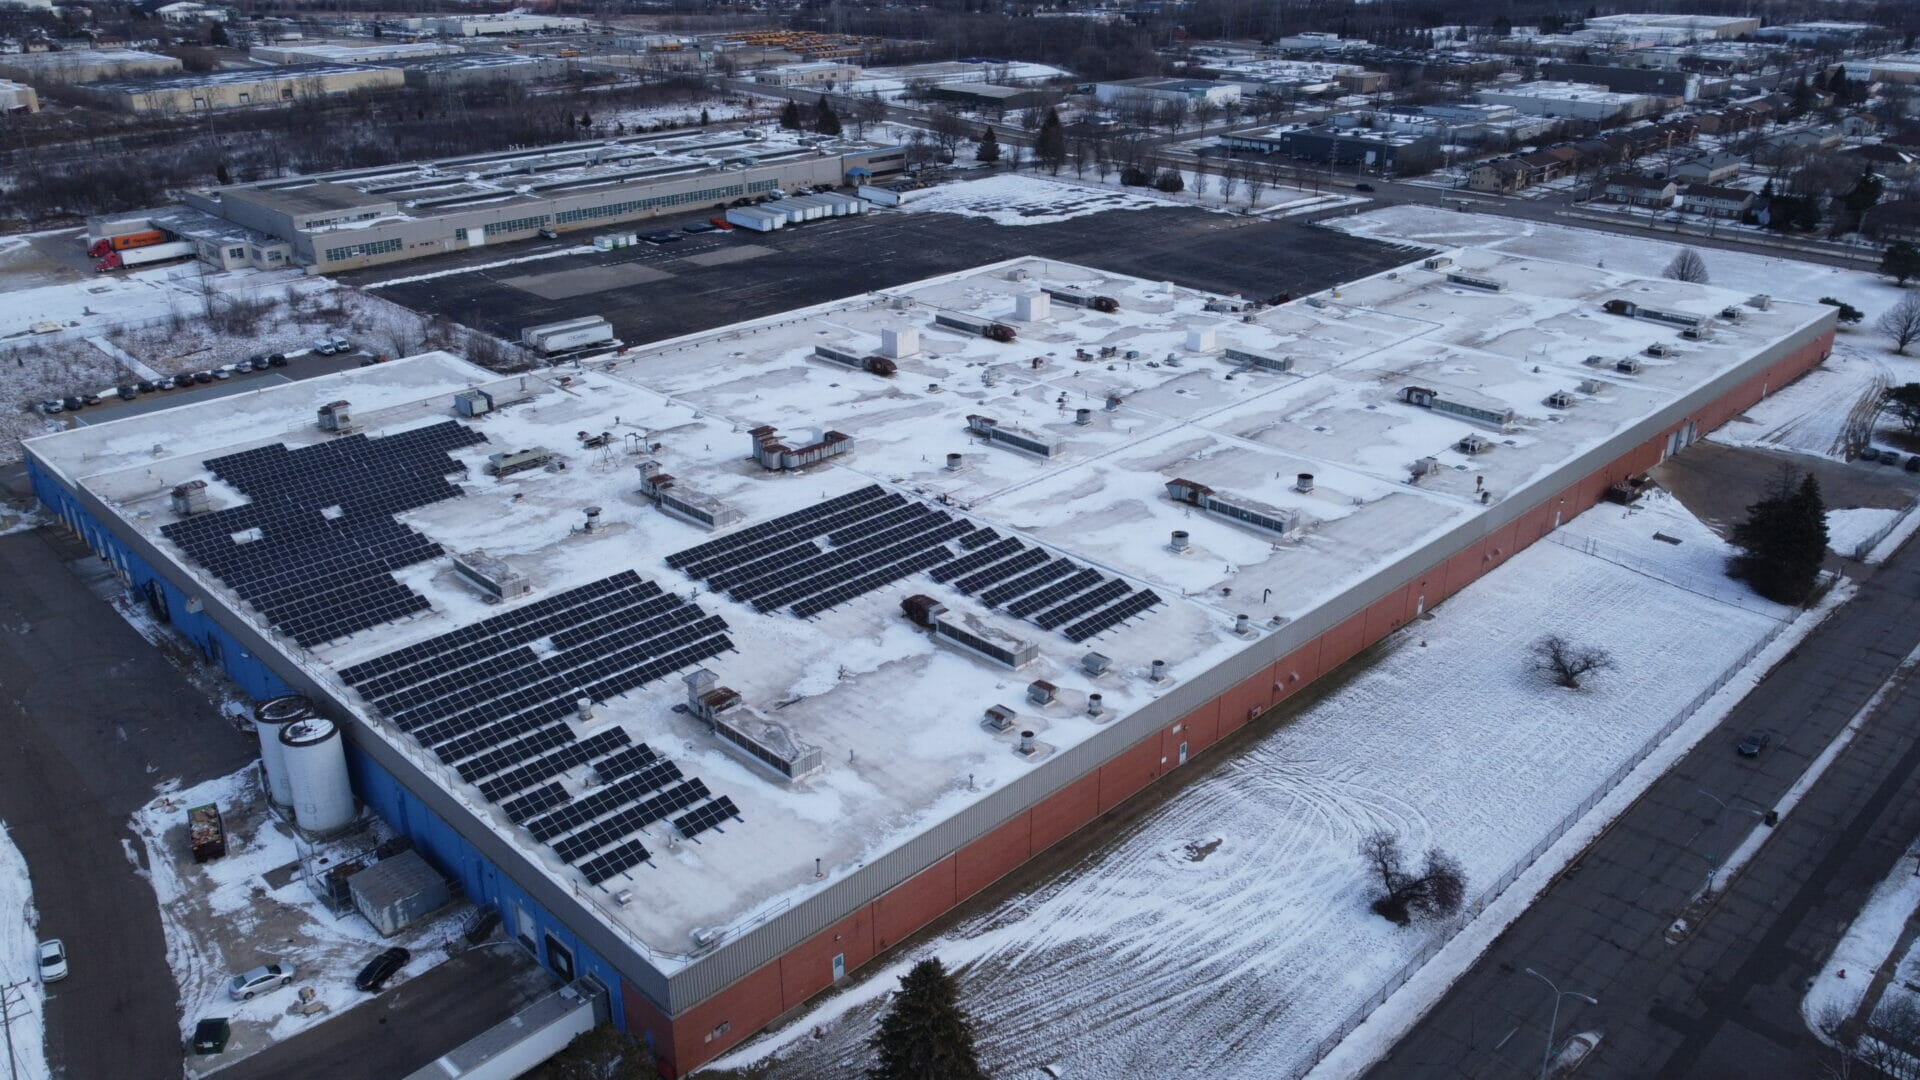
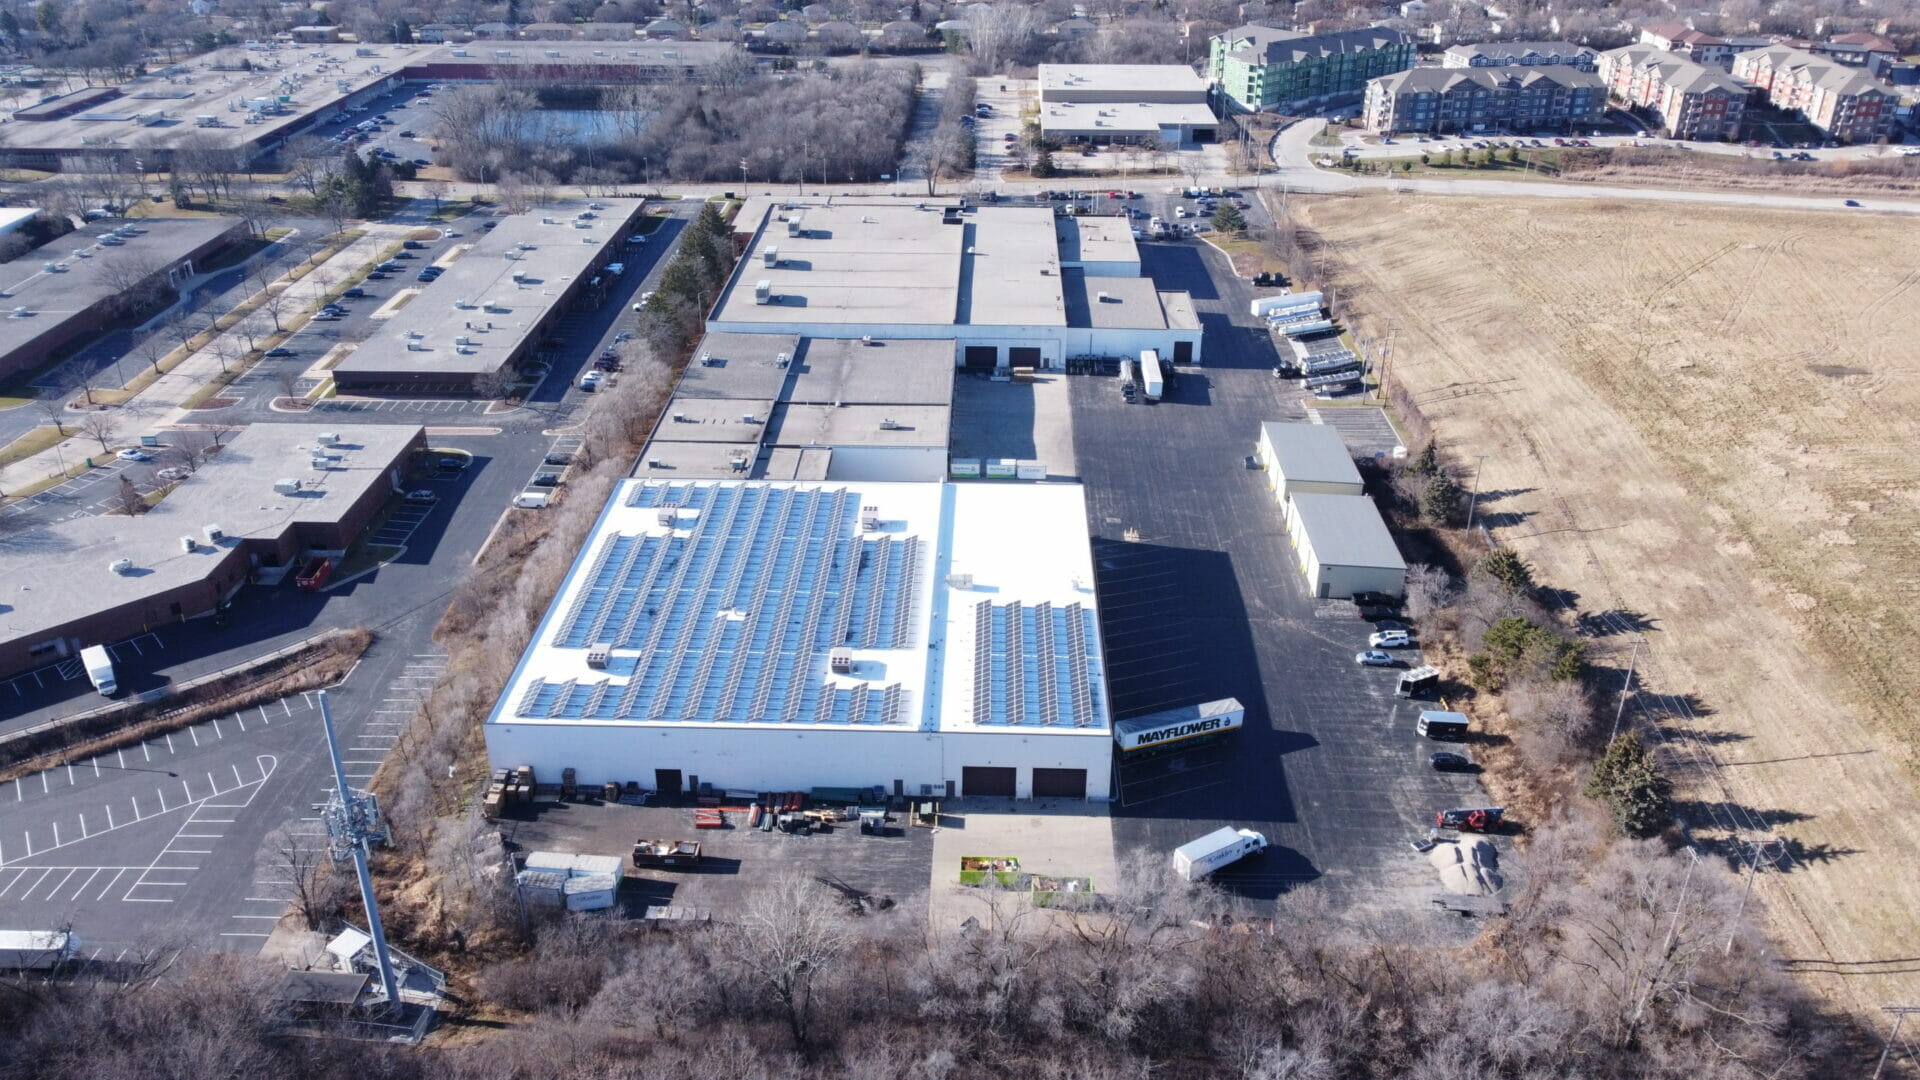
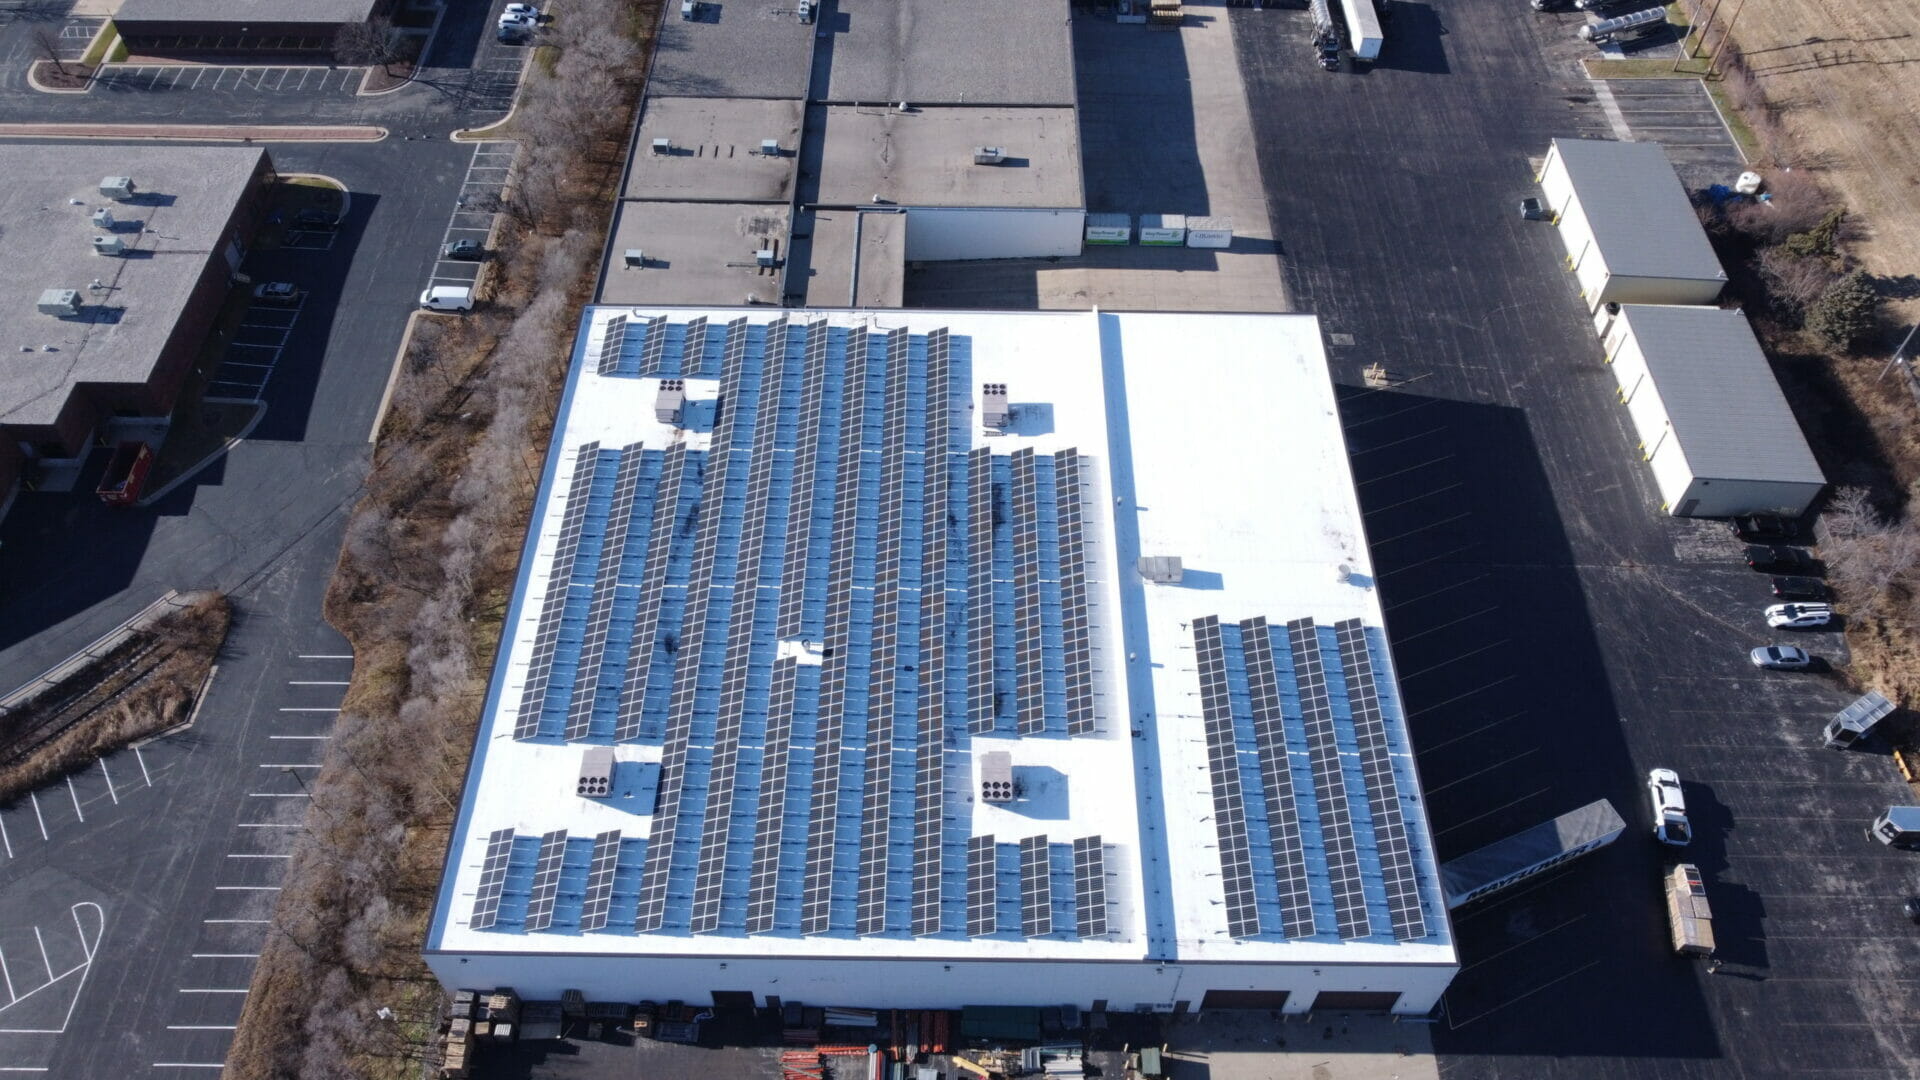
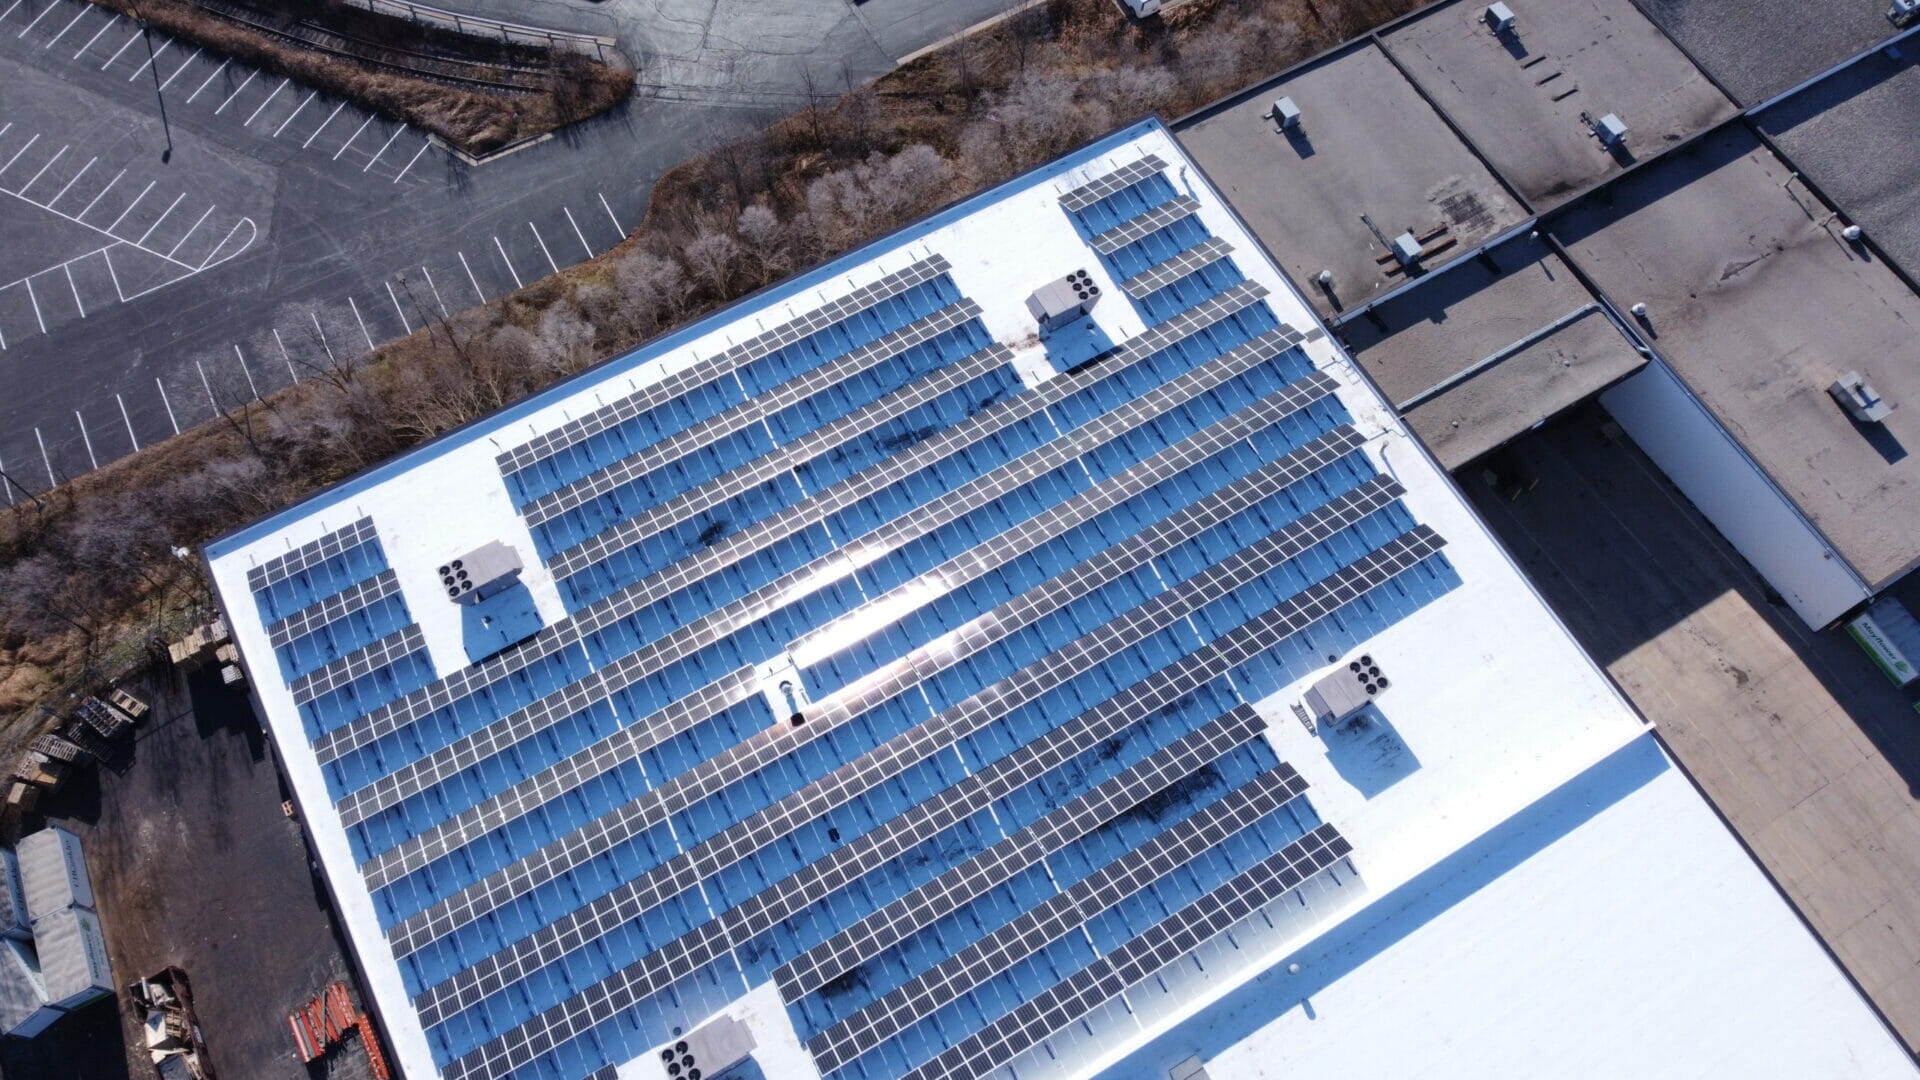
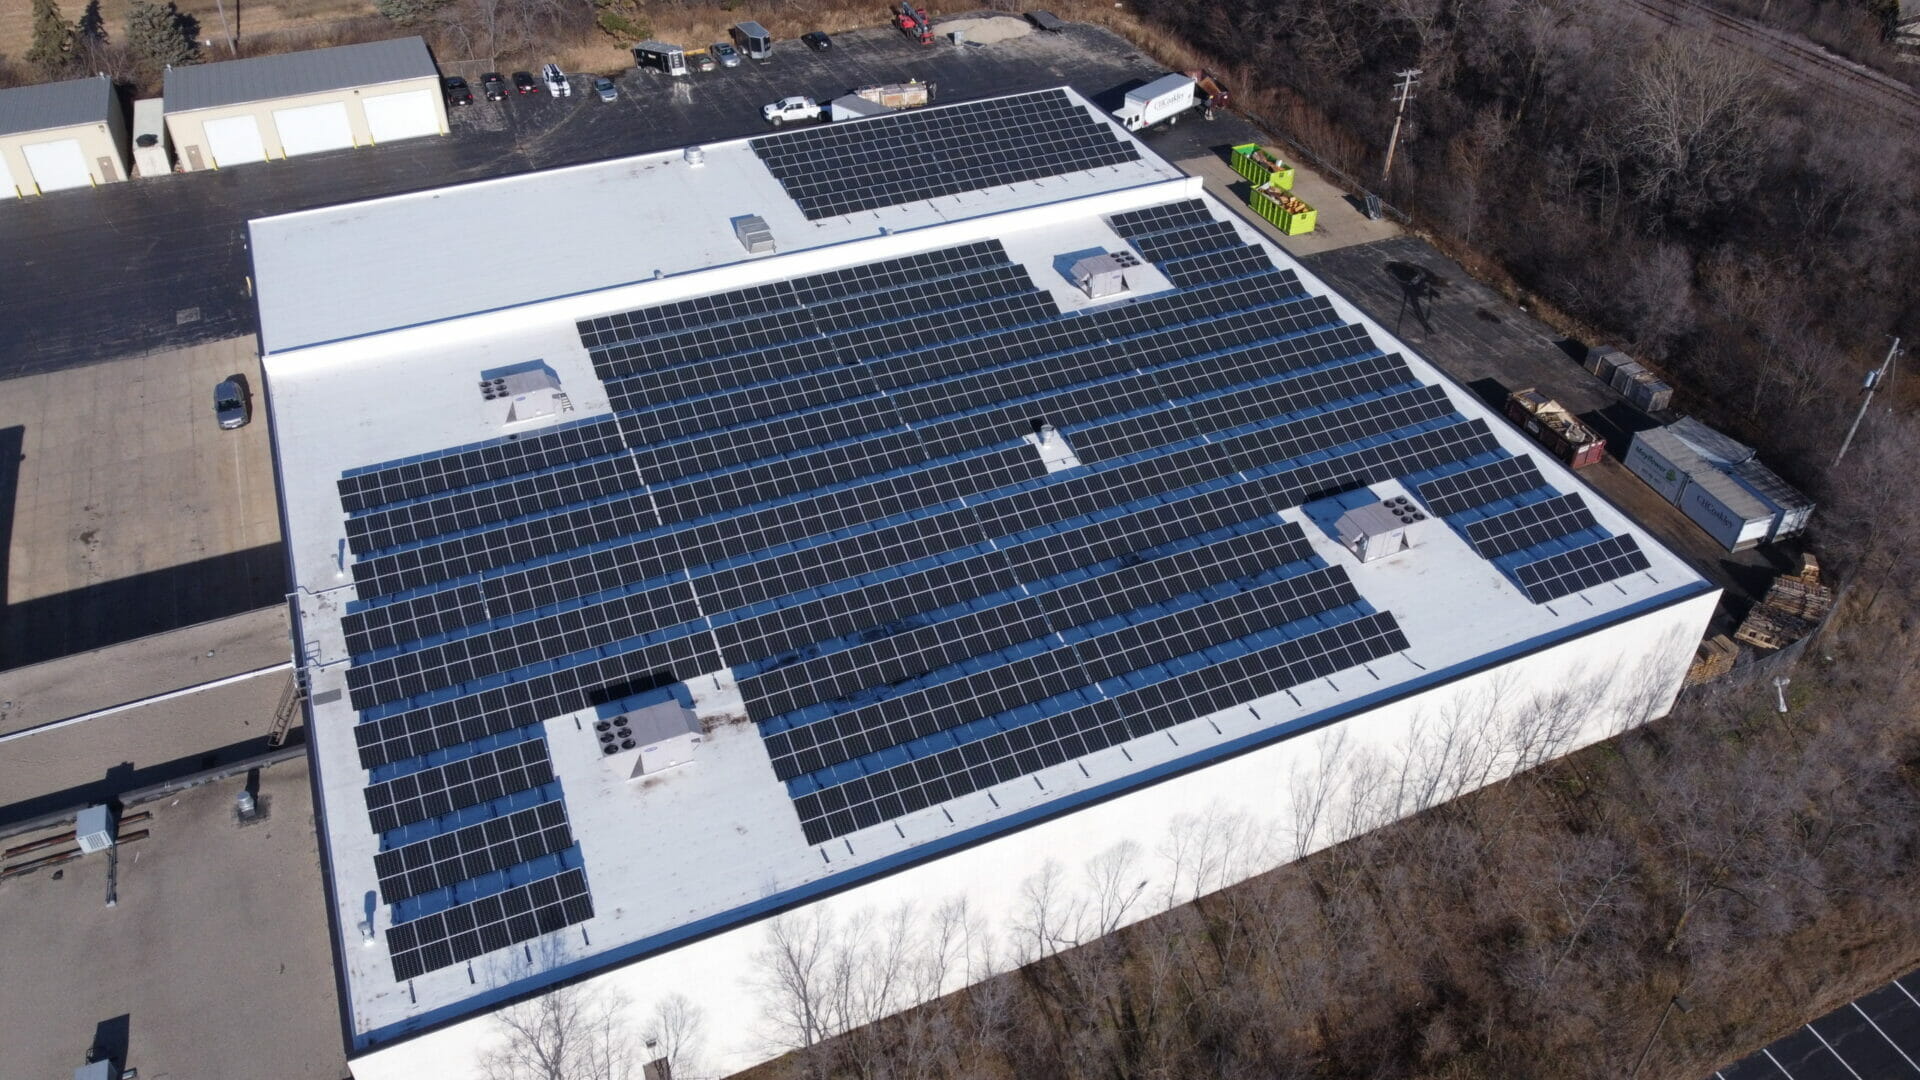
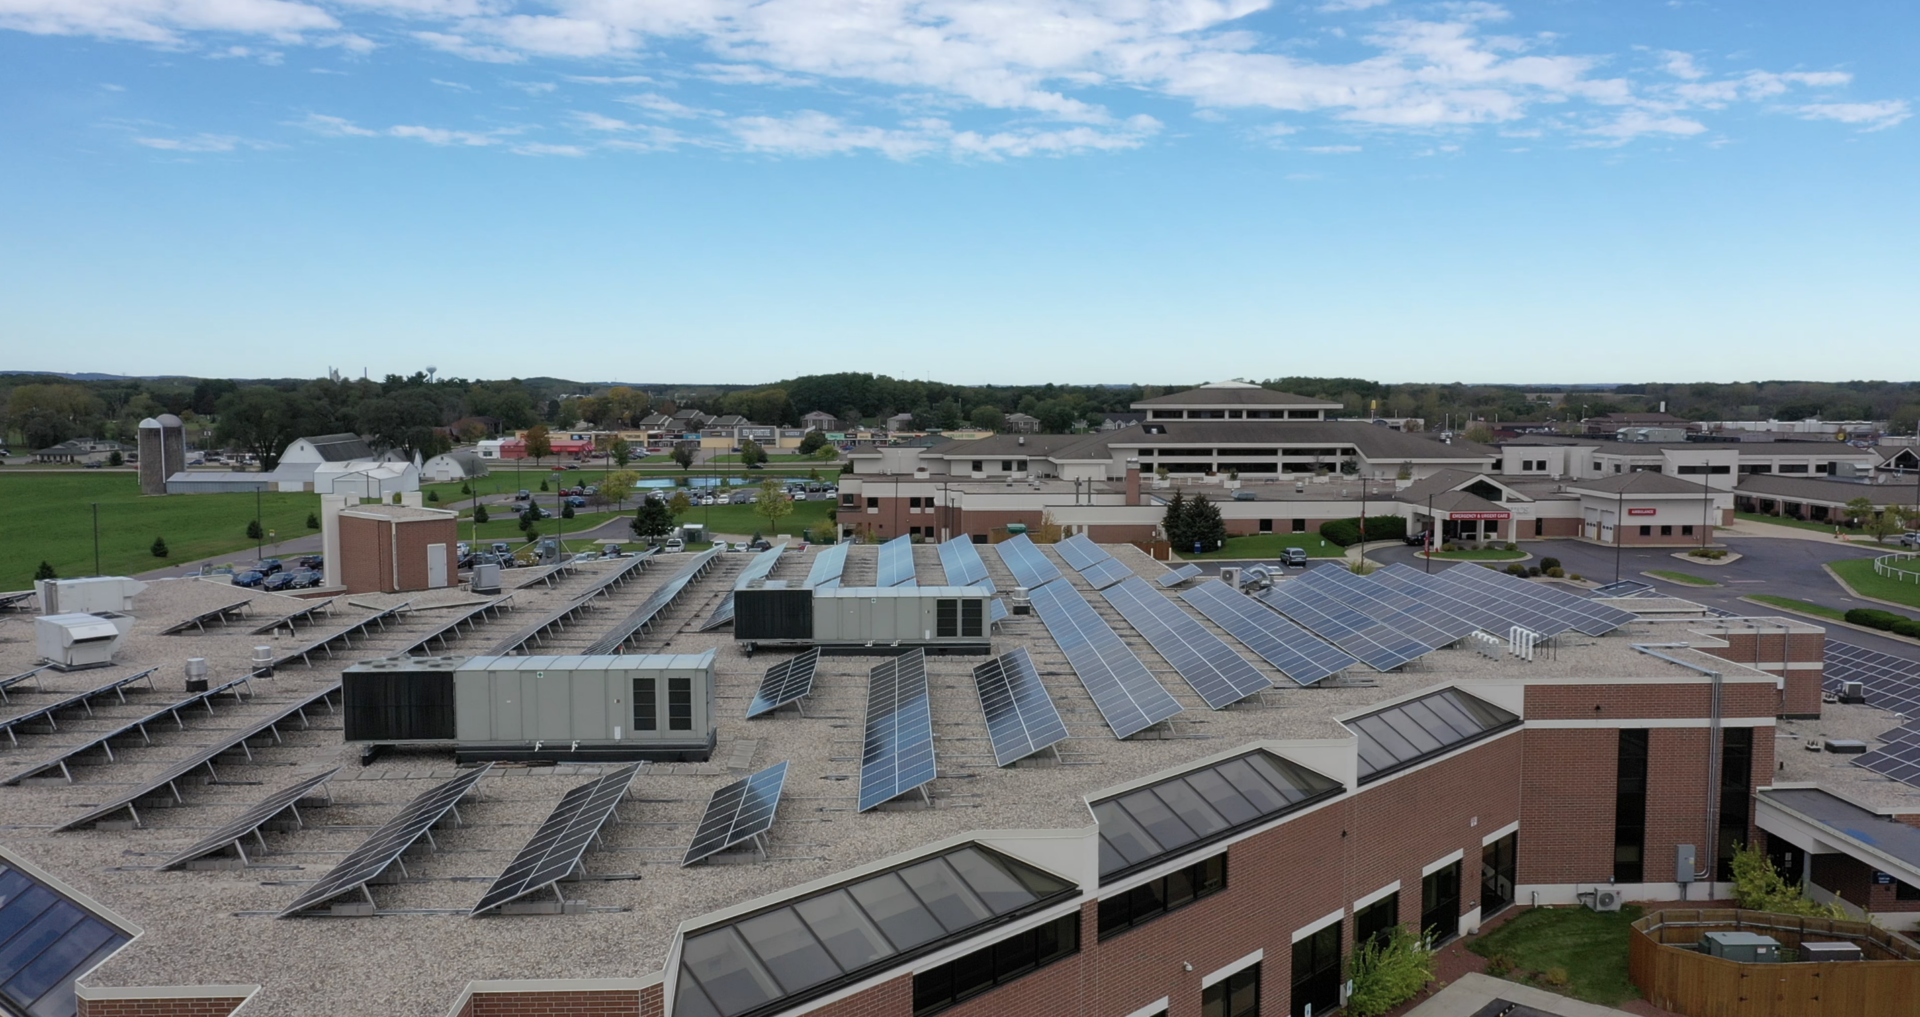
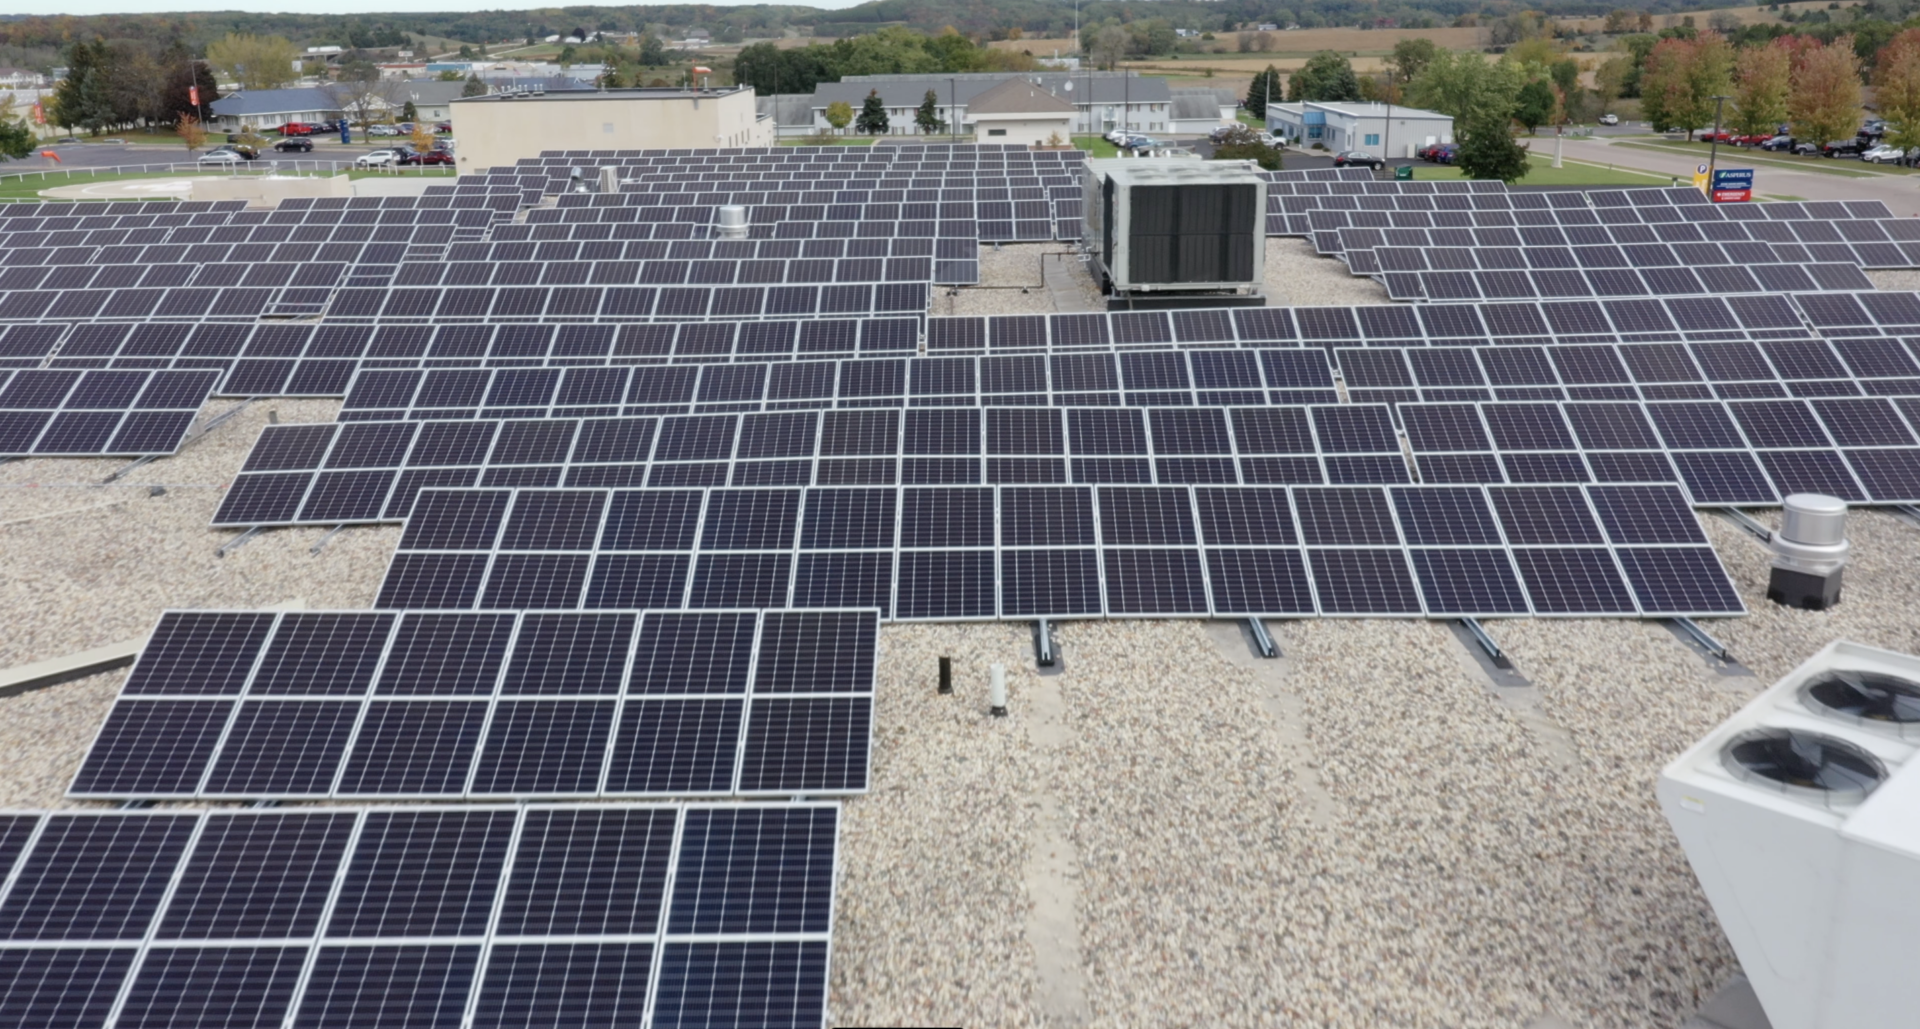
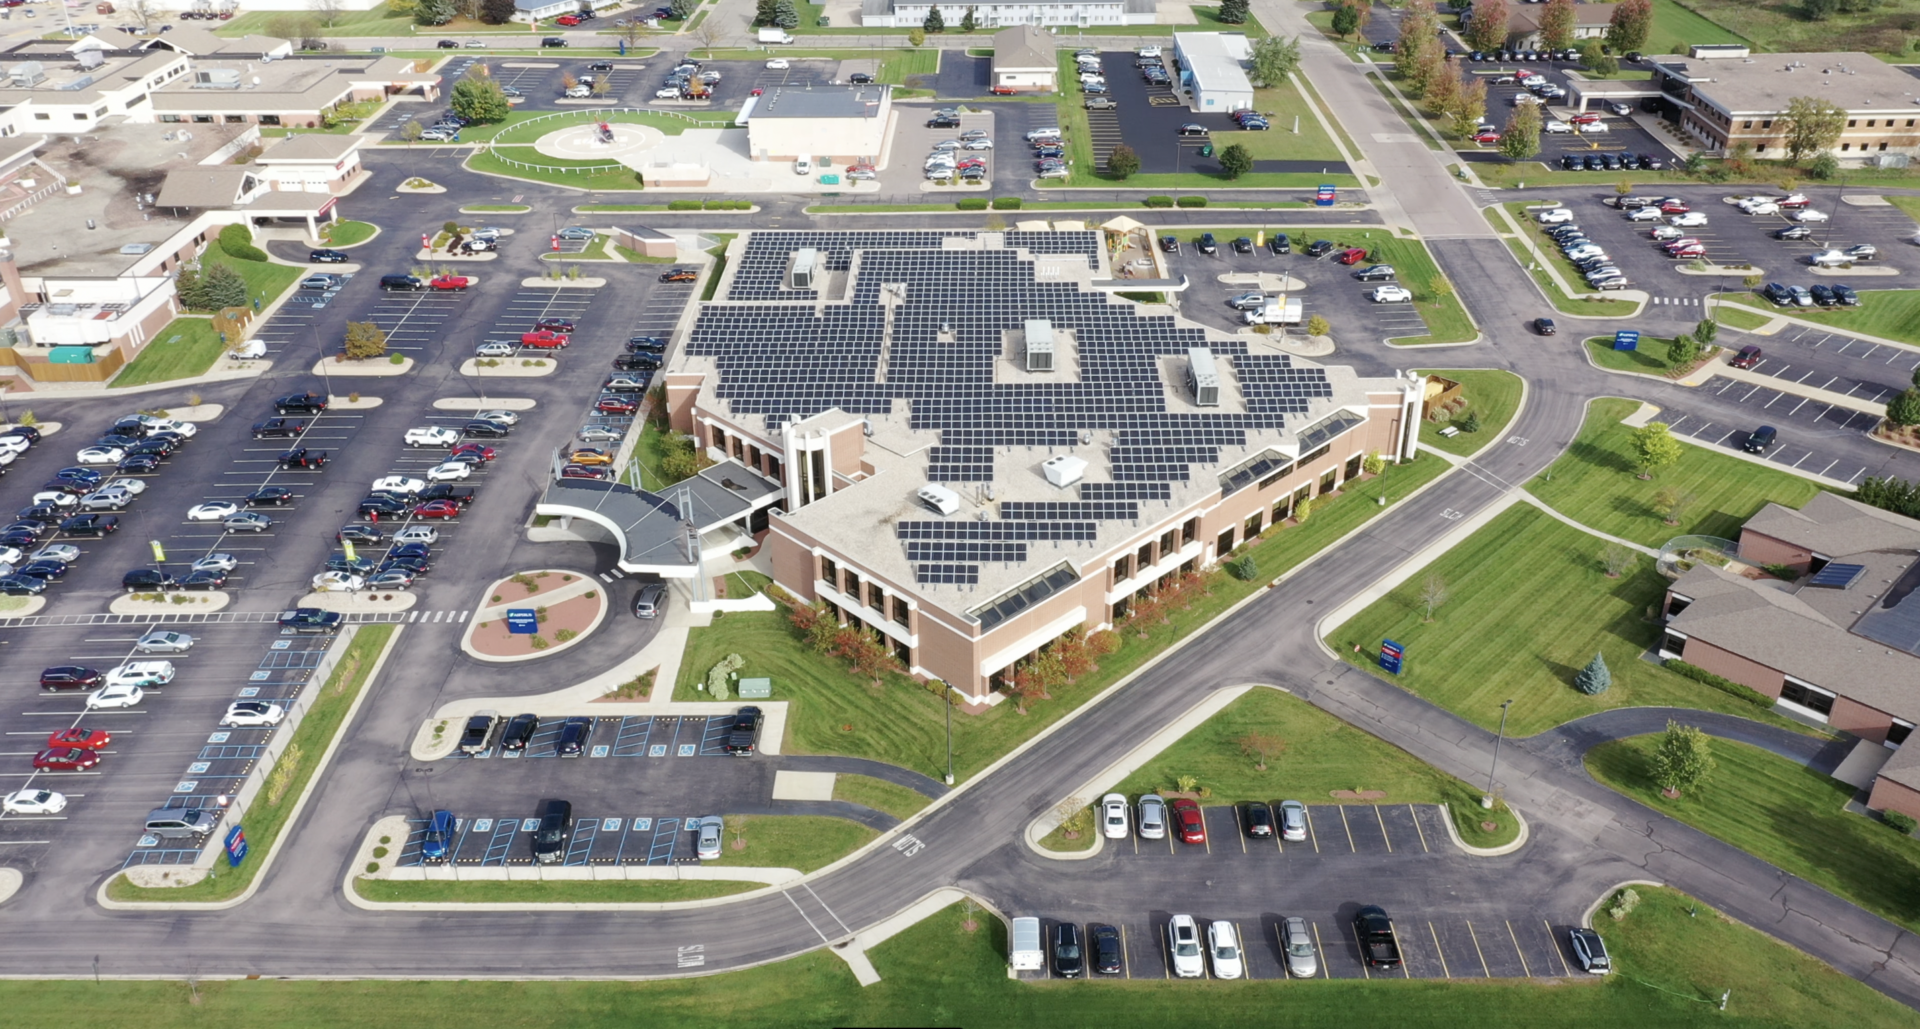
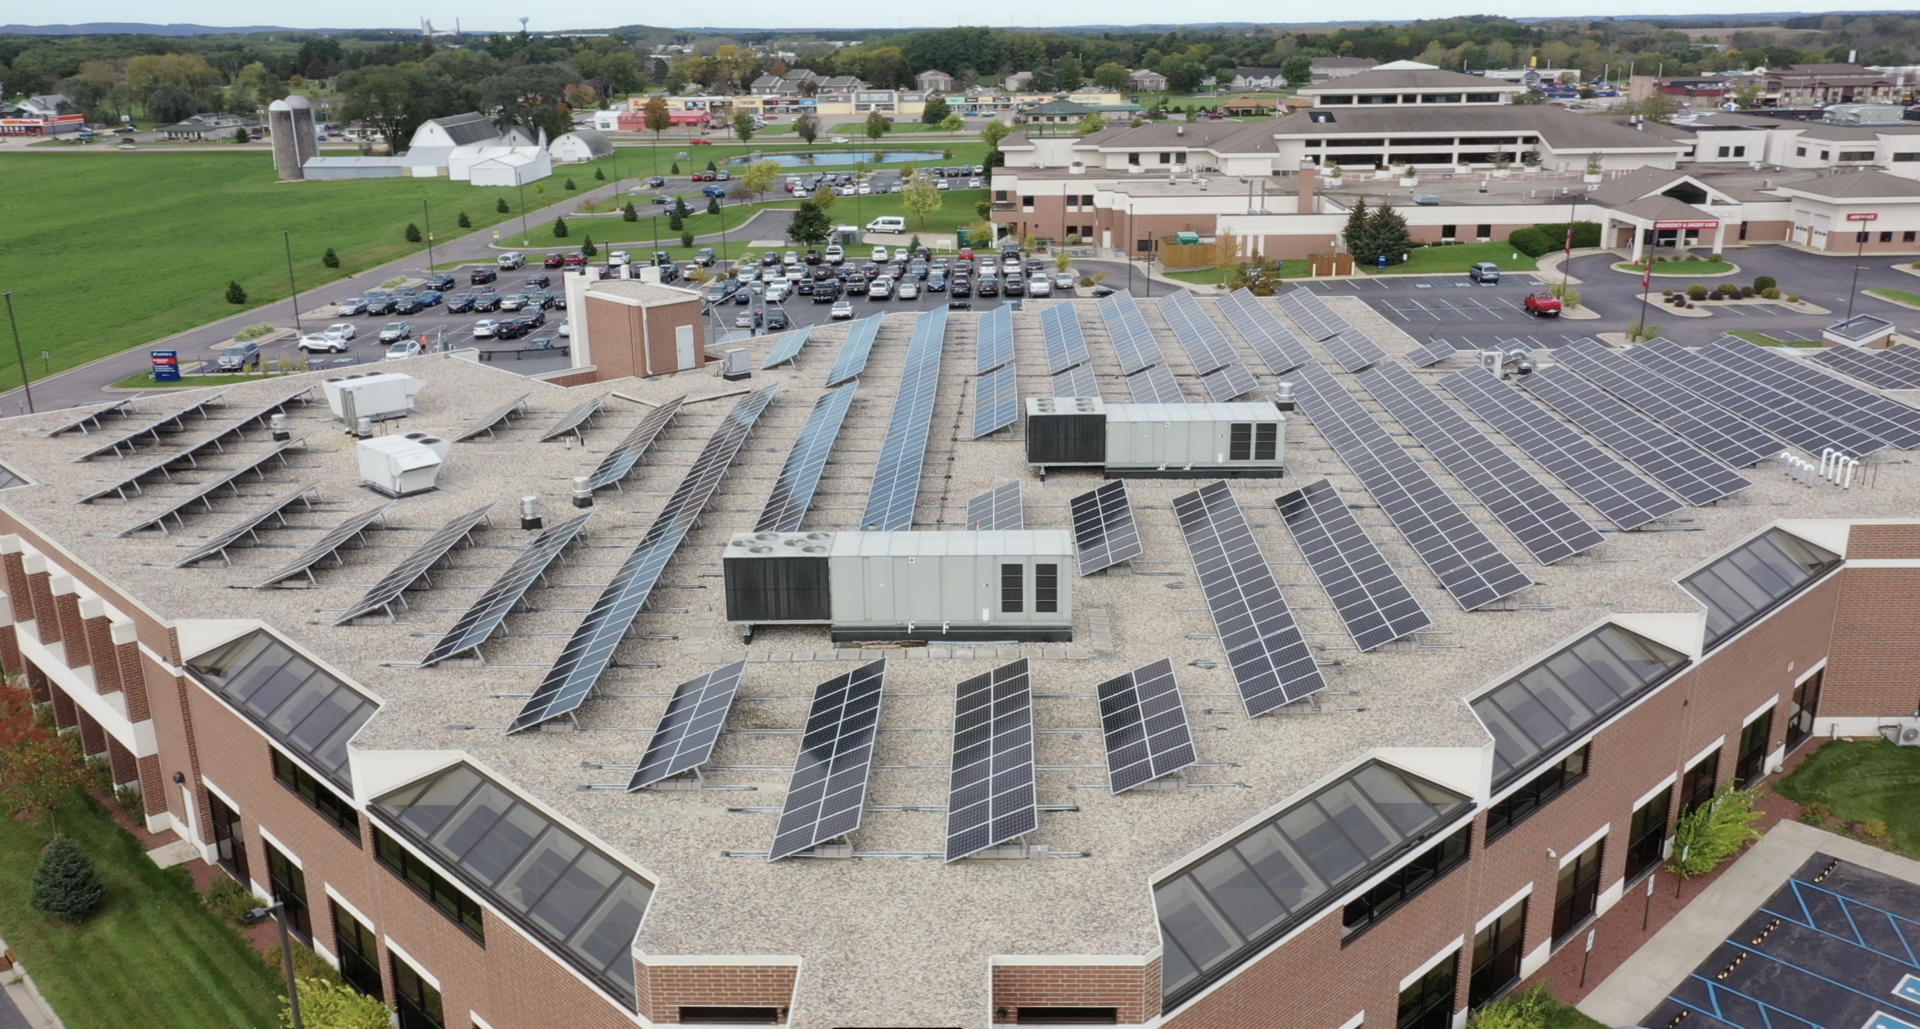
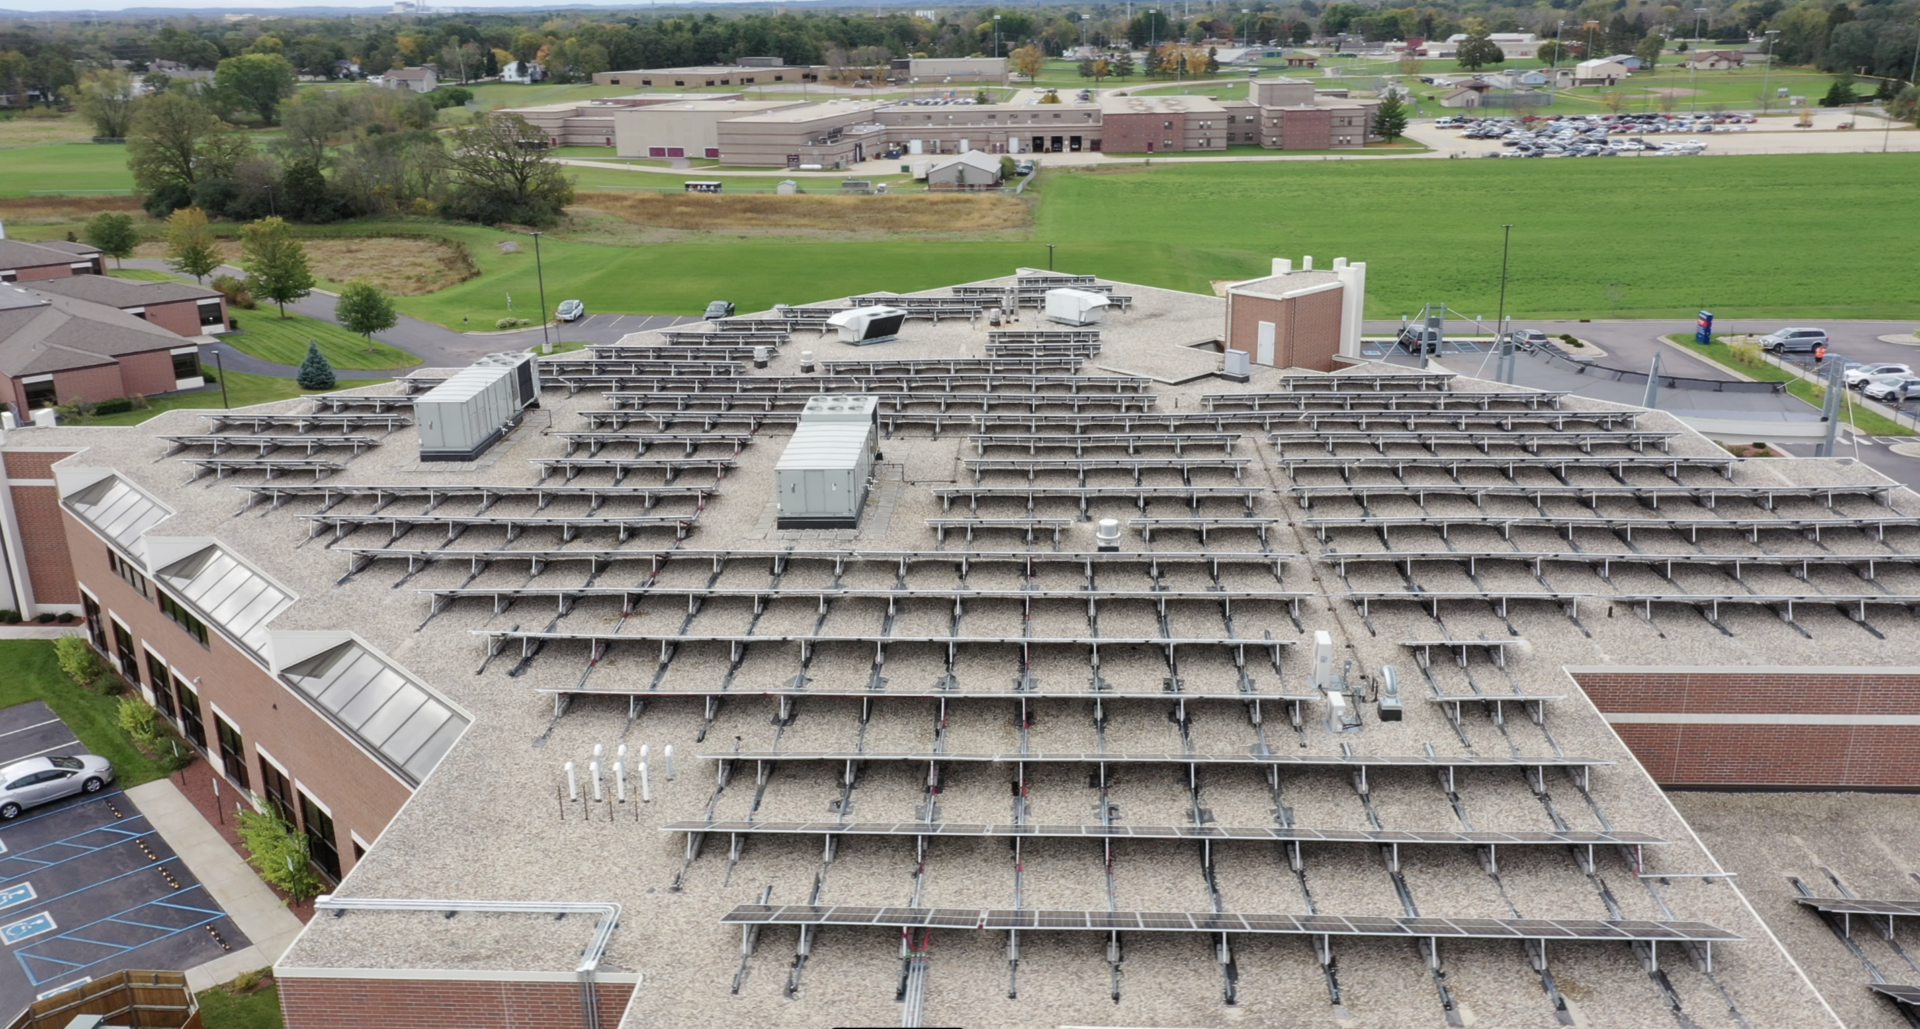
An example of a solar system designed for time-of-use rates is the Pettit National Ice Center. By generating electricity during daytime hours, the Pettit Center offsets higher on-peak energy costs and reduces its reliance on utility power when rates are highest.

An aerial image of Pettit National Ice Center’s solar installation.
Customer Use Rates
Some Wisconsin utilities also offer customer use or excess generation tariffs that compensate businesses for electricity exported back to the grid.
For example, We Energies has a CGS-CU rate, which applies to customers with generating systems up to 5MW. With this rate, the exact credit you receive for excess generation depends on your specific voltage level and the season.
While customer use rates vary among utilities, these programs can improve overall project economics by ensuring excess production still provides financial value. Arch’s team of energy experts will evaluate your utility tariff and energy usage profile to determine whether a customer use rate provides additional value for your project.
Why Rate Analysis Matters
Understanding your utility rate structure is the first step toward maximizing the value of a commercial solar investment. Whether your business is billed on energy consumption, demand charges, time-of-use rates, or customer use tariffs, Arch Solar can help identify the most effective strategy for long-term savings. Contact our team to schedule a complimentary utility bill analysis and explore how solar can work for your facility.