2025 Administration Change Guidance – Commercial & Industrial Solar

2025 Administration Change Guidance – Commercial & Industrial Solar

The 2024 Presidential Election and its outcome have pushed the discussion of energy back toward the top of mind for many Americans. During the campaign, the incoming Trump administration made our energy future a key issue, and many business leaders have questions about how solar for business will fit into that future.

As the Trump administration takes office and begins governing, we at Arch have several reasons to feel confident that 2025 will be one of the best years for commercial and industrial solar installations. Here are our key reasons.

1.   The economic momentum behind renewables has broad bipartisan support and clear economic success.

2.   Rising energy demand is happening across the United States and in Wisconsin.

3.   There is no better time to future-proof your business costs than when heading into economic volatility.

The economic momentum behind renewables has broad bipartisan support and clear economic success.

A hallmark of Trump’s presidency has been using public speeches to build a strong negotiating position. Many have made claims about the future of clean energy, but statements from members of the Republican Party and the political situation clarify what to expect in 2025.

In August of 2024, 18 Republicans signed a letter to the House Speaker that stated, “As Members of the House Republican Conference, we write to urge you to prioritize business and market certainty as you consider efforts that repeal or reform the Inflation Reduction Act.” Speaker Johnson himself clarified by saying they expect to take a scalpel to the IRA, not a sledgehammer.

This makes sense! Looking at the solar industry as an economic engine reveals why both sides of the political spectrum want to keep the investments growing. As of 2023, nearly 280,000 Americans work in solar at more than 10,000 solar companies. During that same year, the solar industry generated over $60 billion of private investments for the American economy.

Solar installed 2009-2024Look back since 2009 of solar growth under different U.S administrations from Solar Power World Online.

Furthermore, this economic growth has underlying momentum from falling market prices, not just government solar incentives.

Industry research from SEIA and Wood Mackenzie states:

An average-sized residential solar system has dropped from a pre-incentive price of $40,000 in 2010 to roughly $25,000 today, while recent utility scale solar prices range from $16/MWh – $35/MWh, competitive with all other forms of generation.

Bottom Line:

The solar industry’s momentum has passed the point of no return from an economic and political standpoint. Wisconsin business leaders should not evaluate if solar is here to stay, but rather if it is the right fit for their business.

Rising energy demand is happening across the country, particularly in Wisconsin.

The Wisconsin business community feels the challenge of rising energy costs. Outgoing We Energies CEO Gale Klappa summarized this sentiment in his exit interview with the Milwaukee Business Journal in 2024:

 “The industry that we’re in is going through dramatic change. And from my perspective, the change is occurring at a faster pace than I’ve ever seen it, and I’ve been around the industry for more than 40 years…

We’re on the verge of a different growth era for companies like We Energies. Historically we’ve seen customer consumption of electricity in our region grow at somewhere between a half and seven-tenth of 1% a year. To show you the dramatic change we’re now seeing, starting in 2026, our new forecast shows we expect that growth in energy consumption will be 4.5% to 5% per year.”

To meet this demand, Wisconsin solar utilities are making incredible investments in power generation. The investments are diverse and include a traditional generator like the planned new gas-fired plant in Kenosha County, as well as renewable energy like the recently approved largest solar project in Wisconsin history.
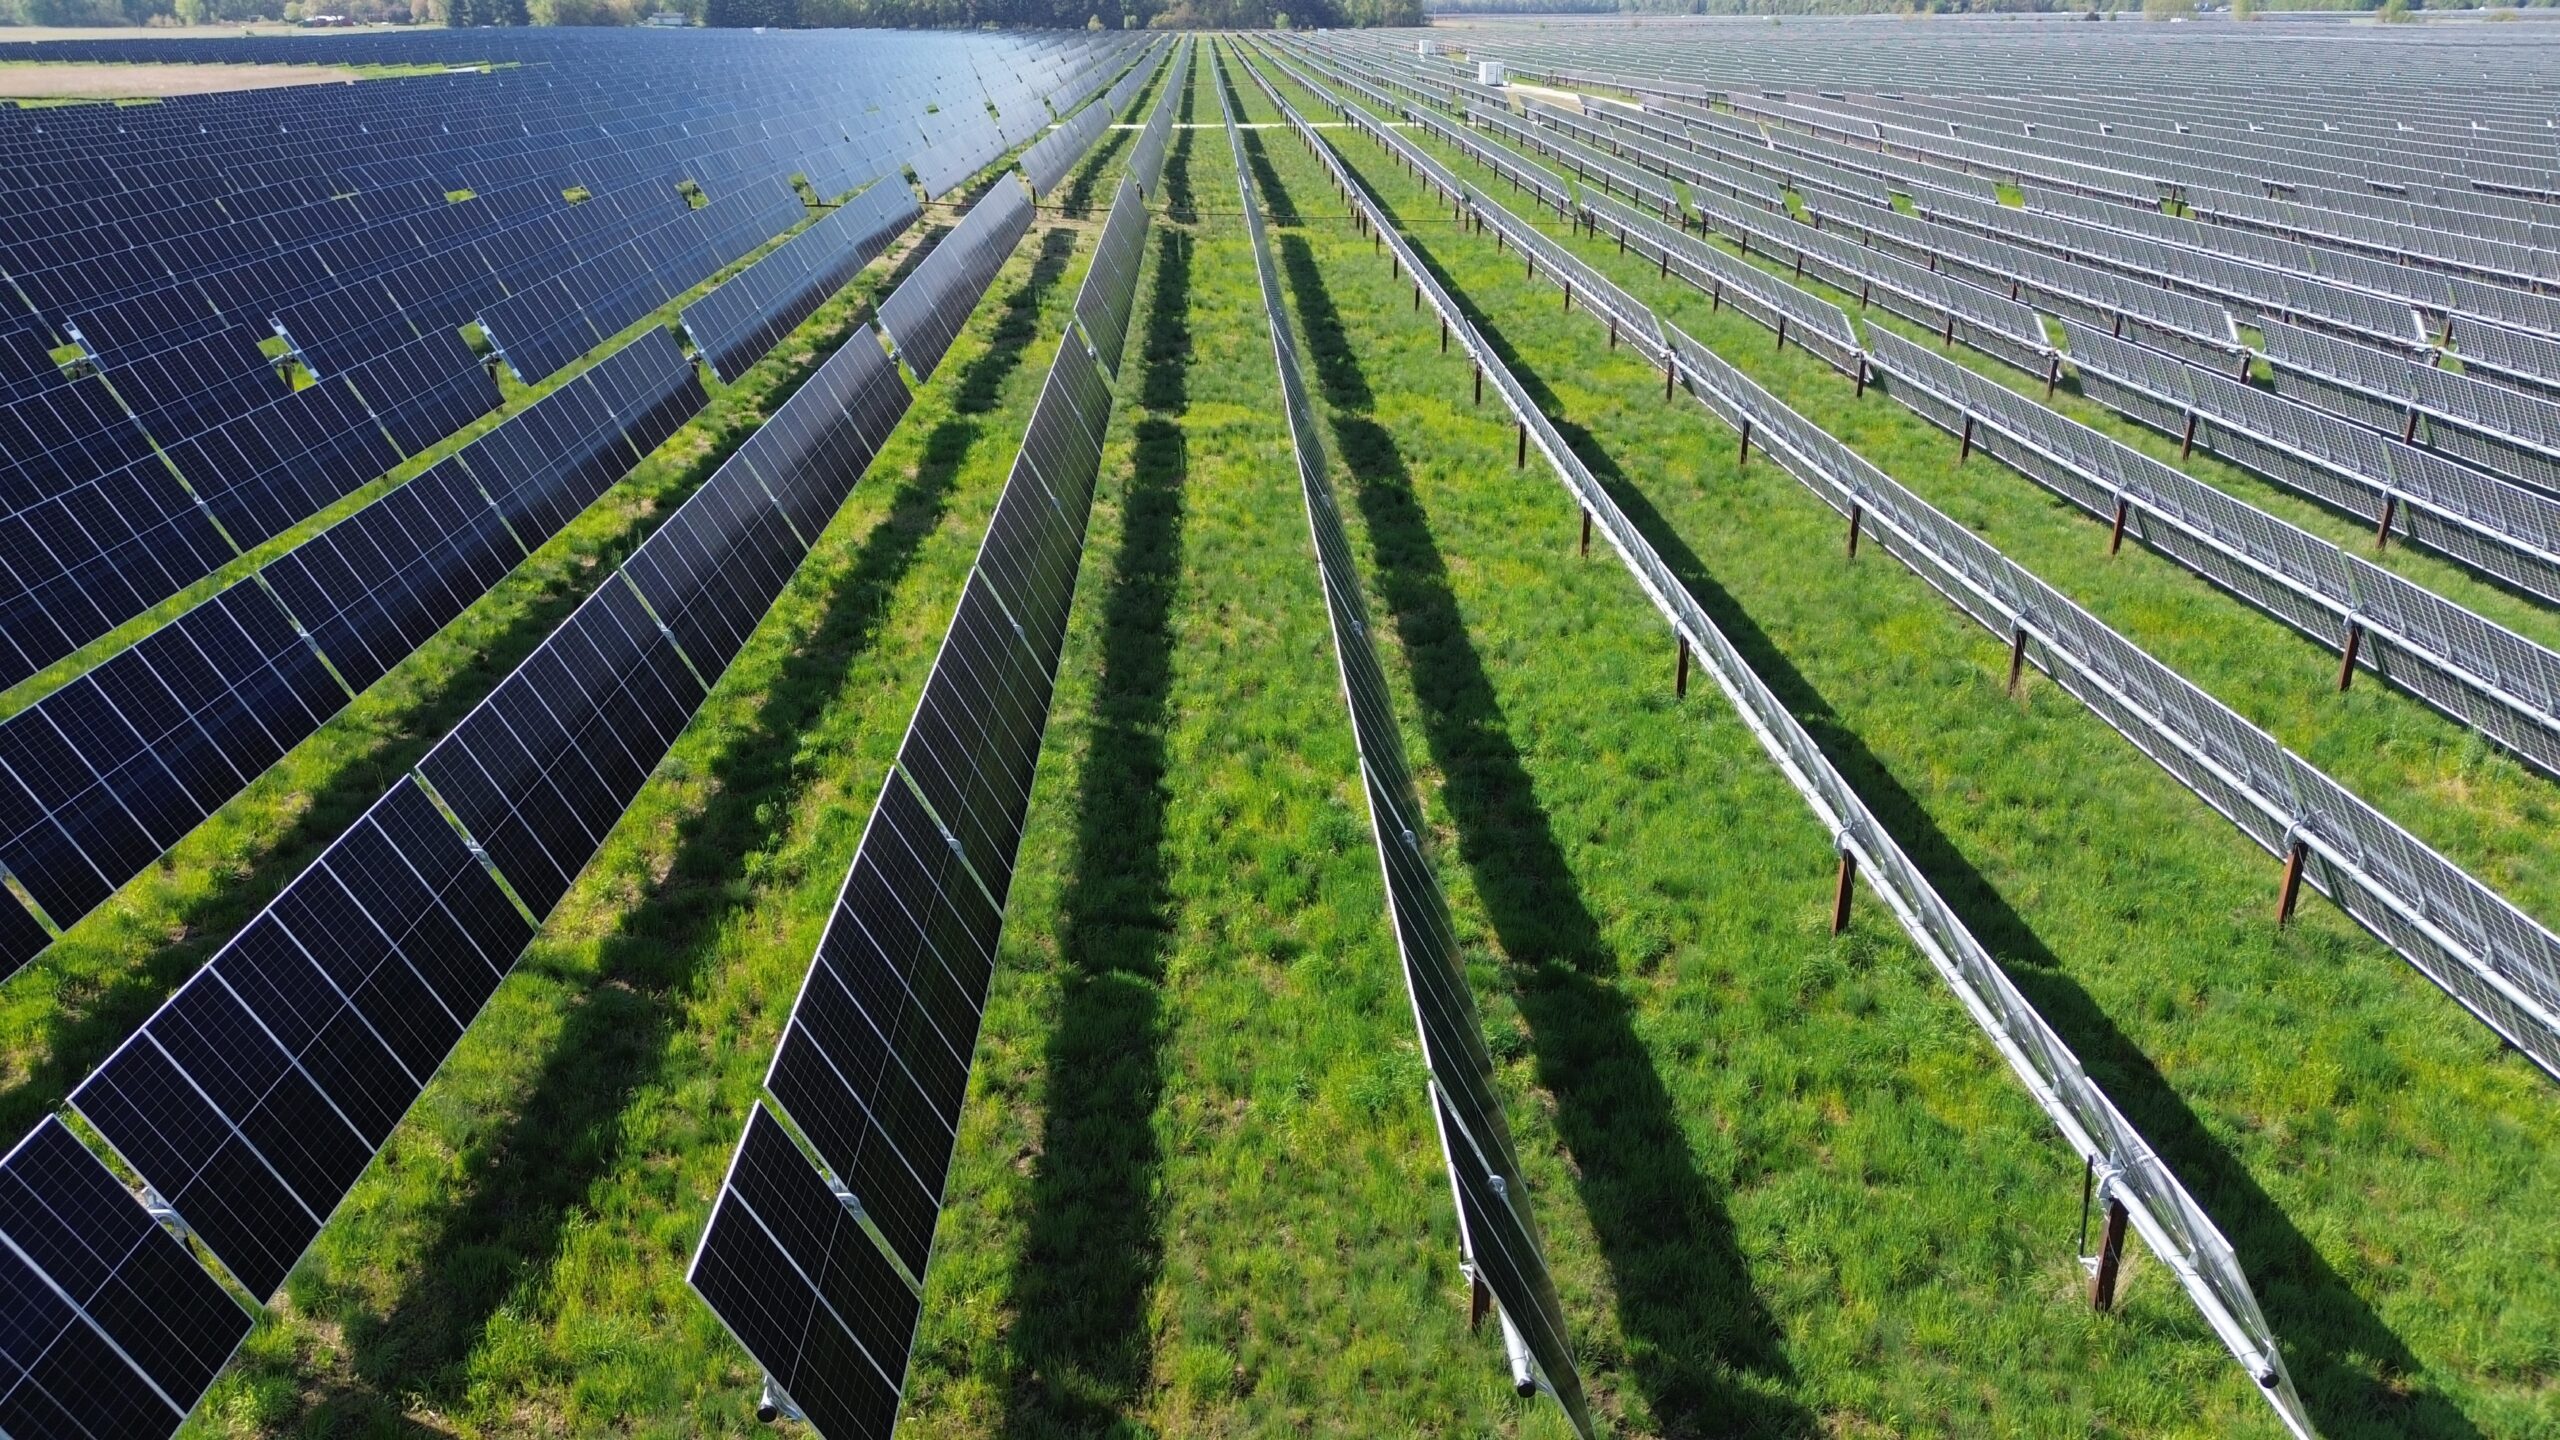
 Rows of solar panels in a fieldImage courtesy of Doral Renewables.

Bottom Line:

With all this energy investment from utilities, there will be increasing competition for grid stability from large energy consumers and a resulting increased burden on ratepayers. One of the few self-sustaining actions a company can take is investing in its own energy with a solar PV system to avoid volatility in electrical prices. 

There is no better time to future-proof your business costs than when heading into economic volatility.

There is no shortage of discussion and argument about whether the Trump Administration’s impending economic policies will achieve its goals. Without details, it’s clear there will be a shake-up from the previous 4 years. 

Looking ahead, uncertainty may become the status quo. For business leaders, that means getting a tight hold of what is in your power to control. This is where solar can make a clear financial win for businesses.

The Wisconsin manufacturing sector provides a perfect example of controllable expense. As leaders of manufacturing companies navigate possible tariffs, investing in on-site solar energy allows CFOs to lock in the price for a portion of their energy costs, while also taking advantage of federal tax credits still on the table.

The business case can be as simple as swapping an energy source that never pays for itself (monthly electric utility bills) for an asset that a business owns which will return its investment and become cash-positive.

Bottom Line:

Economic volatility is often a reason to pause external company investments. However, commercial solar provides on-site energy production and significant utility cost savings that will outlast administration changes for 30 years. Investing while tax credits and financial incentives are abundant is the smartest choice.

At A Glance

  • System Size

    173.6kw

  • Estimated Savings

    $28,483 Annually

  • Utility Provider

    WE Energies

  • Connection Type

    Net Metered

  • Environmental Equivalents

    184,864 Pounds of Coal

At A Glance

  • System Size

    26kw

  • Estimated Savings

    $4,238 Annually

  • Utility Provider

    Two Rivers Water & Light

  • Connection Type

    Parallel Generation

  • Environmental Equivalents

    2,411,958 Smartphones Charged

At A Glance

  • System Size

    23.8kw

  • Estimated Savings

    $3,716 Annually

  • Utility Provider

    Alliant Energy

  • Connection Type

    Parallel Generation

  • Environmental Equivalents

    1,948 Pounds of Coal

At A Glance

  • System Size

    197.6kw

  • Estimated Savings

    $22,293 Annually

  • Utility Provider

    WE Energies

  • Connection Type

    Net Metered

  • Environmental Equivalents

    20,695 Gallons of Gas

At A Glance

  • System Size

    149.5kw

  • Estimated Savings

    $23,913 Annually

  • Utility Provider

    WE Energies

  • Connection Type

    Net Metered

  • Environmental Equivalents

    1.8 Tanker Trucks of Gas

At A Glance

  • System Size

    123kw

  • Estimated Savings

  • Utility Provider

    Madison Gas & Electric

  • Connection Type

    Parallel Generation

  • Environmental Equivalents

    13,709,514 Smartphones Charged

At A Glance

  • System Size

    389kw

  • Estimated Savings

    $56,681 Annually

  • Utility Provider

    WE Energies

  • Connection Type

    Net Metered

  • Environmental Equivalents

    44,398,424 Smartphones Charged

At A Glance

  • System Size

    133.2kw

  • Estimated Savings

    $1,114,935

  • Utility Provider

    Madison Gas & Electric

  • Connection Type

    Parallel Generation

  • Environmental Equivalents

    14,727 Gallons of Gas

At A Glance

  • System Size

    25.7kw

  • Estimated Savings

  • Utility Provider

    WE Energies

  • Connection Type

    Parallel Generation

  • Environmental Equivalents

    26,293 Pounds of Coal

At A Glance

  • System Size

    26kw

  • Estimated Savings

  • Utility Provider

    Alliant Energy

  • Connection Type

    Parallel Generation

  • Environmental Equivalents

At A Glance

  • System Size

    28.86kw

  • Estimated Savings

  • Utility Provider

    WE Energies

  • Connection Type

    Net Metered

  • Environmental Equivalents

At A Glance

  • System Size

    43.6kw

  • Estimated Savings

    $151,039

  • Utility Provider

    WE Energies

  • Connection Type

    Net Metered

  • Environmental Equivalents

    4,817,623 Smartphones Charged

At A Glance

  • System Size

    73.84kw

  • Estimated Savings

    $329,713

  • Utility Provider

    Plymouth Utilities

  • Connection Type

    Parallel Generation

At A Glance

  • System Size

    64.845kw

  • Estimated Annual Savings

    $21,442

  • Utility Provider

    WPS

  • Connection Type

    Parallel Generation

At A Glance

  • System Size

    133kw

  • Estimated Savings

    $386,522

  • Utility Provider

    Alliant Energy

  • Connection Type

    Parallel Generation

  • Environmental Equivalents

    12,550 Gallons of Gas

At A Glance

  • System Size

    26.6kw

  • Estimated Anual Savings

    $3,953

  • Utility Provider

    Alliant Energy

  • Connection Type

    Parallel Generation

  • Environmental Equivalents

    12,578 Pounds of Coal

At A Glance

  • System Size

    128.7kw

  • Estimated Savings

    $513,821

  • Utility Provider

    Manitowoc Public Utilites

  • Connection Type

    Parallel Generation

  • Environmental Equivalents

    13,964,512 Smartphones Charged

At A Glance

  • System Size

    45.5kw

  • Estimated Savings

    $275,531

  • Utility Provider

    WE Energies

  • Connection Type

    Parallel Generation

  • Environmental Equivalents

    4,679,952 Smartphones Charged

At A Glance

  • System Size

    1.825 MW

  • Estimated Savings

    $103,000 Annually

  • Utility Provider

    WE Energies

  • Connection Type

    Direct Sell Rate Tariff

  • Environmental Equivalents

    1,740,000 ton of CO2 emissions

At A Glance

  • System Size

    388.8kw

  • Annual Savings

    $51,288

  • Utility Provider

    WE Energies

  • Connection Type

    Net Metering

  • Environmental Equivalents

    26,104 gallons of gasoline consumed. 22,789 gallons of diesel consumed. 256,673 pounds of coal burned. 3.1 tanker trucks' worth of gasoline.

At A Glance

  • System Size

    388.9kw

  • Annual Savings

    $51,340

  • Utility Provider

    WE Energies

  • Connection Type

    Net Metering

  • Environmental Equivalents

    26,135 gallons of gasoline consumed. 22,815 gallons of diesel consumed. 256,973 pounds of coal burned. 3.1 tanker trucks' worth of gasoline.

At A Glance

  • System Size

    299.3kw

  • Annual Savings

    $42,934

  • Utility Provider

    WE Energies

  • Connection Type

    Net Metering

  • Environmental Equivalents

    20,076 gallons of gasoline consumed. 17,526 gallons of diesel consumed information. 197,404 pounds of coal burned.

At A Glance

  • System Size

    50.7 kW - DC

  • Estimated Savings

    $10,329

  • Utility Provider

    WE Energies

  • Connection Type

    Line Side/Parallel Generation (CGS-NM)

  • Environmental Equivalents

    361,853lbs of coal burned annually

At A Glance

  • System Size

    31.87 kW

  • Estimated Savings

    $4,998 Anually

  • Utility Provider

    WE Energies

  • Connection Type

    Monthly Net Metering (CGS-NM)

  • Environmental Equivalents

    CO2 Emissions: 22.6 Metric Tons 2,341 Gallons of Gasoline

At A Glance

  • System Size

    370kw

  • Estimated Savings

    $1,053,732

  • Utility Provider

    Alliant Energy

  • Connection Type

    Parallel Generation

  • Environmental Equivalents

    401,786 lbs. of Coal or 44,218,770 smartphones charged.

At A Glance

  • System Size

    389kw

  • Estimated Savings

    $1,190,164

  • Utility Provider

    WE Energies

  • Connection Type

    Net Metering

  • Environmental Equivalents

    384,108 lbs. of Coal or 42,273,187 smartphones charged